2. Tarim Oilfield Company, PetroChina Company Limited, Korla Xinjiang 841000, China
Seismic exploration in western China is facing serious challenges from complicated surfaces (steep mountains and numerous gullies) and subsurface structures (thrusts,broken blocks) as well as low ratios of signal to noise (S/N) in seismic data collected[1, 2, 3, 4, 5]. Improvement of quality of seismic data is vital for breakthrough of petroleum prospecting in this region. One of typical examples is the Kuqa depression in the Tarim basin. This area,dominated by Mesozoic and Cenozoic sediments,has good conditions for hydrocarbon generation, with many big oil and gas fields found and a large proved reserve. Its whole exploration is,however,still at a low level because of a series of factors such as complex surface and subsurface structures,big buried depth of reservoirs,long drilling periods and high costs for exploration. To advance exploration in this area,accurate seismic imaging is of great importance. But many geological conditions make it difficult,such as high and steep structures,faults and penetrating salts,steeply dipping strata and large lateral variations of velocity. To solve this problem,Dong et al. used a quantitative method to analyze the complicacy of seismic imaging in this area[6, 7]. Different from synthetic models,seismic imaging of real data is a systems engineering[8]. Its results rely on quality of data,accuracy of the migration operator and reliability of velocity models. For instance,in spite of large lateral variation of velocity and steeply dipping strata that complicate salt structure in the Mexico Golf,relatively high S/N ratios of seismic data in the offshore area made it possible to attain good accuracy of seismic migration and final imaging results. While in the Kuqa depression,both surface and subsurface complicacies lead to extremely low S/N ratios which bring about difficulty to seismic imaging. Thus prestack data processing is a premise to conduct successful seismic imaging in this area. This work attempts to resolve the following problems: (1) Prestack data processing to enhance S/N ratios of data and reconstruct reflective signals from depth. (2) Analysis of seismic migration velocity,and establishment of migration velocity models in combination with log data and sequence stratigraphy. (3) High-accuracy prestack depth migration using a semi-analytical operator to obtain optimal imaging. Some new lines of thought and procedures are suggested to achieve the above objectives.
As reservoirs is deeply buried and often penetrated by salt bodies in the Kuqa depression,prestack data processing is concentrated on reconstructing low-frequency reflective signals,especially the wide-angle signals over far offsets. It needs to solve the surface consistence on a large scale,near-offset strong-amplitude surface waves of distortions,near-surface static correction and data denoising. Because of the extreme importance of the migration velocity model,this work uses commercial technology and the methods developed by ourselves to perform velocity analysis for the modeling,in which log and geological data on salts are incorporated. The tests on the salt model SEG/EAEG show that accurate imaging requires a high-accuracy migration operator. In this work,we use a semi-analytical degenerate Fourier migration operator[9, 10] to perform datum static correction of wave equation and prestack migration imaging,which extends the general split-step Fourier (SSF) migration operator to the case of highly variable lateral velocity and steeply dipping strata[11]. In terms of the above thought and technical lines,this work conduct experiments of prestack time and depth imaging along 17 2D seismic survey lines which cross 10 structures in the Kuqa depression,and obtains good results.
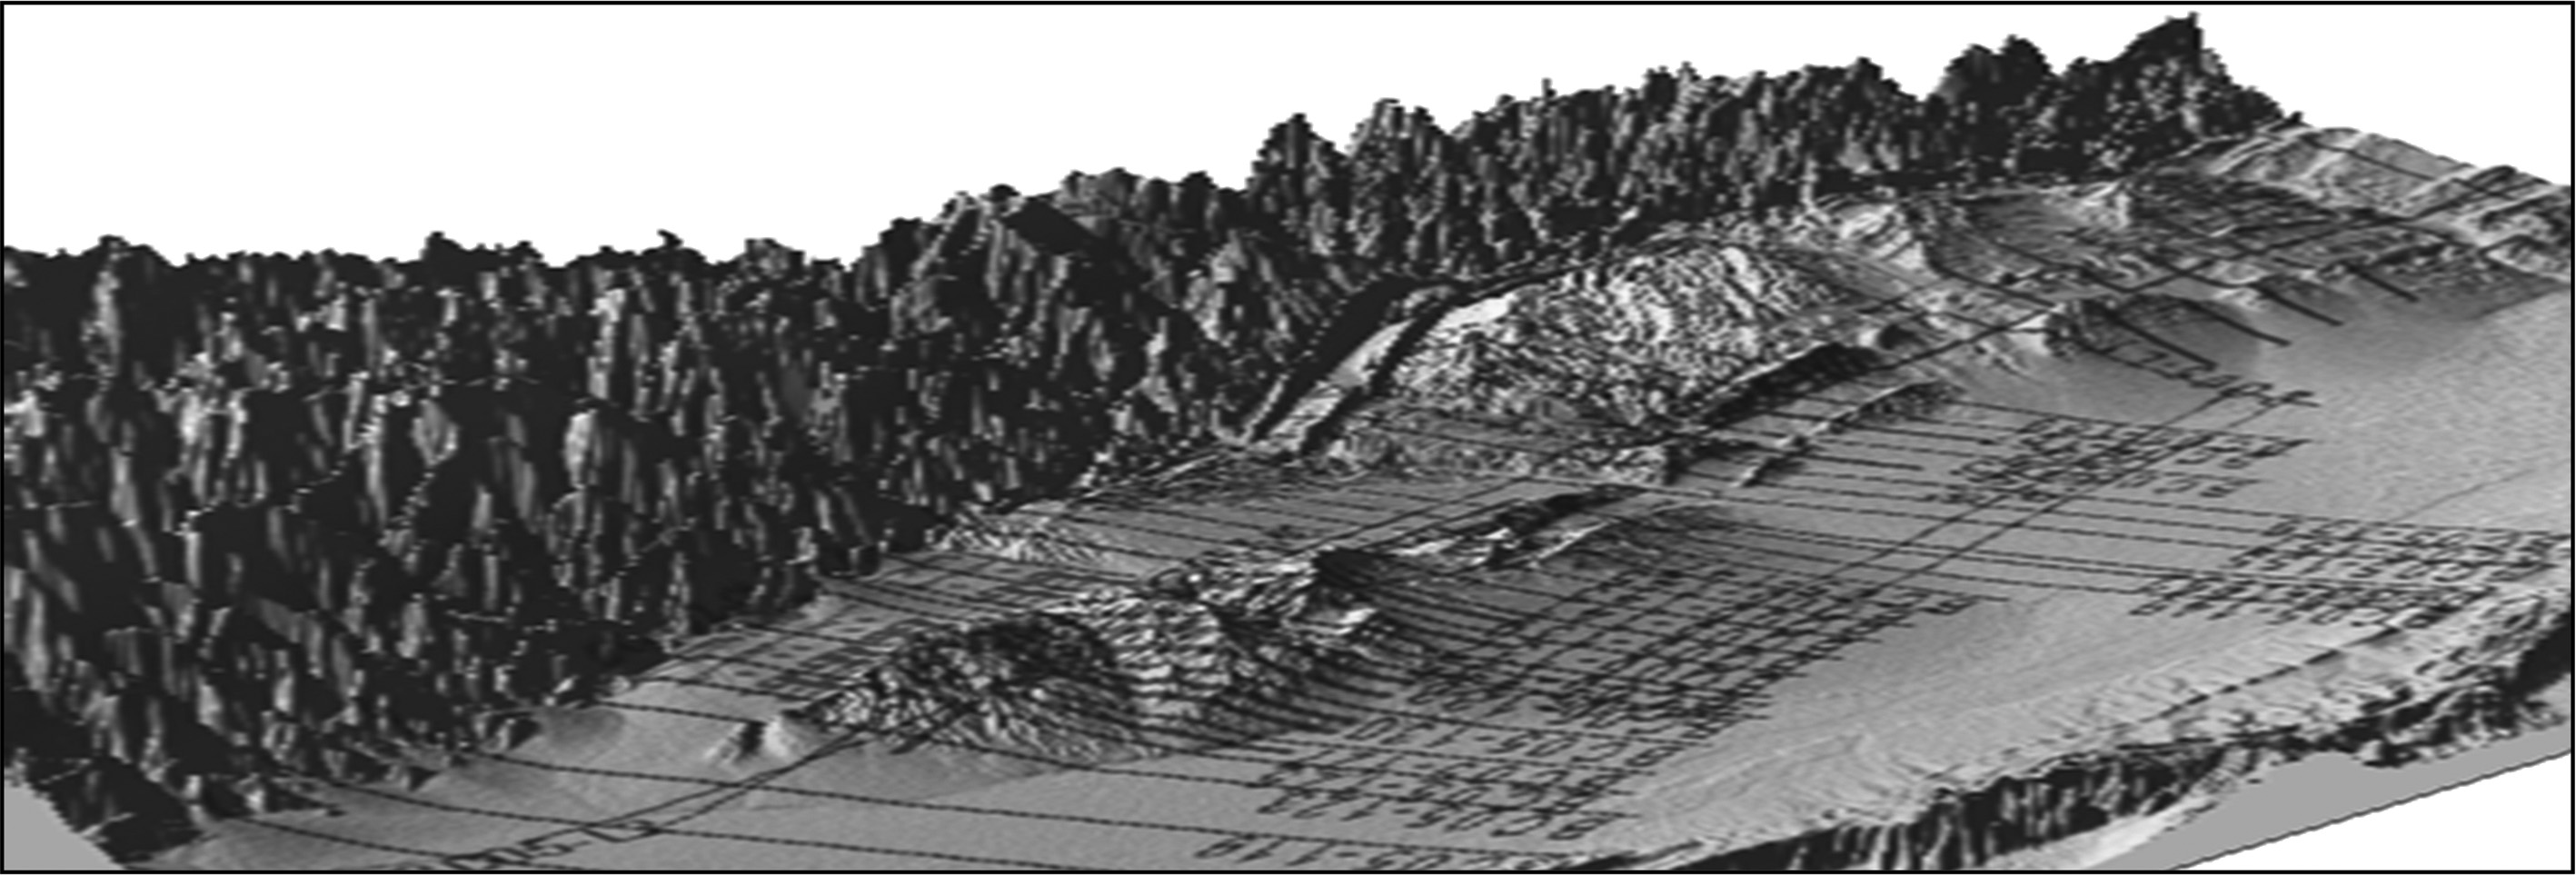
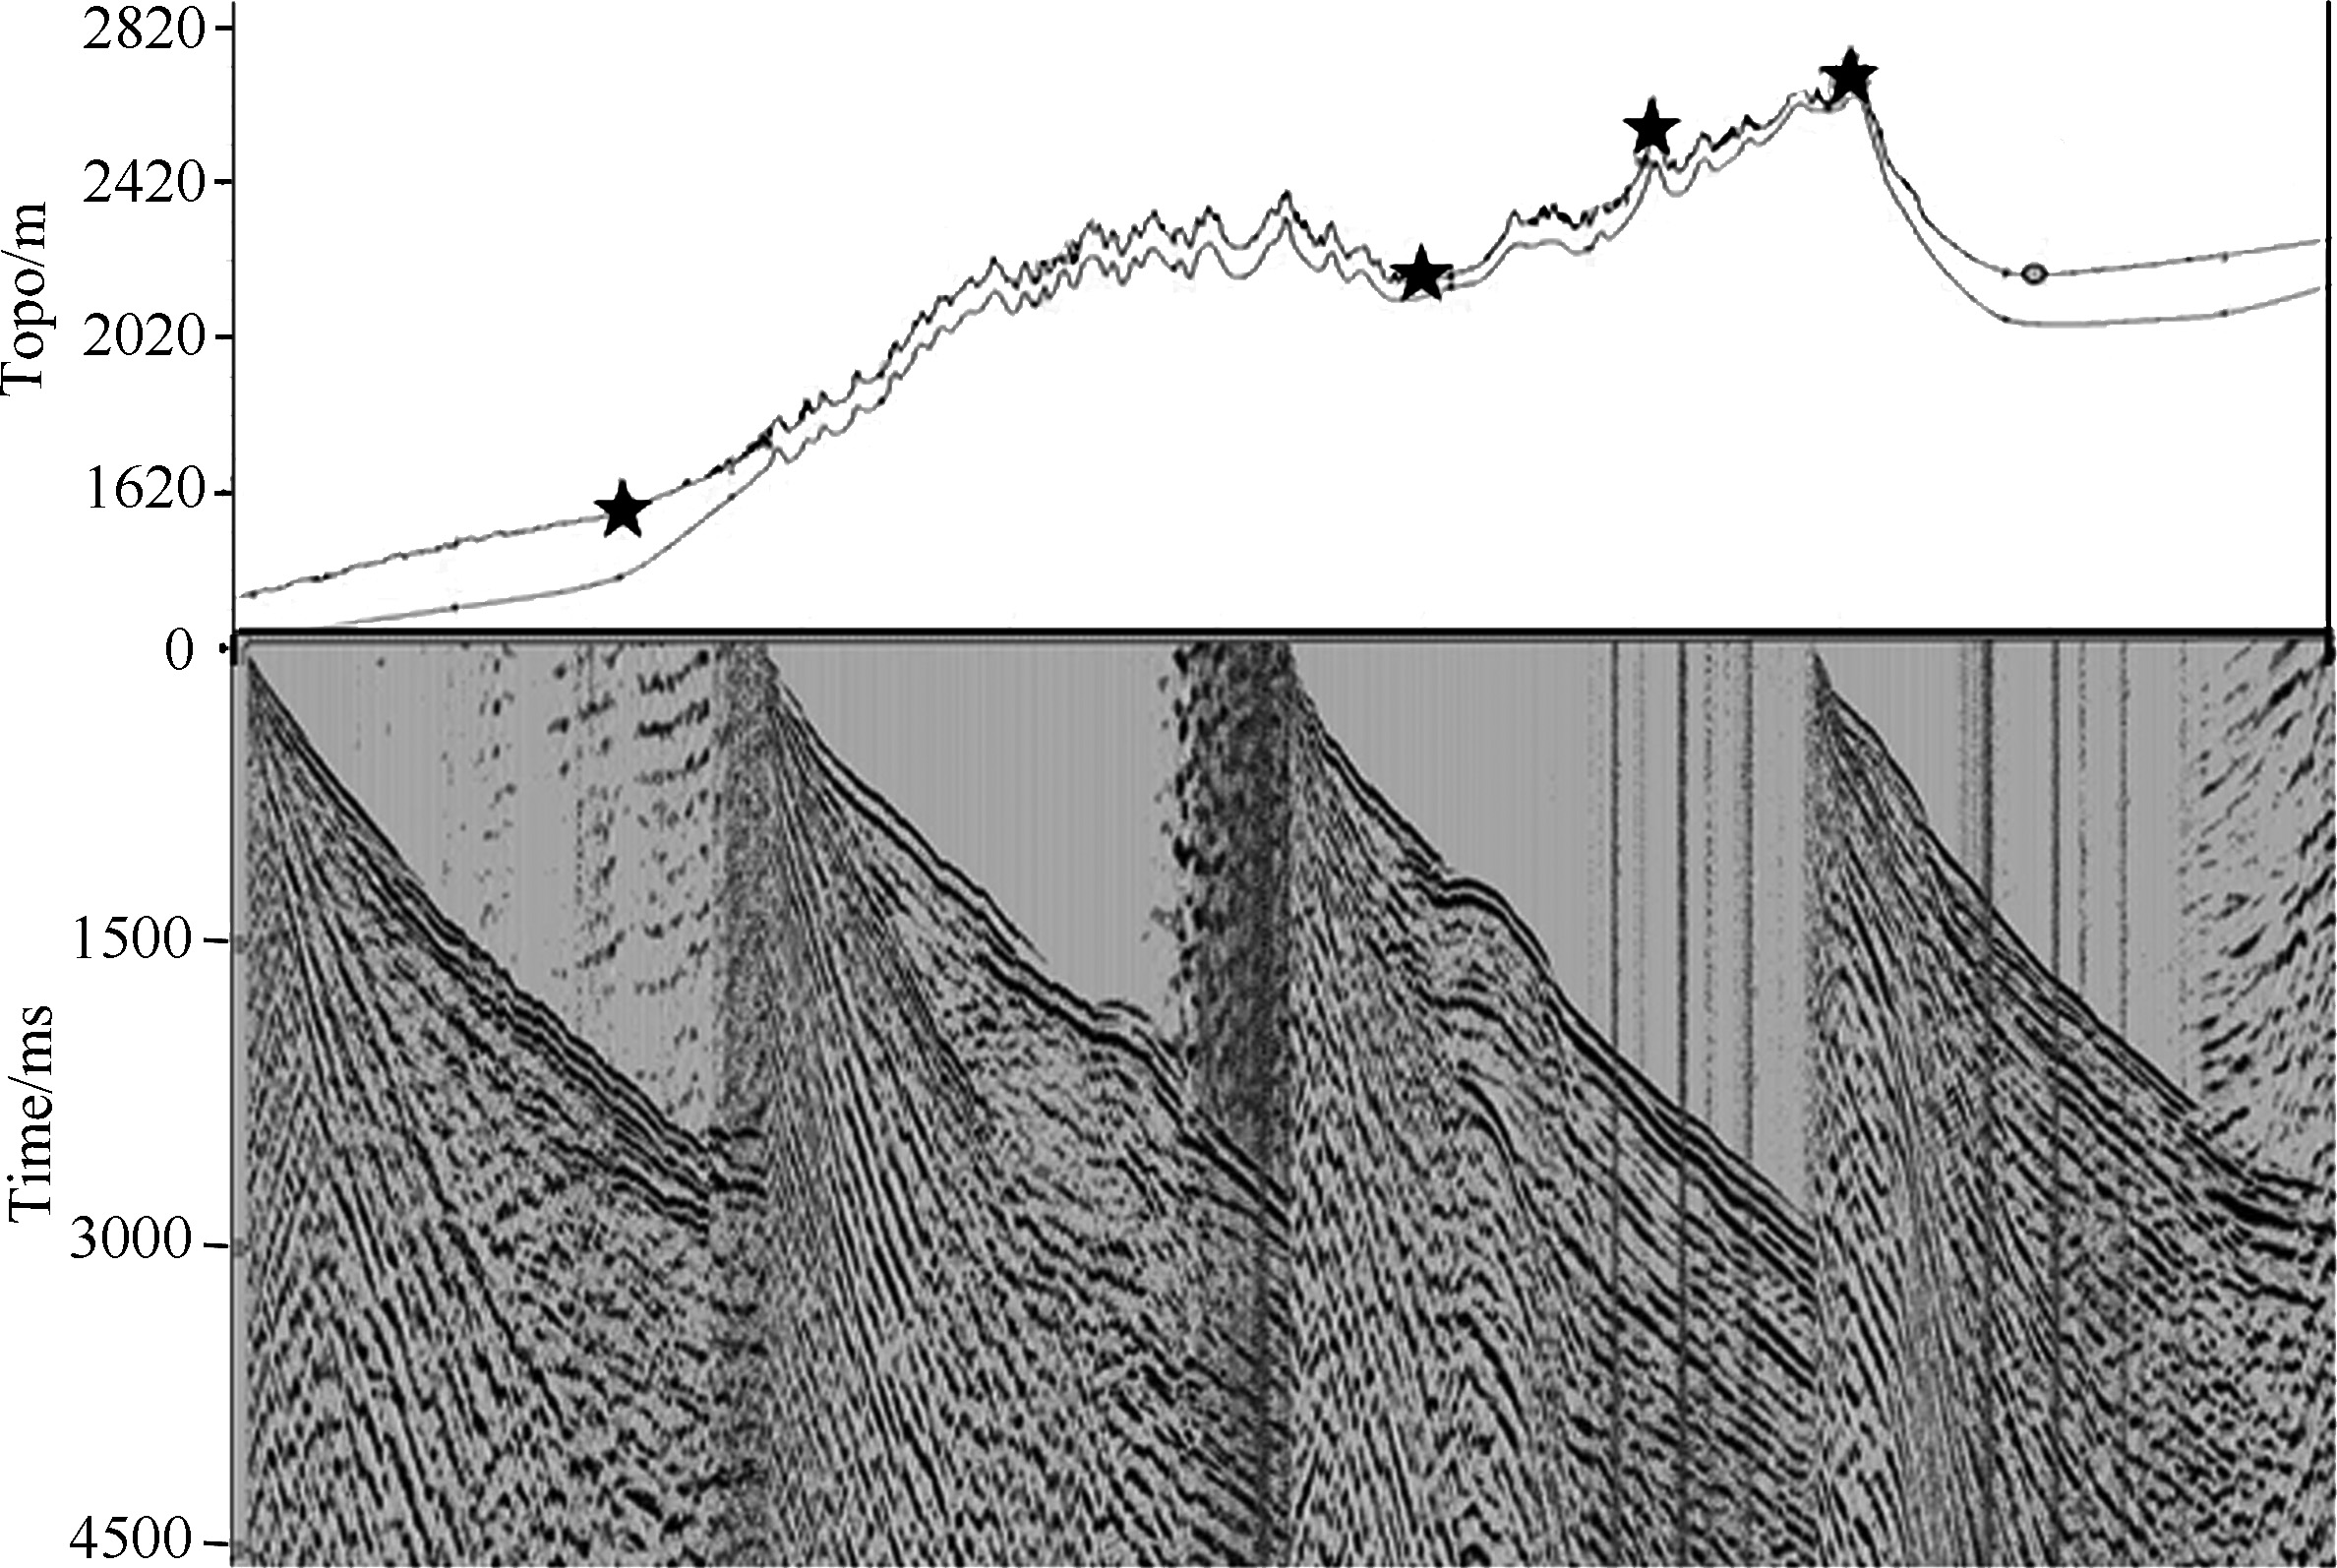
2 COMPLEXITIES IN SEISMIC IMAGING OF STEEP STRUCTURES IN KUQA DEPRESSIONThe Kuqa foreland basin is a east-west trending superposed composite depression at the junction of the Tianshan fold zone and Tarim plate (Fig.1). It abuts the late Paleozoic continental-margin basin of South Tianshan in the north,and neighbors the North Tarim uplift in the south. As shown in Fig.2,rugged ground, steep mountains,numerous valleys and gullies,and big relief (up to 2000 m or more) characterized this area, resulting in intense near-surface scattering. In highly deformed and steeply dipping strata,near-surface seismic velocity changes greatly in horizontal directions,which bring serious distortion to seismic static correction. In Gobi areas with widespread gravel,complicated surface waves of large amplitudes are observed. And weathering and erosion make outcropped rocks loose that can absorb high-frequency waves. All these natural factors pose great difficulties to acquisition of seismic data,as expressed by poor consistence between exciting-receiving conditions and seismic sub-waves (waveform,energy,and frequency),traveltime distortion in shot gathers, broken waveforms,serious dispersion,and semi-random or semi-coherent scattering noise. Almost no wave sets of good in-phase can be seen on seismic records.
|
Fig.1 3D topography for the part of the Kuqa depression and 2D seismic survey lines |
|
Fig.2 Topographic profile of a 2D seismic survey (upper panel) in Kuqa depression and four raw shot gathers (lower panel) with the sources marked by star in the upper figure |
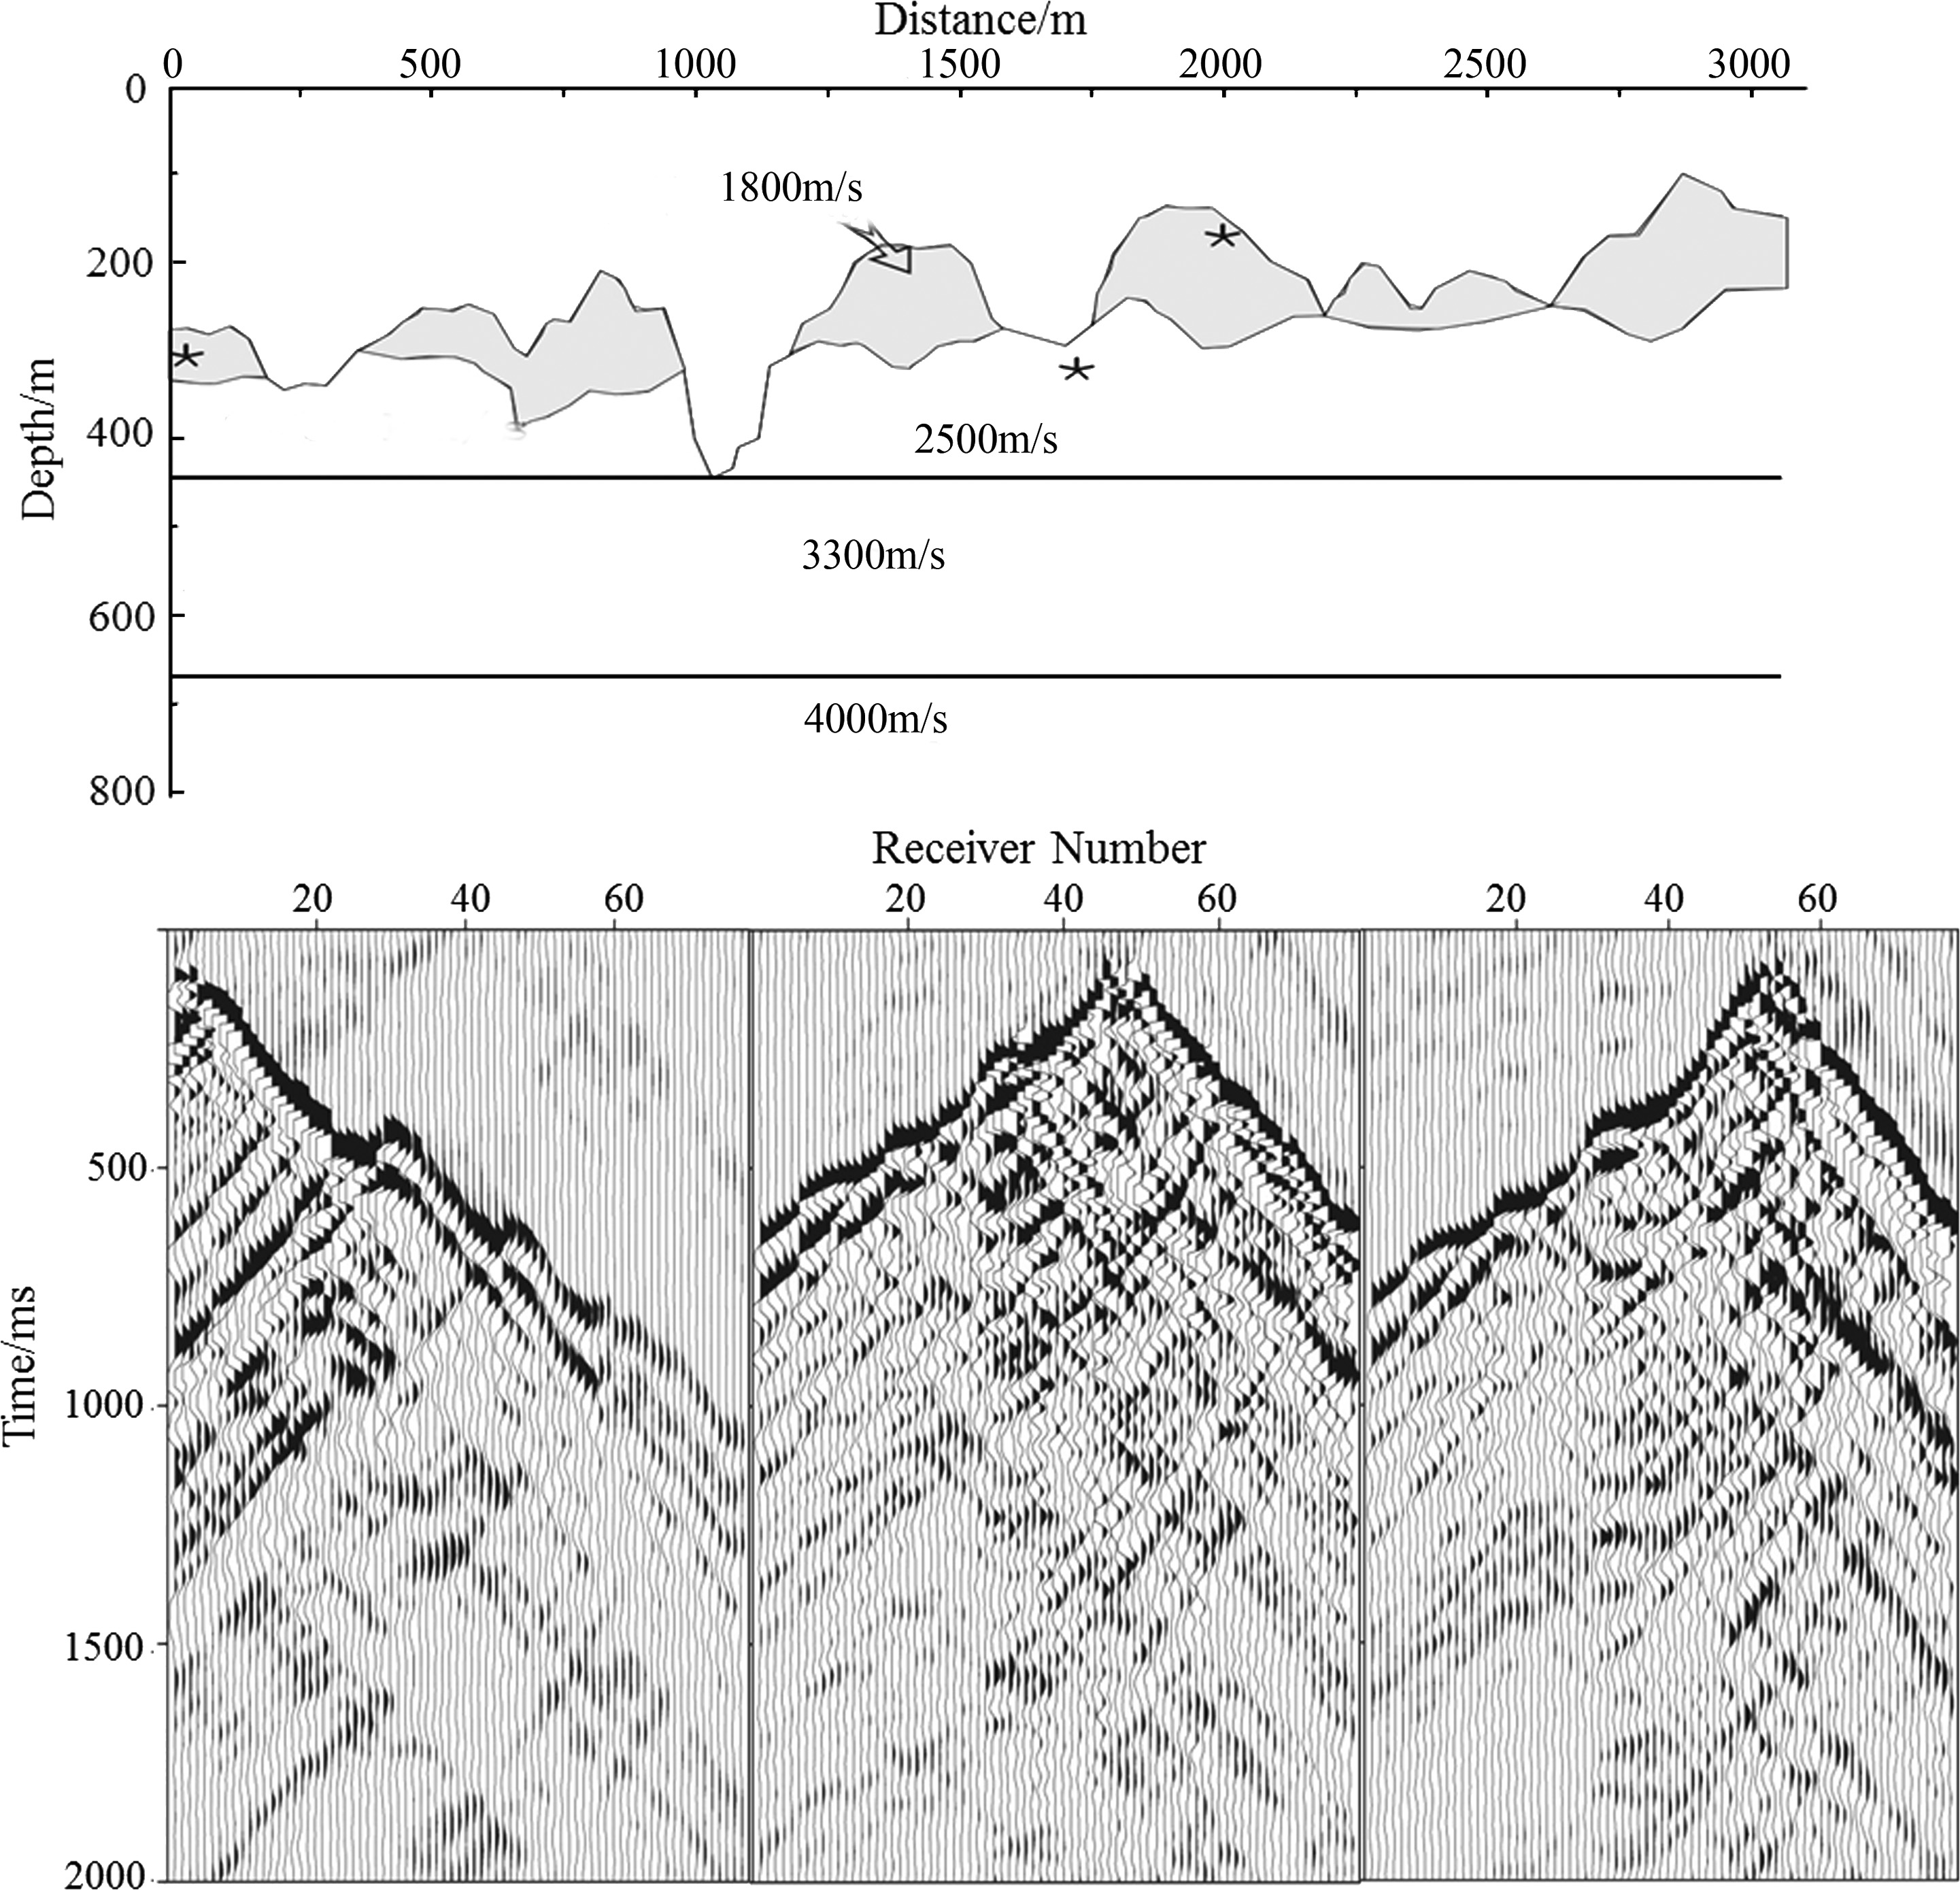
To demonstrate the complexities above,we design a conceptual model to simulate effects of the near-surface on two horizontal reflective layers in the subsurface (upper panel in Fig.3),in which both shots and receivers are on the rugged surface. The resultant three common-shot gathers (lower panel in Fig.3) show that the noise from near-surface strong scattering disturbs or even drowns out the reflective waves from the subsurface layers. Apparently,low S/N ratios in this area are attributed to complicated near-surface conditions which pose a serious limitation on seismic imaging of structures at depth.
|
Fig.3 Conceptual near-surface model with rough topography (upper panel) in Kuqa depression and four synthetic seismograms (lower panel) with receivers along the rugged surface and the sources marked by star in the upper figure |
Many periods of tectonic movements formed a pattern of four uplift and three sag zones in the Kuqa depression. It has a stable basement of Sinian crystalline metamorphic rocks,overlain by thick continental detrital rocks of Mesozoic and Cenozoic ages. Many rows of range-frontal thrust nappes and alternating uplifts and sags characterize this basin. In many places,steeply dipping strata in the subsurface are penetrated by salt bodies and laced with broken faults. Fig.4 illustrates a complex structure model and seismic imaging profile crossing the Xiqiu-Kela 2 structural zone. Obviously,steep dipping of strata,sub-salt structure and high-angle faults can produce a series of problems in seismic imaging such as missing,blurring,and dislocation.

|
Fig.4 KL2 geological structure model (left panel) and seismic imaging section (right panel) crossing the Xiqiu-KL2 structural zone |
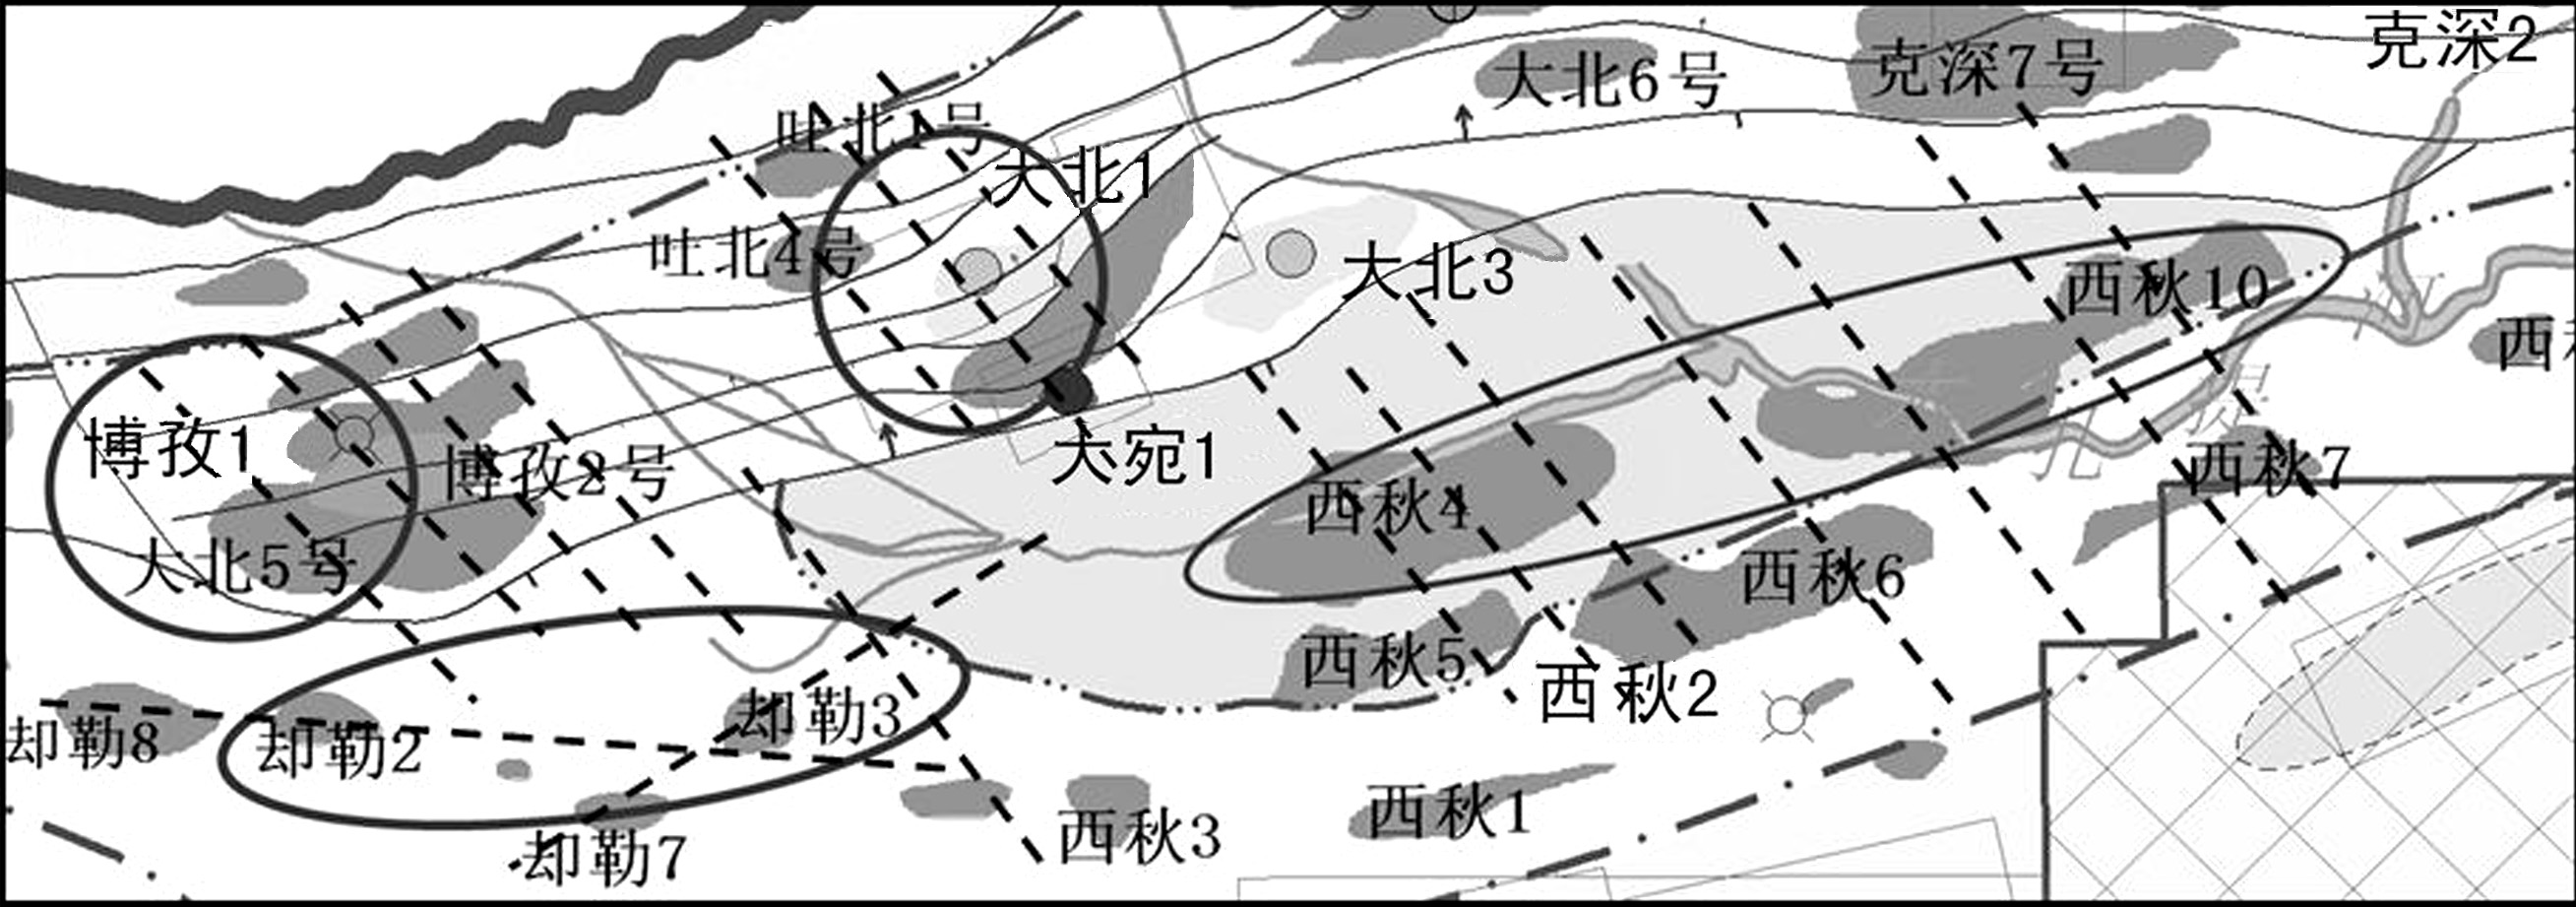
We plan to conduct tests of prestack time and depth imaging on 17 2D seismic survey lines across 10 structures such as Dabei,Bozi,Quele,Xiqiu 4 and Xiqiu 10 in the Kuqa depression (Fig.5). Considering rangefrontal gravel areas,the complex surface,and other poor conditions,a big combination of wide line-spacing is used for data acquisition,which can improve the S/N ratios of data. Besides,a long receiver array (> 14400 m) used increases the migration aperture can help imaging high-angle dipping strata,overthrust nappes and their footwalls.
|
Fig.5 Locations of the Dabei, Bozi, Quele, Xiqiu 4, and Xiqiu etc. 10 key structures and 2D seismic survey lines (dashed line)[6] |
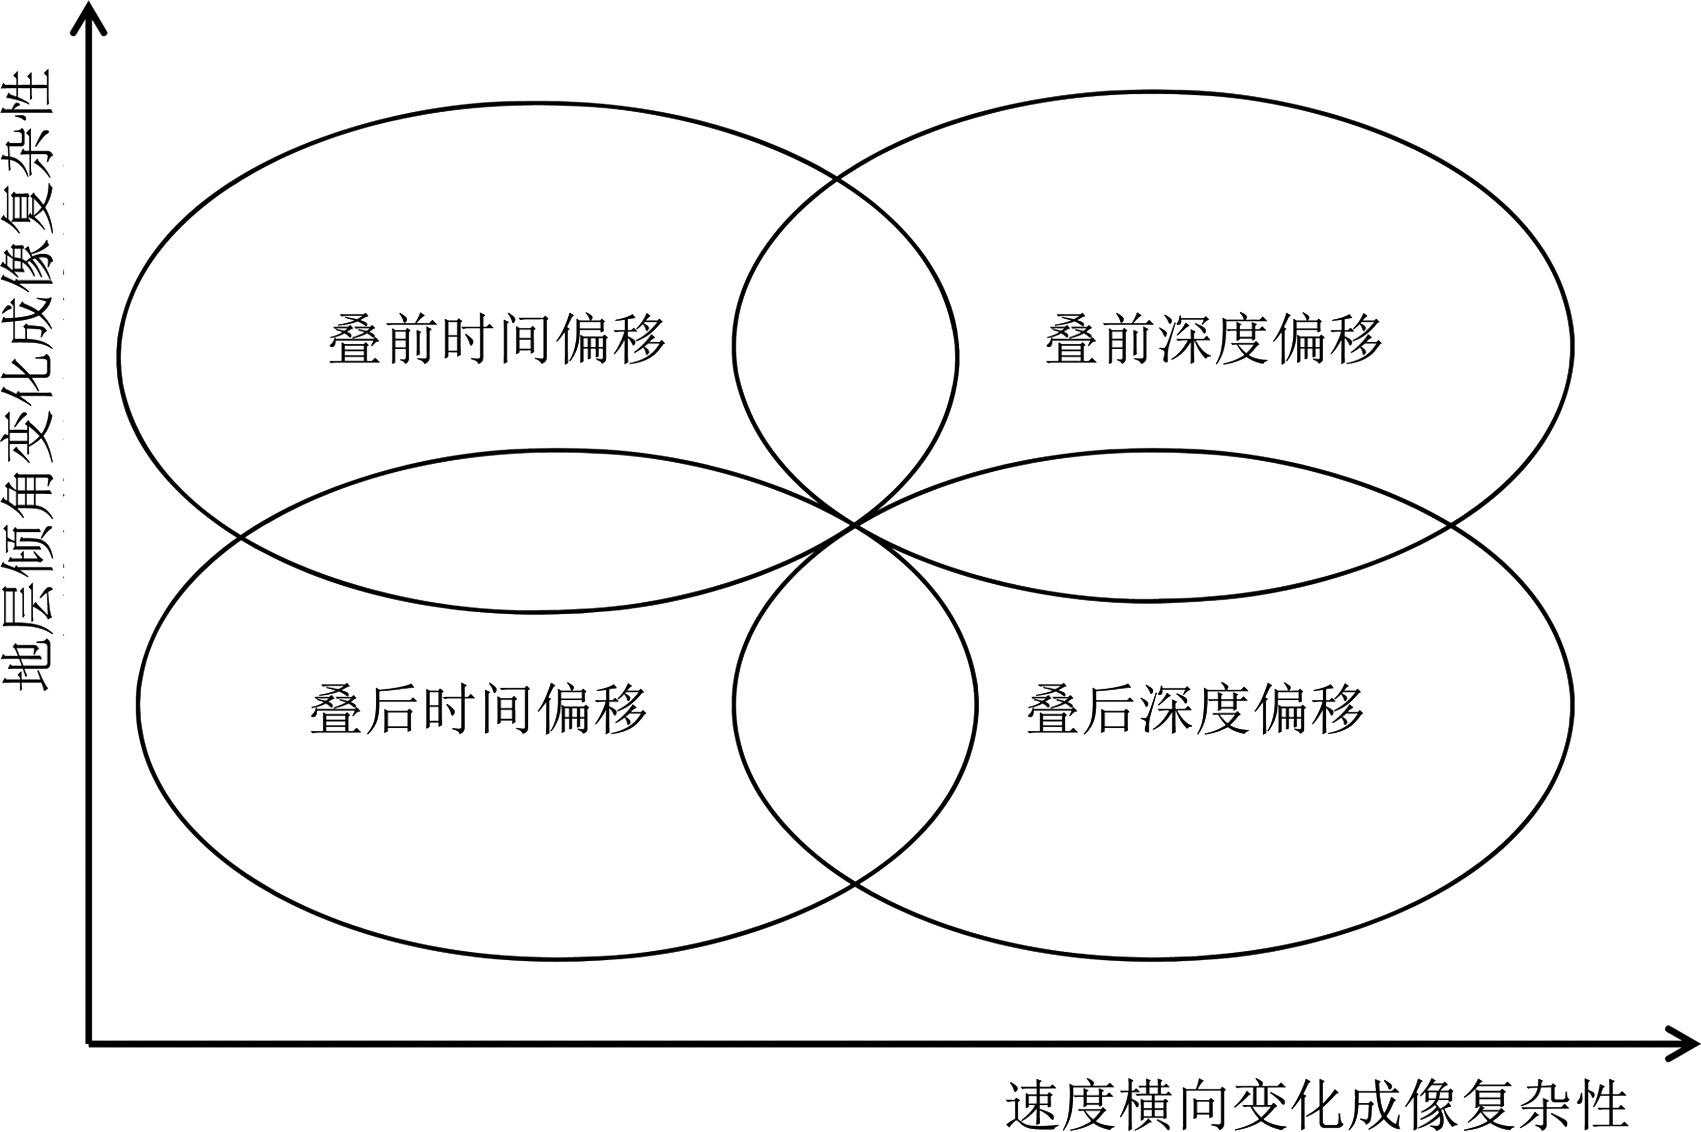
Upon seismic images,we usually see the complexity of subsurface structures from changes of stratum dipping angles and lateral velocity variations (Fig.6),and choose corresponding seismic migration methods. In our previous work[6],we have calculated non-uniform spectra of lateral velocity and stratum dip variations for four structures in the Kuqa depression,and described quantitatively their distributions. Then we made dot product calculation to heterogeneous spectra of geology and angle spectra of the seismic migration operator, and obtained imaging efficiencies and complexity coefficients of these structures. The primary shortcoming of this method is that the resultant complexity coefficient jointly reflects variations of both velocity and dip angles, of which the complexities can sometimes cancel each other out.
|
Fig.6 Schematic diagram of migration method choices qualitatively associated with lateral velocity variations and dipping-angle variations |
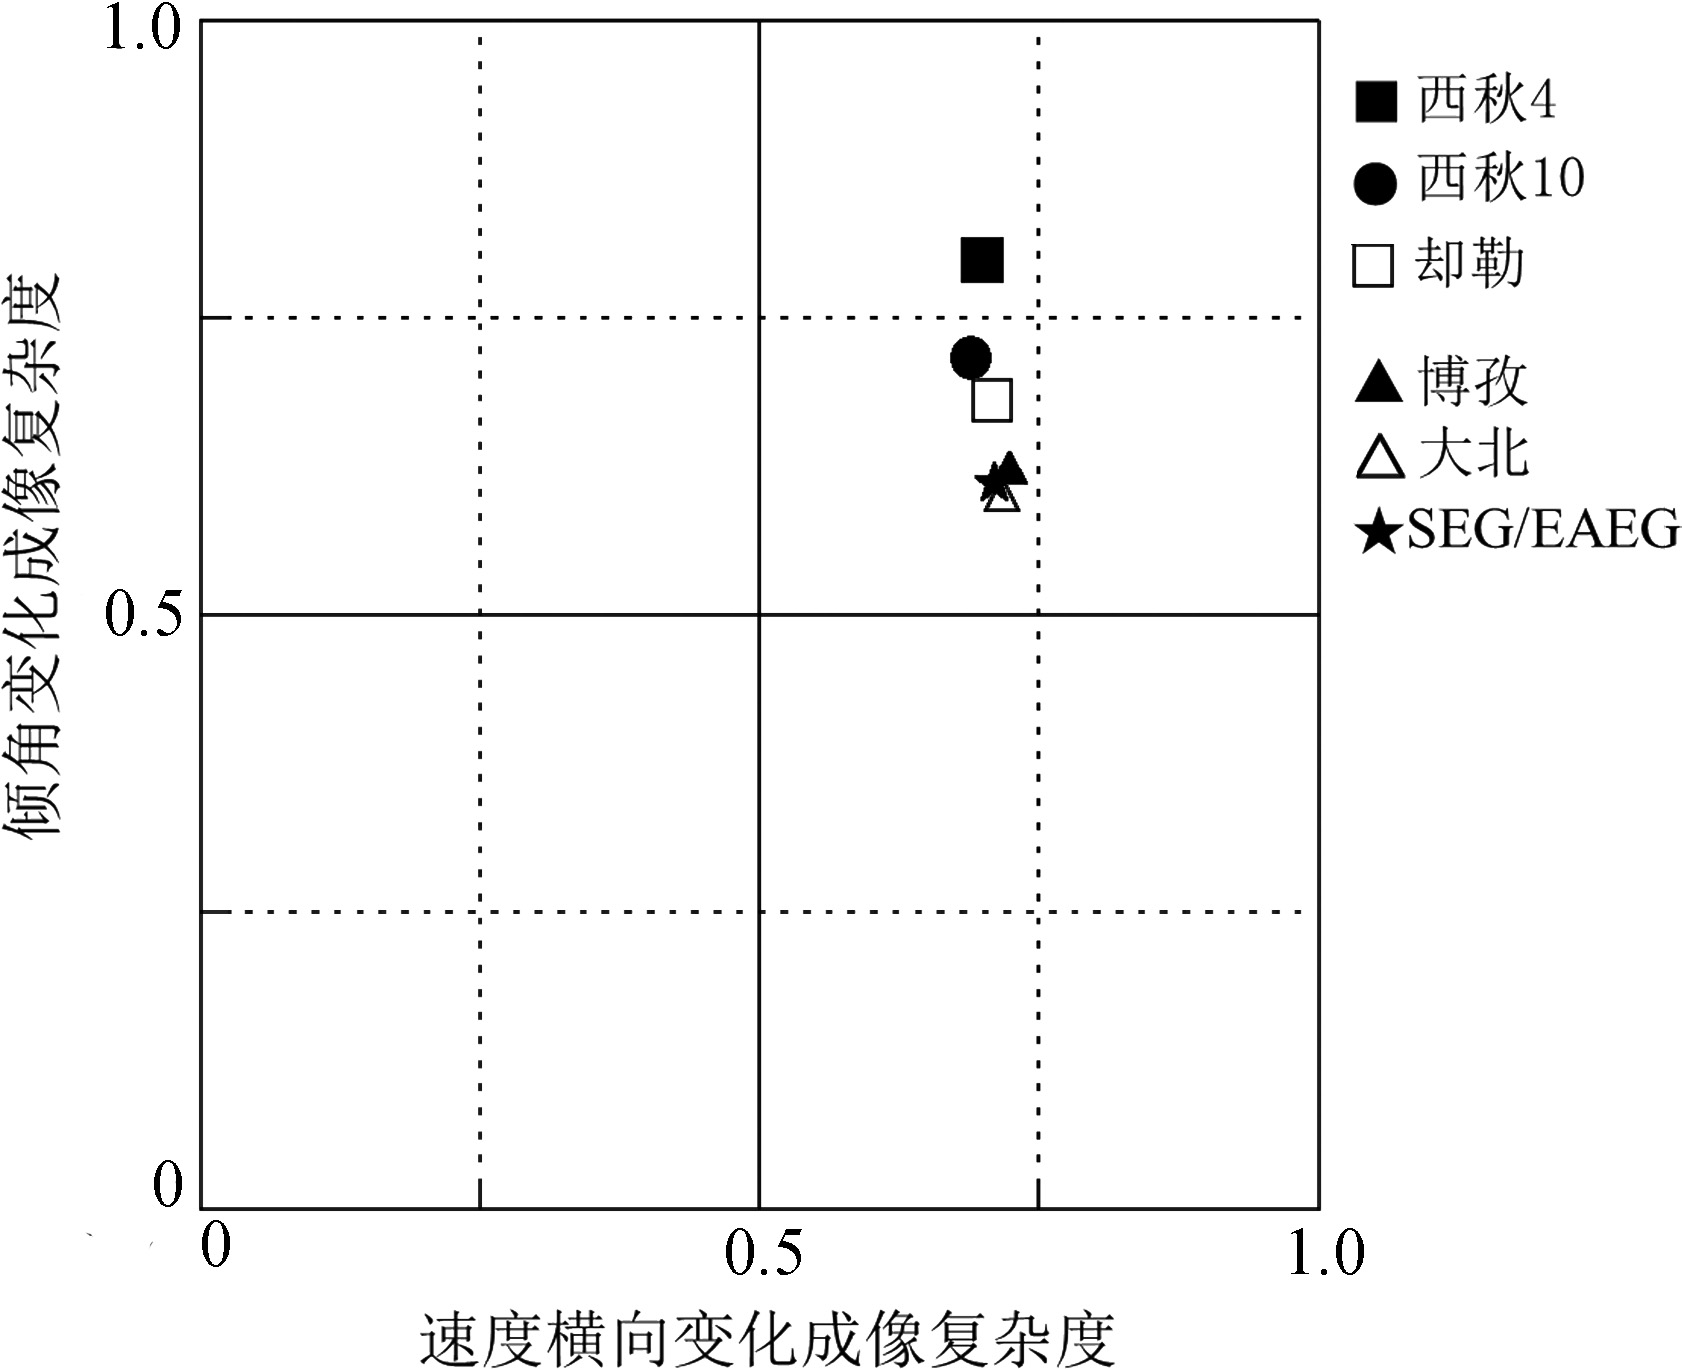
Here we use the SSF migration operator to calculate these complexity coefficients,and compare them with the SEG/EAEG salt model. The calculation of stratum dip angle variations is performed on spectral components in the range 25° to 90°. The results (Fig.7) show that the complexity coefficient in seismic imaging associated with the overthrust salt structure is close to the SEG/EAEG model,of which both exhibit high complexities in dip and lateral velocity variations. Thus reliable seismic imaging requires depth migration. It is noted that the seismic imaging complexity coefficients of strata dip changes differ among structures. The dominant spectral components 60° to 90° represent boundaries of steep salt domes,steep strata below salt domes and high-angle faults,which can generate distortion on seismic images. From Fig.7,the structure along Quele to Xiqiu is more complex than Dabei to Bozi,because the complexity coefficients increase along Quele, Xiqiu 10 to Xiqiu 4 structure (from lower to upper in Fig.7).
|
Fig.7 Complexity degrees of the SSF-migration operator seismic imaging for the structures Dabei, Bozi, Quele, Xiqiu 10 and Xiqiu 4 and SEG/EAEG salt dome |
In sum,the complexities of the surface and subsurface,high-angle faults,and numerous small blocks in the Kuqa depression make seismic imaging very difficult (Fig.4). Consequently,a lot of problems are present in previous data processing results,such as inaccurate migration homing,poor quality of seismic profiles,low S/N ratios,unclear local horizons,chaotic reflections on footwalls of overthrust nappes,image missing of middle and deep structures,and difficult tracing interpretation. Besides,pre- and post-stack denoising leads to over smoothing,thus features of waveforms are not obvious,breakpoints are invisible,and many small faults are removed. Such a situation is widely present in western China,which challenges exploration and exploitation there. Therefore it is necessary to reevaluate these complexities and attempt to use new methods to resolve them, focusing on three aspects: prestack data preprocessing,migration velocity analysis,and prestack migration.
3 PRESTACK DATA PREPROCESSING FOR SEISMIC IMAGING OF COMPLEX STRUCTUREIN THE KUQA DEPRESSION As stated earlier,complicated near-surface and widespread penetrating salt bodies in the subsurface can generate strong near-surface scattering,high-frequency wave attenuation and salt body screening effects,which make reflective signals from depth almost lost completely. Thus,the purpose of prestack data preprocessing is to reconstruct medium- and low-frequency reflective signals from depth,providing data of good quality for subsequent prestack seismic migration.
The effects of complex near-surface on seismic data include the following four expressions:
(1) Semi-random and semi-coherent strong scattering noise,companied with broken waveforms and dispersion caused by near-surface scattering and absorption.
(2) Serious distortion of seismic static correction produced by large terrain relief and near-surface velocity variation.
(3) Near-offset large-amplitude surface waves with amplitude and travel-time distortion recorded in mountains and Gobi with much gravel.
(4) Poor consistence of seismic waves (waveform,energy,frequency) produced by highly changeable exciting and receiving conditions.
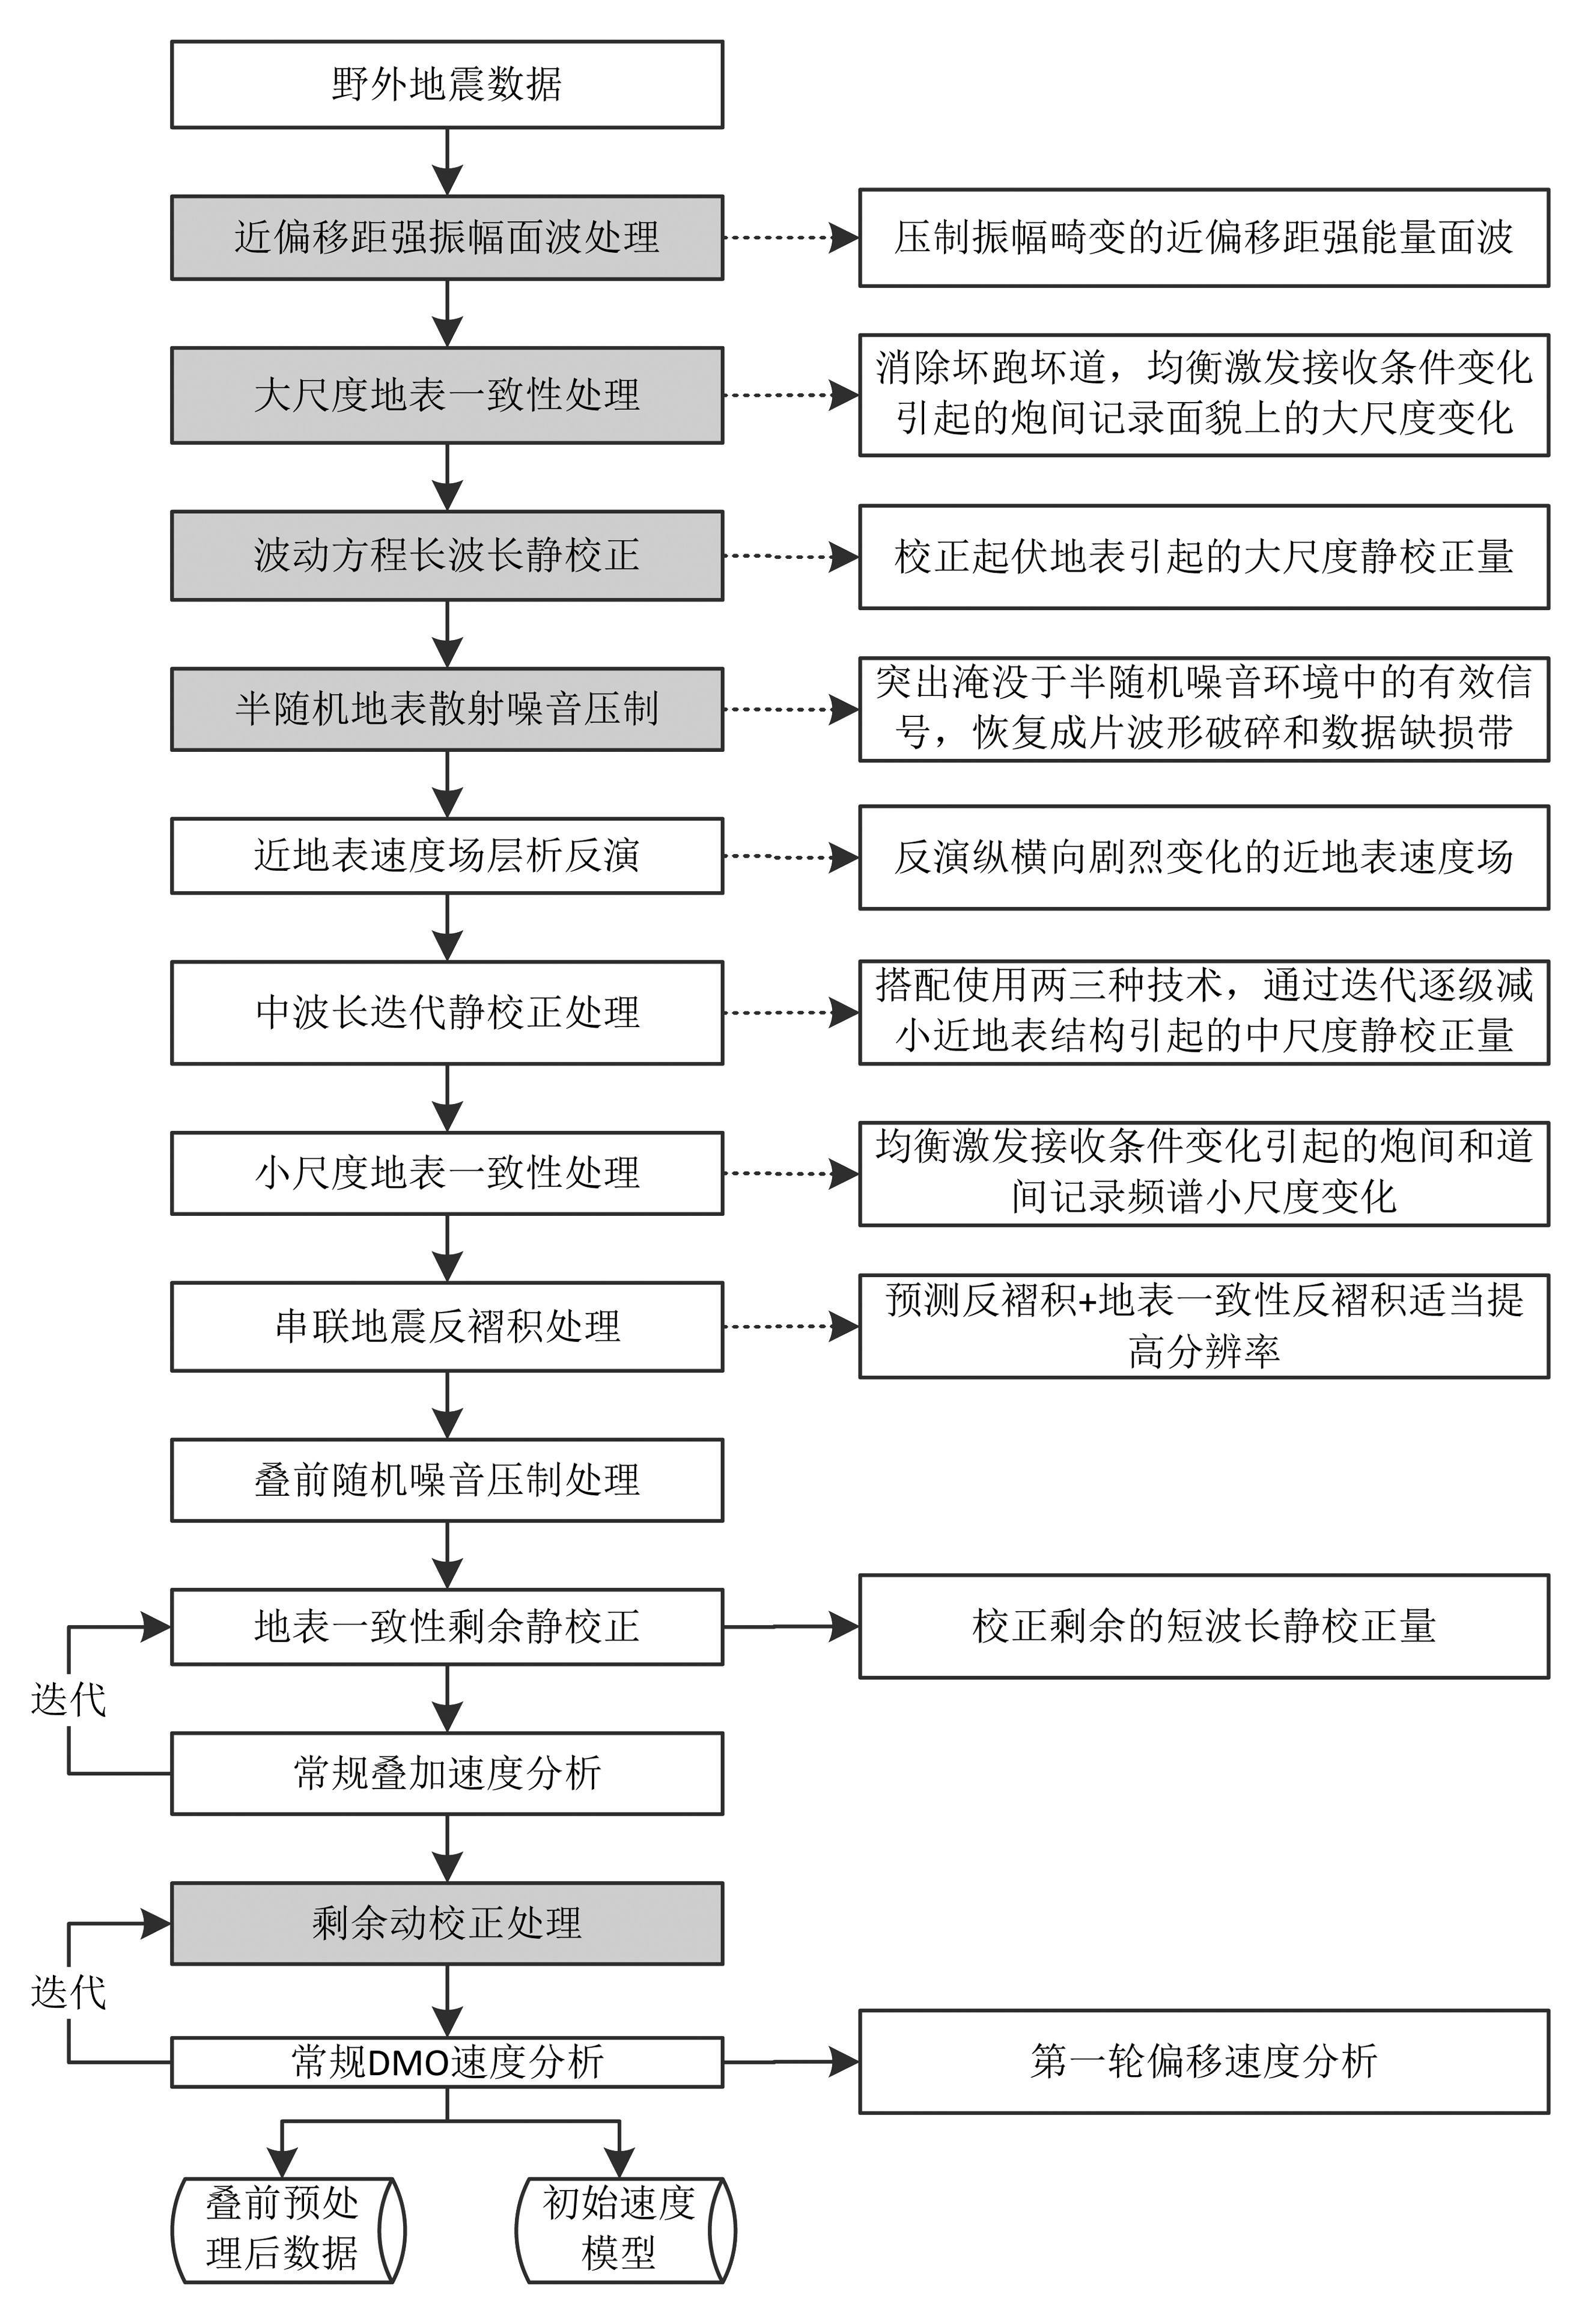
To solve these problems,we have spent many years in repeated experiments through development of new techniques and their combinations,forming a technological flow course of prestack data preprocessing (Fig.8). The purpose is to highlight signal correlation between neighboring gathers and recover reflective signals from depth that are drowned by noise,so that the prestack migration can recognize weak but useful reflective signals. The results of application of several key methods are presented below.
|
Fig.8 Flowchart of data preprocessing before prestack migration (self-developed techniques are in the shadowed frames) |
The seismic records from the Kuqa area contain a wealth of surface waves and near-surface refraction and scattering waves of low velocities,mostly distributed around near-offset. Their frequencies partially overlap that of low-frequency (0~15 Hz) reflective waves from depth. These regular interference waves are characterized by strong energy,amplitude distortion,and serious frequency/wave dispersions. If one uses the simple F-K filter to suppress these interference waves,the useful reflective waves from depth may be damaged. And the other conventional methods based on linear theory do not work well in this aspect,rather they would lead to oversmoothing and signal distortion. To overcome this difficult,the velocity filtering factor should be temporally and spatially variable and adaptive to amplitude. We employ a FKSUB technology[12] (double domain short operator narrow impedance zone 2D filtering + polynomial fit amplitude adjustment) to suppress these interference waves. In this approach,the key is to discriminate tiny differences between the useful and interference waves in their apparent velocity,frequency and amplitude,which can greatly reduce the smoothing effect and signal distortion and protect useful signals. .
In areas of complex surface conditions,seismic records contain bad shots,bad gathers and expanse interference bands. Conventional methods cannot solve these problems. We use a broad-band propagation operator, which can realize large-scale surface consistence,to remove these anomalous variations. It can reach energy balance automatically,compensating energy of remote and near gathers and medium to large depths. Fig.9 shows the results of such a processing to original data. Then,the processing of other small-scale surface consistence issues is further conduced in terms of various commercial technologies,such as waveforms of sub-waves, amplitudes,and anti-alias. Consequently,small variations in frequency spectra between shots and gathers are adjusted and S/N ratios on dominant bands are enhanced,which will facilitate subsequent velocity analysis and seismic migration imaging.

|
Fig.9 Single shot gathers before (left) and after (right) processing of large-scale surface-consistence |
Static corrections include three kinds,i.e. long wavelength,medium wavelength and short wavelength. The long-wavelength static correction is concerned with big relief of the surface. The conventional method based on assumption of surface consistence for this correction requires that rays leave off the surface at a small angle,resulting large errors,which is not suitable to the Kuqa depression. While the wave-equation datum continuation does not need this assumption and can preserve kinetic features of wave fields. But this approach requires calculation on shot and geophone gathers,respectively,for which the common finite difference method is time consuming and of low efficiency. We have developed a Fourier wave-equation datum correction technology[12] and apply it to the Kuqa area. This method calculates fast,not limited by aperture,and robust to strong lateral velocity change. It needs,however,a accurate near-surface velocity model that is not available in the Kuqa area. In practice,we utilize the wave equation correction based on layer replacement or floating datum,and the resultant cumulative errors will be treated in medium-wavelength static correction below.
The medium-wavelength static correction is to handle the errors caused with near-surface velocity variations and from long-wavelength correction. It uses an equivalent model of near-surface velocity and traveltimes of refractive waves,direct waves and reflective waves to conduct iterations. Note that in the areas with complex terrains and highly variable near-surface lithology,this static correction may have bad results. The reasons for it include: (1) In the case of highly changeable lateral velocities,it is impossible to have an accurate velocity model of the near-surface. (2) The assumption of vertical emergence of rays can produce big errors for time-lapse correction. (3) When data have low S/N ratios,first arrivals of refractive and direct waves are disordered,so it is very difficult to pick up them.
The short-wavelength static correction is to deal with the residual errors after processing above. It includes multiple times of static correction and normal moveout correction in combination with alternative velocity analysis. Overall,static correction is a very sophisticated technology which relies on choice of methods and parameters. Besides,the frequency-division correction method can be used to complex areas,in which distinct static corrections are performed to the wave fields of different frequencies[14].
As conventional denoising methods cannot deal with semi-random and semi-coherent noise,we attempt to explore new lines of thought on this issue. Although all signals from the subsurface follow the rule of wave propagation,there are differences,though small,between useful reflective waves and noise including surface waves,multiples,and scattering in their propagation paths,frequencies,and velocities. So it is possible to use these differences to recover weak useful signals drowned in noise. One approach is to highlight useful signals by wave-equation filtering,thus noise is suppressed. With Green function in the frequency domain[15],we can construct various filter operators of wave equation. Then we use these operators to filter seismic data to reconstruct signals of features in varied frequency bands. Fig.10 shows the result of a preliminary test on this treatment. It indicates that signals and noises are partially separated,weak reflective waves from depth become clearer and exhibit some in-phase features,and semi-random noises are weakened automatically.

|
Fig.10 Raw shot gathers (left panel) with its version after static correction and wave-equation filtering (right panel) |
To enhance resolution,we utilize surface consistence deconvolution and prediction deconvolution which do not damage S/N ratios. Meanwhile the wavelets are adjusted by surface consistence Q filtering,so that wavelets of the shallow,middle and deep subsurface can be kept largely consistent. Finally,we use the 4D high- and low-frequency random noise-suppressing,which has good amplitude-preservation nature,and frequency-division strengthening to highlight reflective components on dominant bands and enhance their S/N ratios.
Stack velocity analyses include 2~3 iterations between surface consistence residual static correction and conventional stack velocity analysis,and 2~3 iterations between residual normal moveout correction and DMO velocity analysis. Because surface consistence residual static correction only considers the positions of the source and receiver on the surface,not related to subsurface rays,in-phase stack of reflective waves in CDP gathers cannot be stacked completely. Due to excitation and receiving conditions,irregular near-surface velocities and anisotropy of subsurface media,normal moveouts in CDP gathers are usually not of perfect hyperbolic curves.After conventional normal moveout correction,local errors are still present which need to be handled further.
When the preprocessing procedures above are finished,the processed data and initial migration velocity model are output,which are checked by data stack. Fig.11 and Fig.12 display the velocity spectra and stacked pure-wave section from data preprocessing in this work. In comparison with the results using conventional methods,the preprocessing methods proposed in this work are very effective.

|
Fig.11 Velocity spectra and CDP gathers resulted from conventional preprocessing techniques (left panel) and preprocessing techniques developed in this work (right panel) |

|
Fig.12 Raw stack sections for the Xiqiu4 structure derived from conventional preprocessing techniques (upper panel) and the preprocessing techniques developed in this work (lower panel) |
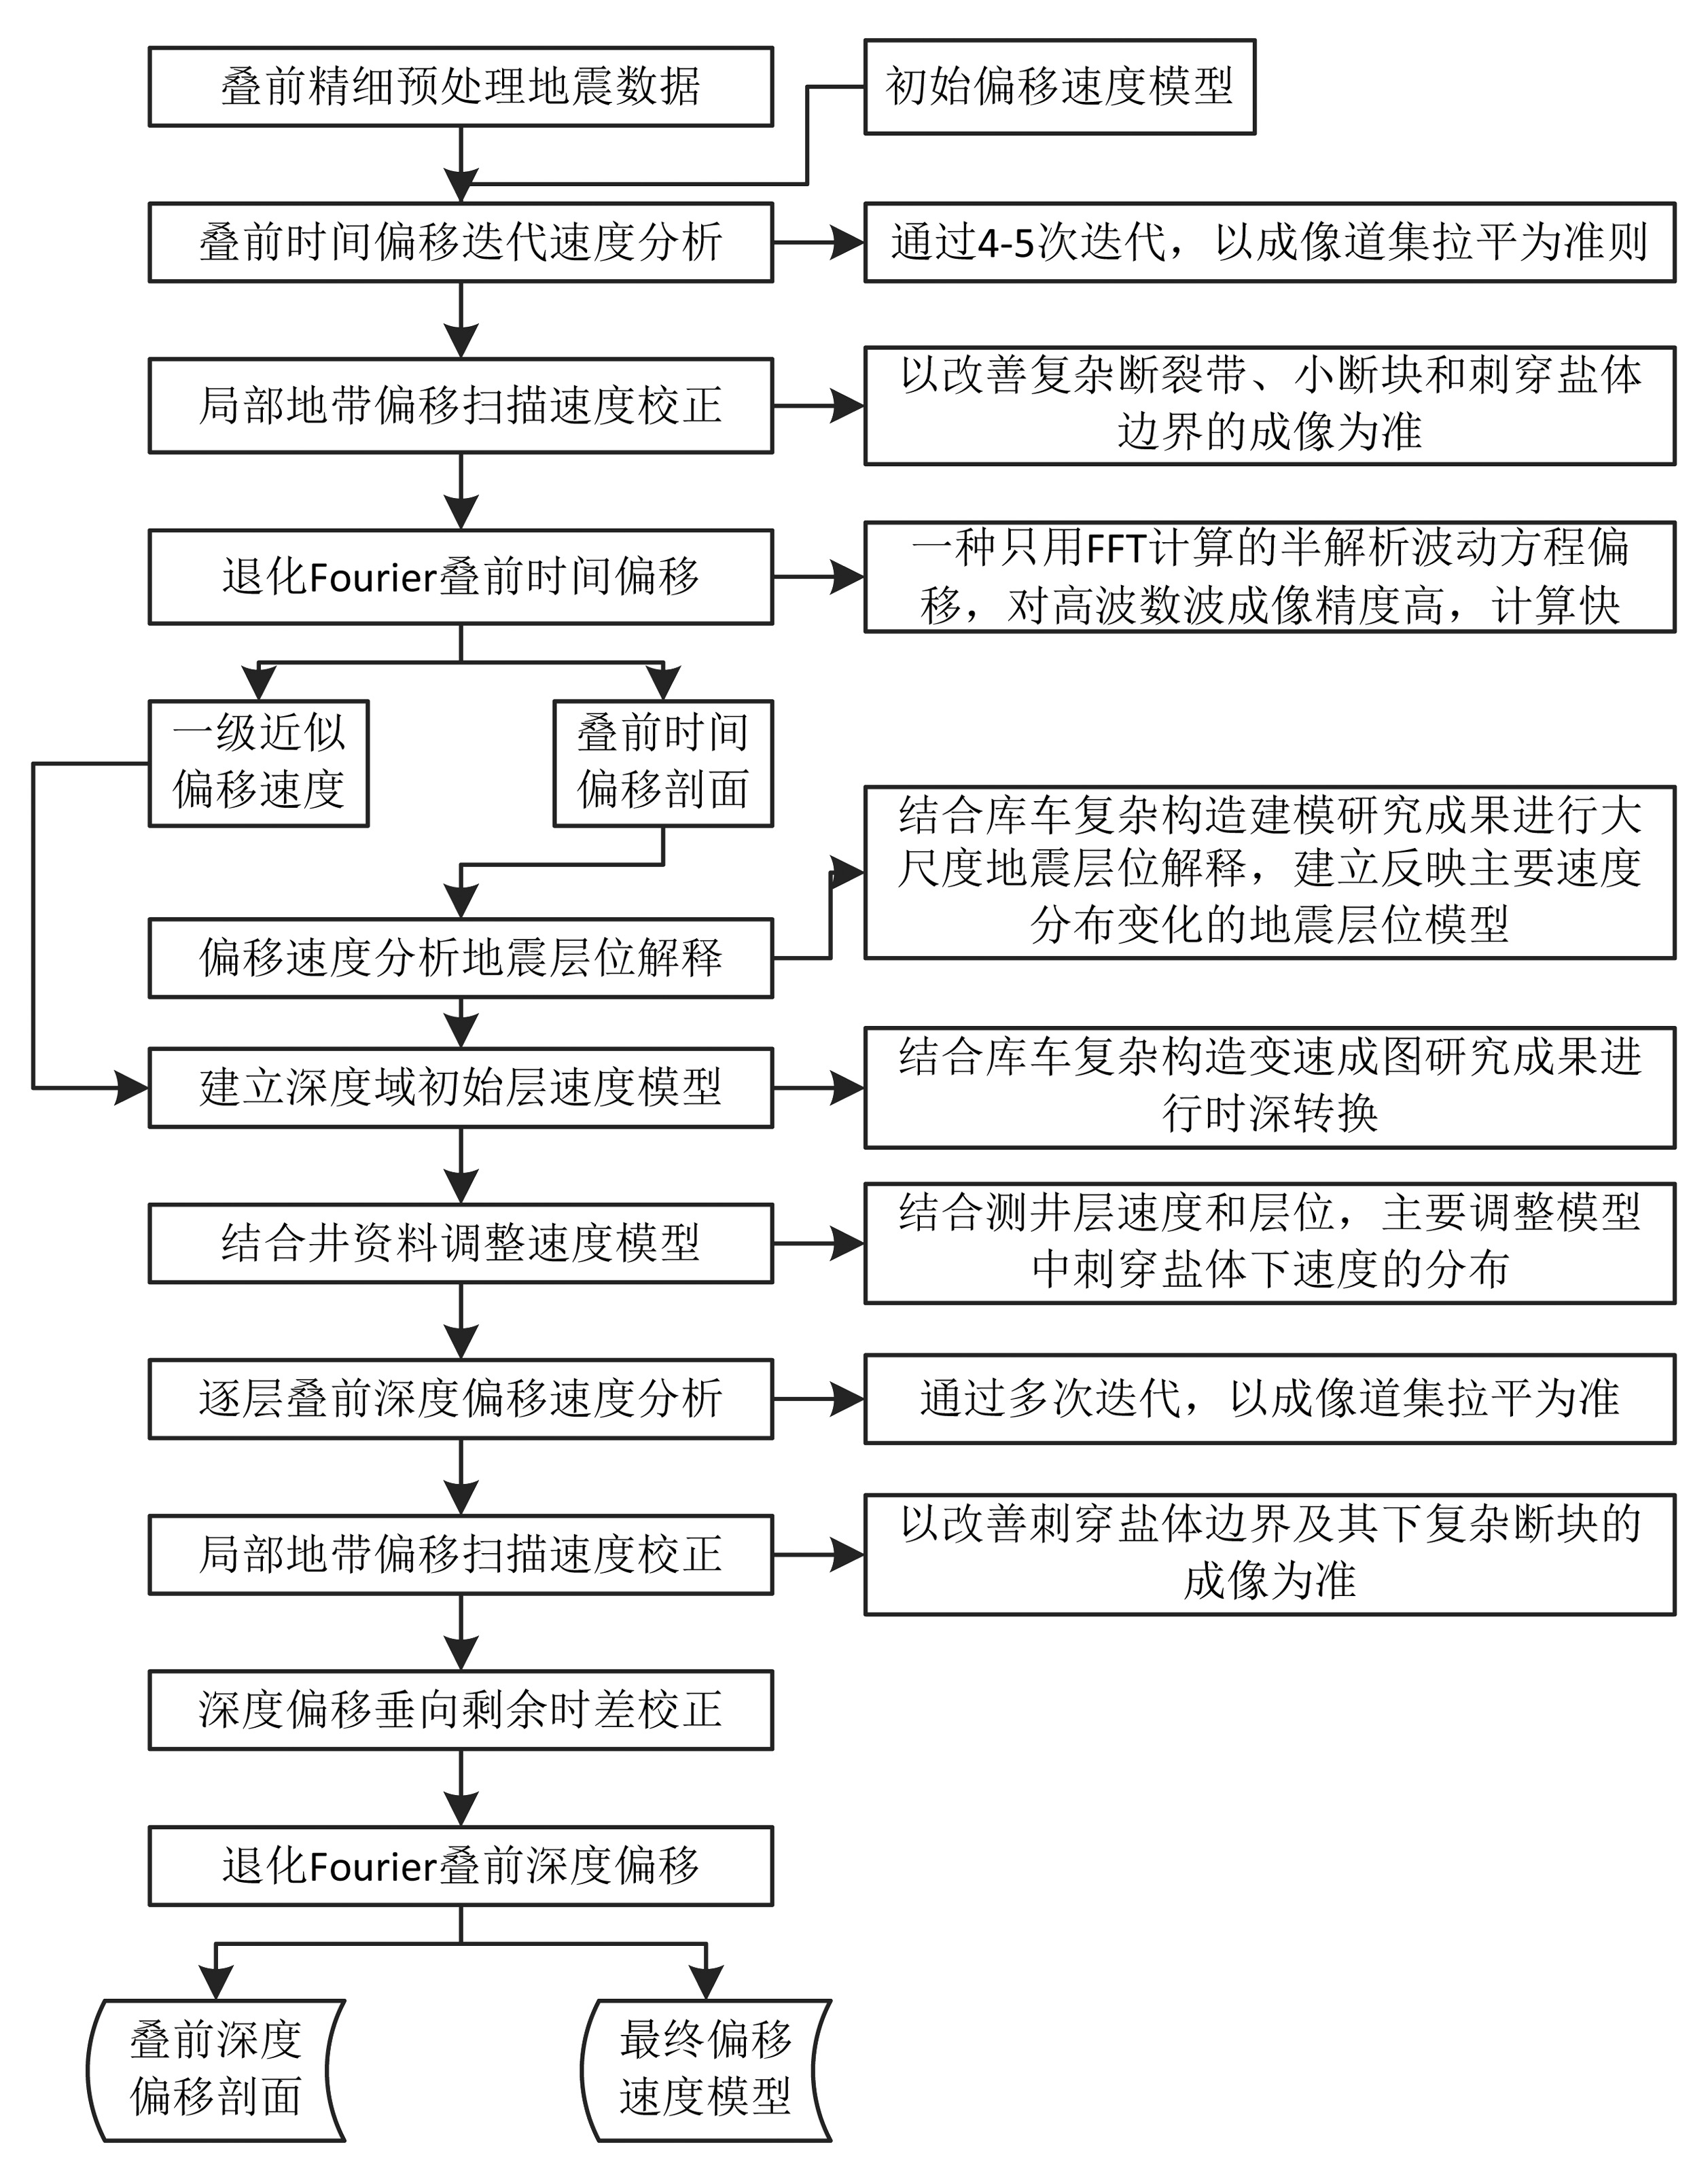
DEPRESSION The failures at many drill wells in Kuqa are attributed to inaccurate trap shapes and subsurface culminations from seismic surveys,which are associated with lacking reasonable velocity models. And how to construct such models in areas with complex geological structures has been a long-term difficulty in seismic exploration[16]. Velocity distribution contains information on subsurface structures,so velocity distortion must yield structural distortion on images. At present,we can only construct a relatively reasonable velocity model through multiple iterations based on various data such as seismology,geology,drilling,and logging. Based on the efforts of many years by the Tarim Oilfield Company,considering the complex structures including salt domes in thrust nappes, we summarized a process flow of migration velocity analysis (Fig.13).
|
Fig.13 Flowchart of migration velocity analysis and prestack imaging for the high and steep structures in Kuqa depression |
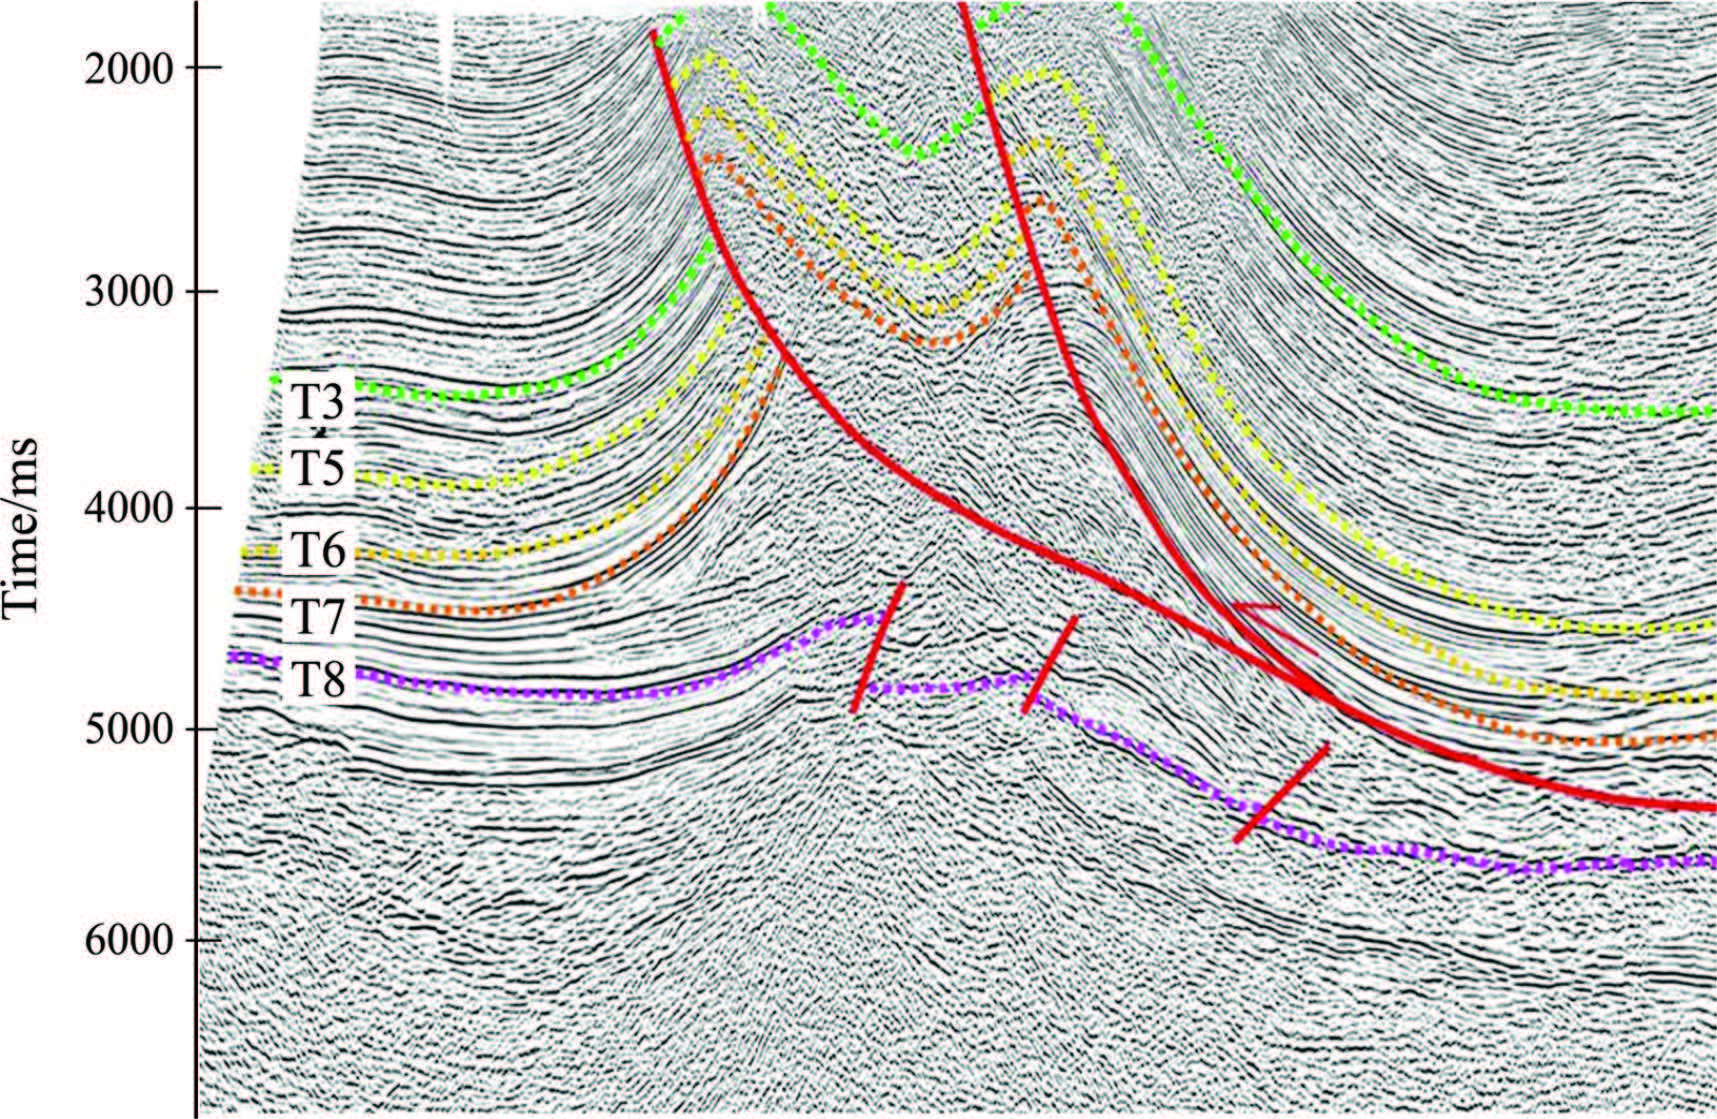
In this process,prestack time migration is a necessary transition. The major differences between prestack time migration and depth migration are concerned with imaging distortion in sub-salt structure caused by strong lateral velocity variation. The prestack time migration has two purposes: (1) Provide relatively accurate seismic imaging sections for depth migration velocity analysis which explains horizons. (2) Improve the initial migration velocity model from prestack preprocessing of seismic data,and obtain the first-order approximate migration velocity field. Fig.14 shows the prestack time migration section of the structure Xiqiu 10 at Kuqa from seismic imaging,which resulted from prestack data preprocessing,two-step velocity analysis (DMO and prestack time migration velocity analysis) and degenerate Fourier transform of wave equation. It displays abundant seismic reflections from below the salt gypsum,indicative of successful fine preprocessing to prestack gathers. The structure (e.g. T8) beneath the salt gypsum is distorted,which is proved by drilling wells in Kuqa. As time migration is not sensitive to velocity,velocity errors have small influence on image accuracy (time domain). The next task is to construct a initial layer-velocity model in the depth domain. Because it is sensitive to velocity, the velocities from shallow to deep must be accurate in the model. Tests on synthetic models demonstrate that small velocity errors can generate big distortion of deep imaging. The depth migration requires the velocity field keeps a good topology,i.e. well preserved relative variations in the velocity field.
|
Fig.14 Prestack time migration section for the Xiqiu 10 structure by subtle data preprocessing, two-stage migration velocity analyses and wave-equation degenerate Fourier seismic imaging |
Previous lessons tell us that construction of velocity models cannot rely on only seismic data. First, extremely near-surface conditions (large relief,uneven distribution of gravel,exposed old strata in thrust folds, etc.) make this modeling very difficult. Although prestack data preprocessing can reduce the effects of these adverse conditions,they can still pose great influence on S/N ratios below local places. Second,Penetrating salt bodies,thrust nappes and high-angle faults produce complicated variations of velocities. Third,The thicknesses of salt bodies are highly variable in lateral directions and faults below salt bodies are broken,thus seismic imaging of these structure is difficult. Finally,large burial depths of target layers and few exploration wells are also an important factor. By comprehensive applications of various data,the Tarim Oilfield Company has spent many years in studies of structural modeling for the Kuqa depression,providing a basis for depth migration velocity analysis.
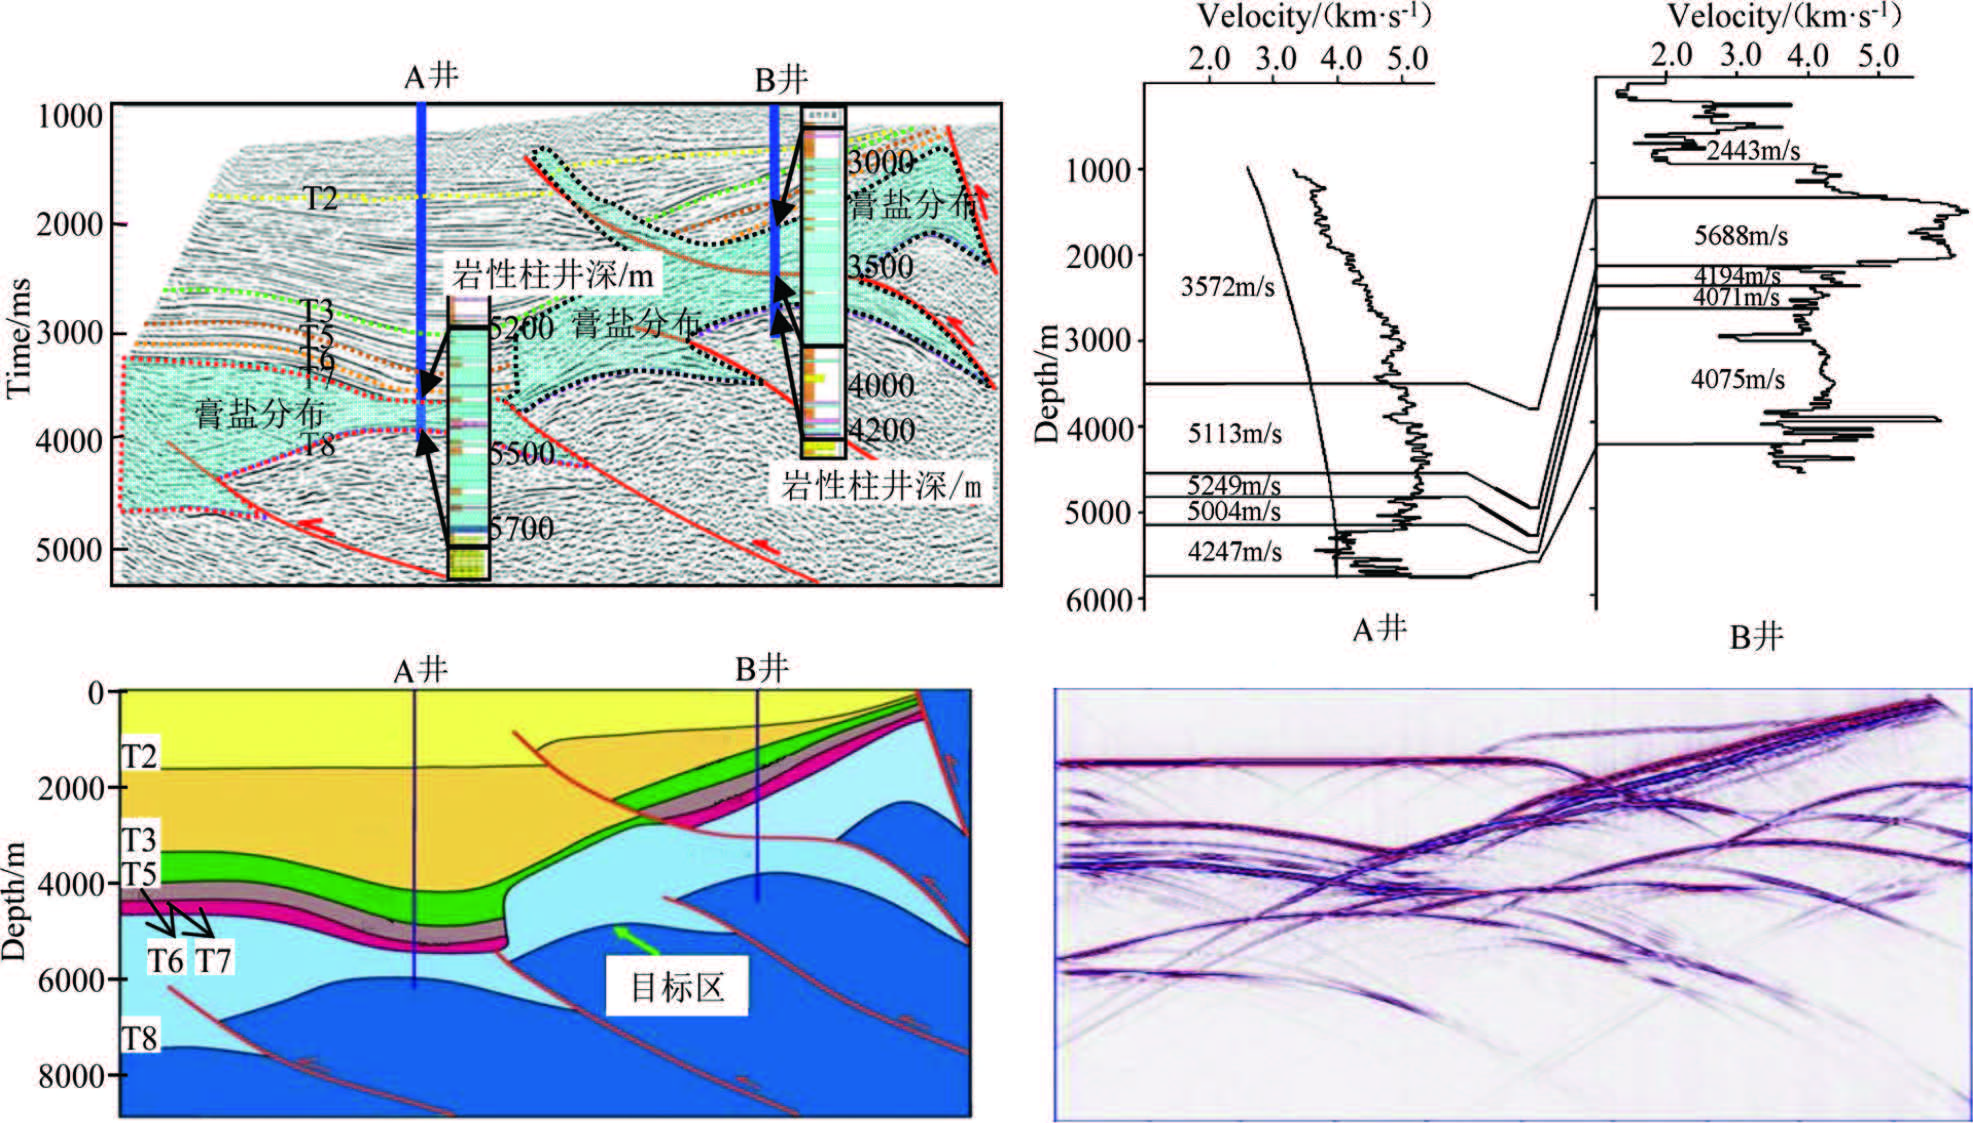
In this area,steep structures are largely related with penetrating salt bodies which have highly variable thicknesses. Seismic data around these salt bodies have low S/N ratios and serious distortion of presatck time migration. The salt sequence is composed of the Kumgeliem Formation and Suweiyi Formation of Eogene,and Jiedik Formation of Neogene,with thicknesses 100m to 3000 m. Salt layers serve as detachment during tectonic deformation. In a vertical column,the model includes the an overlying layer,salt layer,and sub-salt layer,which couple each other during deformation. Previous research of structural modeling for the Kuqa depression offers the following progresses. (1) Experiments show that salt accumulation is controlled by subsalt old topography, differential sediment loads,and thrust nappes in the orogenic belt,mostly at ramps or step-like positions. (2) The overlying layer suffers from small distortion,for which the velocity model can be established based on data of outcrops,stratum dips,drilling wells and logging. (3) By physical and numerical modeling,the influence of the salt layer on the sub-salt layer can be clarified to offer evidence for construction of the velocity model for the sub-salt structure. (4) Modeling for such salt-bearing structure and the establishment of velocity model can be performed based on the theories of folding,faulting,and overthrust wedge deformation,in combination with data of logging and seismic sequence (Fig.15).
|
Fig.15 A typical example of structure modeling by integrating well logging and seismic data. Seismic section with wellcontrolled structural interpretation (upper left panel) across the Dabei structure, strata velocities across wells A and B (upper right panel), and structural model (lower left panel) with its synthetic seismogram (lower right panel) |
To the first-order migration velocity field in Fig.13,we make time-depth transform using horizon control and variable velocities in space,resulting in the initial velocity model in the depth domain. This model is constrained by logging data through depths of marked layers as well as adjustment of layer velocity values from linking wells. As shown in Fig.15,another way is to use the filling linking-well layer velocities to construct the velocity model. How to combine these two ways remains unsolved at resent. Simple adding and averaging or artificial local adjustment cannot control velocity variations outside wells. An alternative approach is to make iterative inversion of low-frequency velocity with drilling-well constraints,using the prestack time migration velocity model as the initial values,and structural modeling as the large-scale horizon control[21, 22]. This method can control adaptive velocity variations outside wells during extrapolation,and realize optimal fusion of seismic and logging data,providing a relatively reasonable initial velocity model for subsequent prestack depth migration velocity analysis.
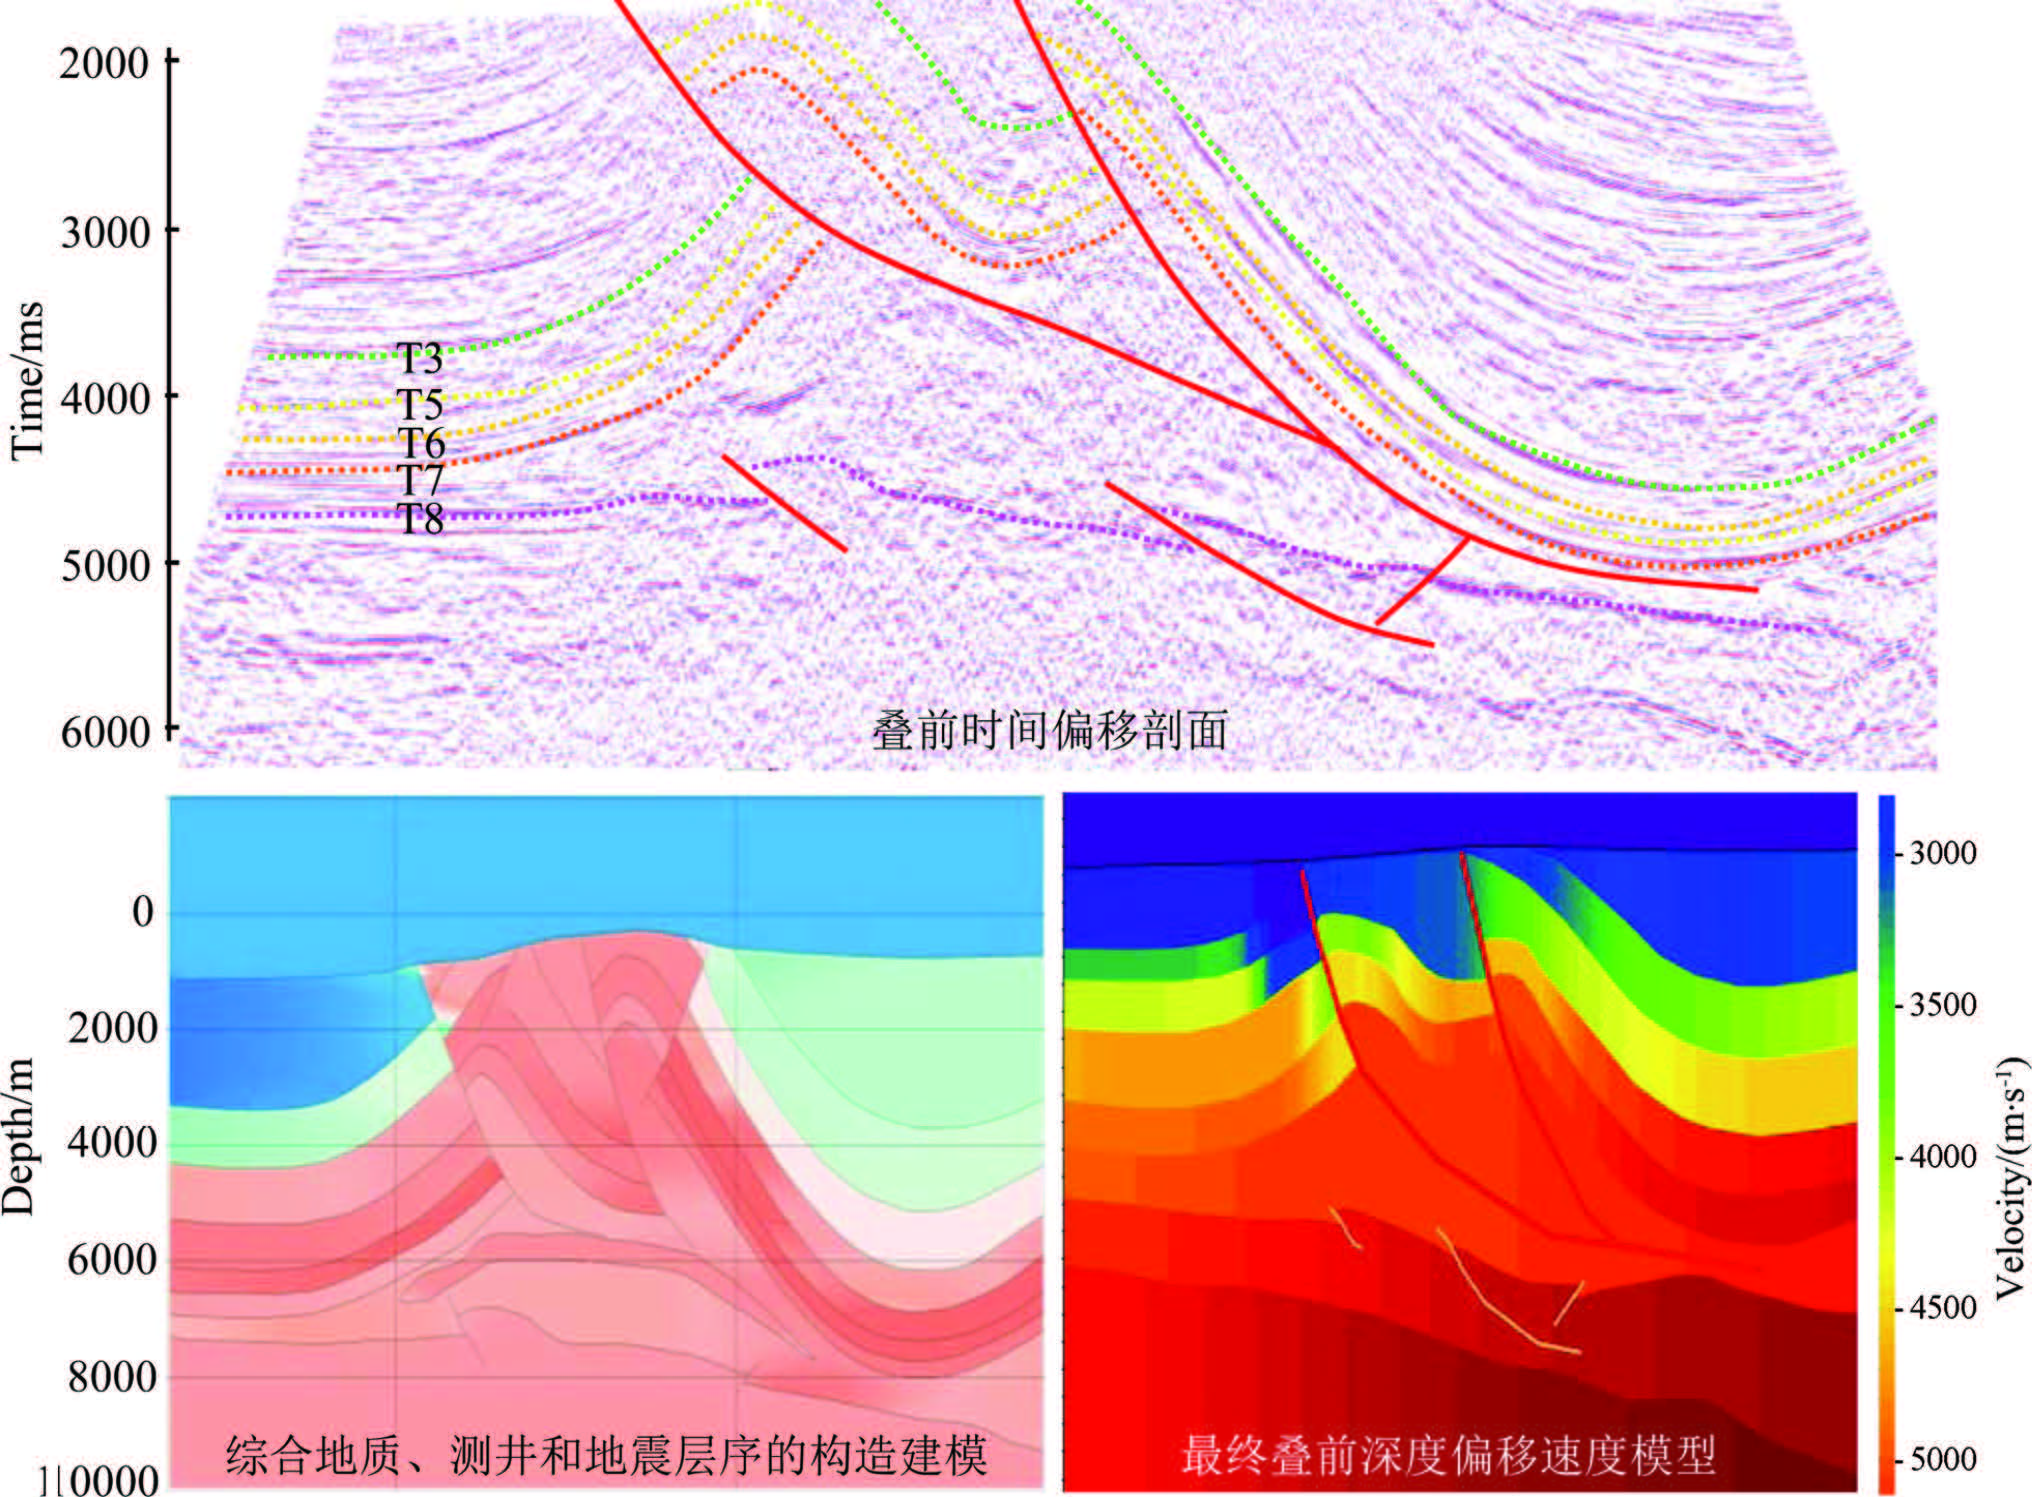
Figure16 shows an example of the Xiqiu structure in the Kuqa area,which indicates that the migration velocity model largely preserves the stratum structural features in the structural model,thus ensuring reliability
|
Fig.16 Prestack time migration section for the Xiqiu 4 structure (upper panel), structure modeling by integrating geological study, well logging and seismic data. (lower left panel) and the final depth migration velocity model (lower right panel) |
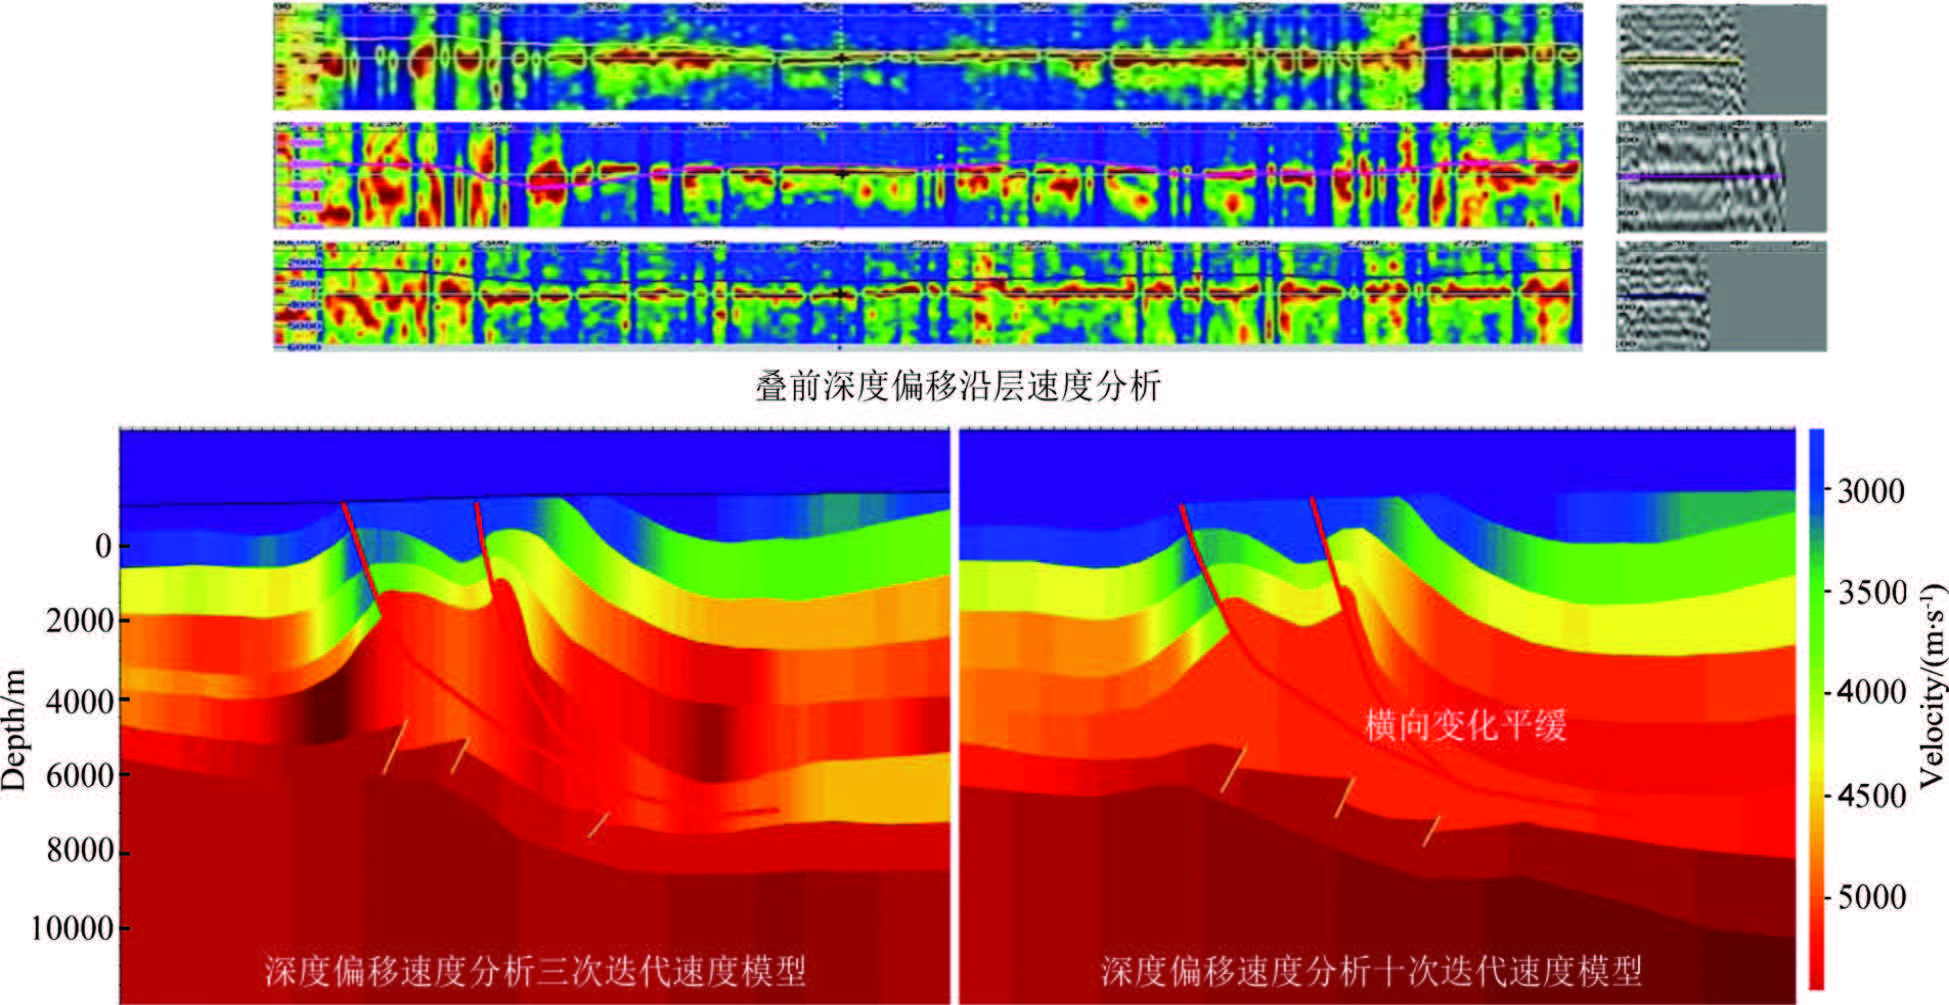
of prestack depth migration results. In Fig.13,the “prestack depth migration velocity analysis layer by layer” is based on leveling imaging gathers in the depth domain. Through many iterations,it modifies velocity disturbances superposed on the background velocity field,and realizes topology-preservation in the migration velocity field. At the structure Xiqiu 10 of Kuqa (Fig.17),prestack depth migration velocity analysis is made along layers (upper),yielding the model by third iteration (lower left),and tenth iteration (lower right),respectively. It demonstrates that the depth migration velocity analysis focuses on modifying disturbances superposed on the background velocity field to attain reasonable lateral variations of velocities.
|
Fig.17 Along-strata migration velocity analysis in the depth domain for the Xiqiu 10 structure (upper panel), the resulting velocity model (lower and left panel) after 3 iterations and the resulting velocity model (lower right panel) after 10 iterations |
PRESSION The wave equation prestack depth migration is an effective tool for imaging complex structures. Compared with the Kirchhoff and finite difference methods,this migration has some advantages such as simple algorithms, analytical continuation of wave fields,stable extrapolation of wave fields,without grid dispersion and split azimuth errors in the finite difference,and high efficiency of calculation in FFT for wave field continuation, which can greatly improve high-wavenumber imaging during seismic migration. Its chief drawback is that the conventional Fourier migration is applicable only to the cases of moderate lateral velocity variations or small-angle imaging,because the split-step extrapolation operator in this method is of whole or half domain approximation. One can improve imaging of large-scale waves in nonuniform media through multiple reference velocity migration[23, 24] or continuation segmental migration[25]. These algorithms preserve the advantage that only FFT is used for wave field continuation,but they need much more amounts of computation and storage. Fu and others suggested a degenerate Fourier migration operator which needs few FFT in wave field continuation and extends SSF migration to media of strong lateral velocity variations and large-angle waves[9, 10]. In this method,continuation is conduced by linear interpolation in the wavenumber domain between two spit steps, and continuation on each layer requires only once FFT more than the conventional SSF.
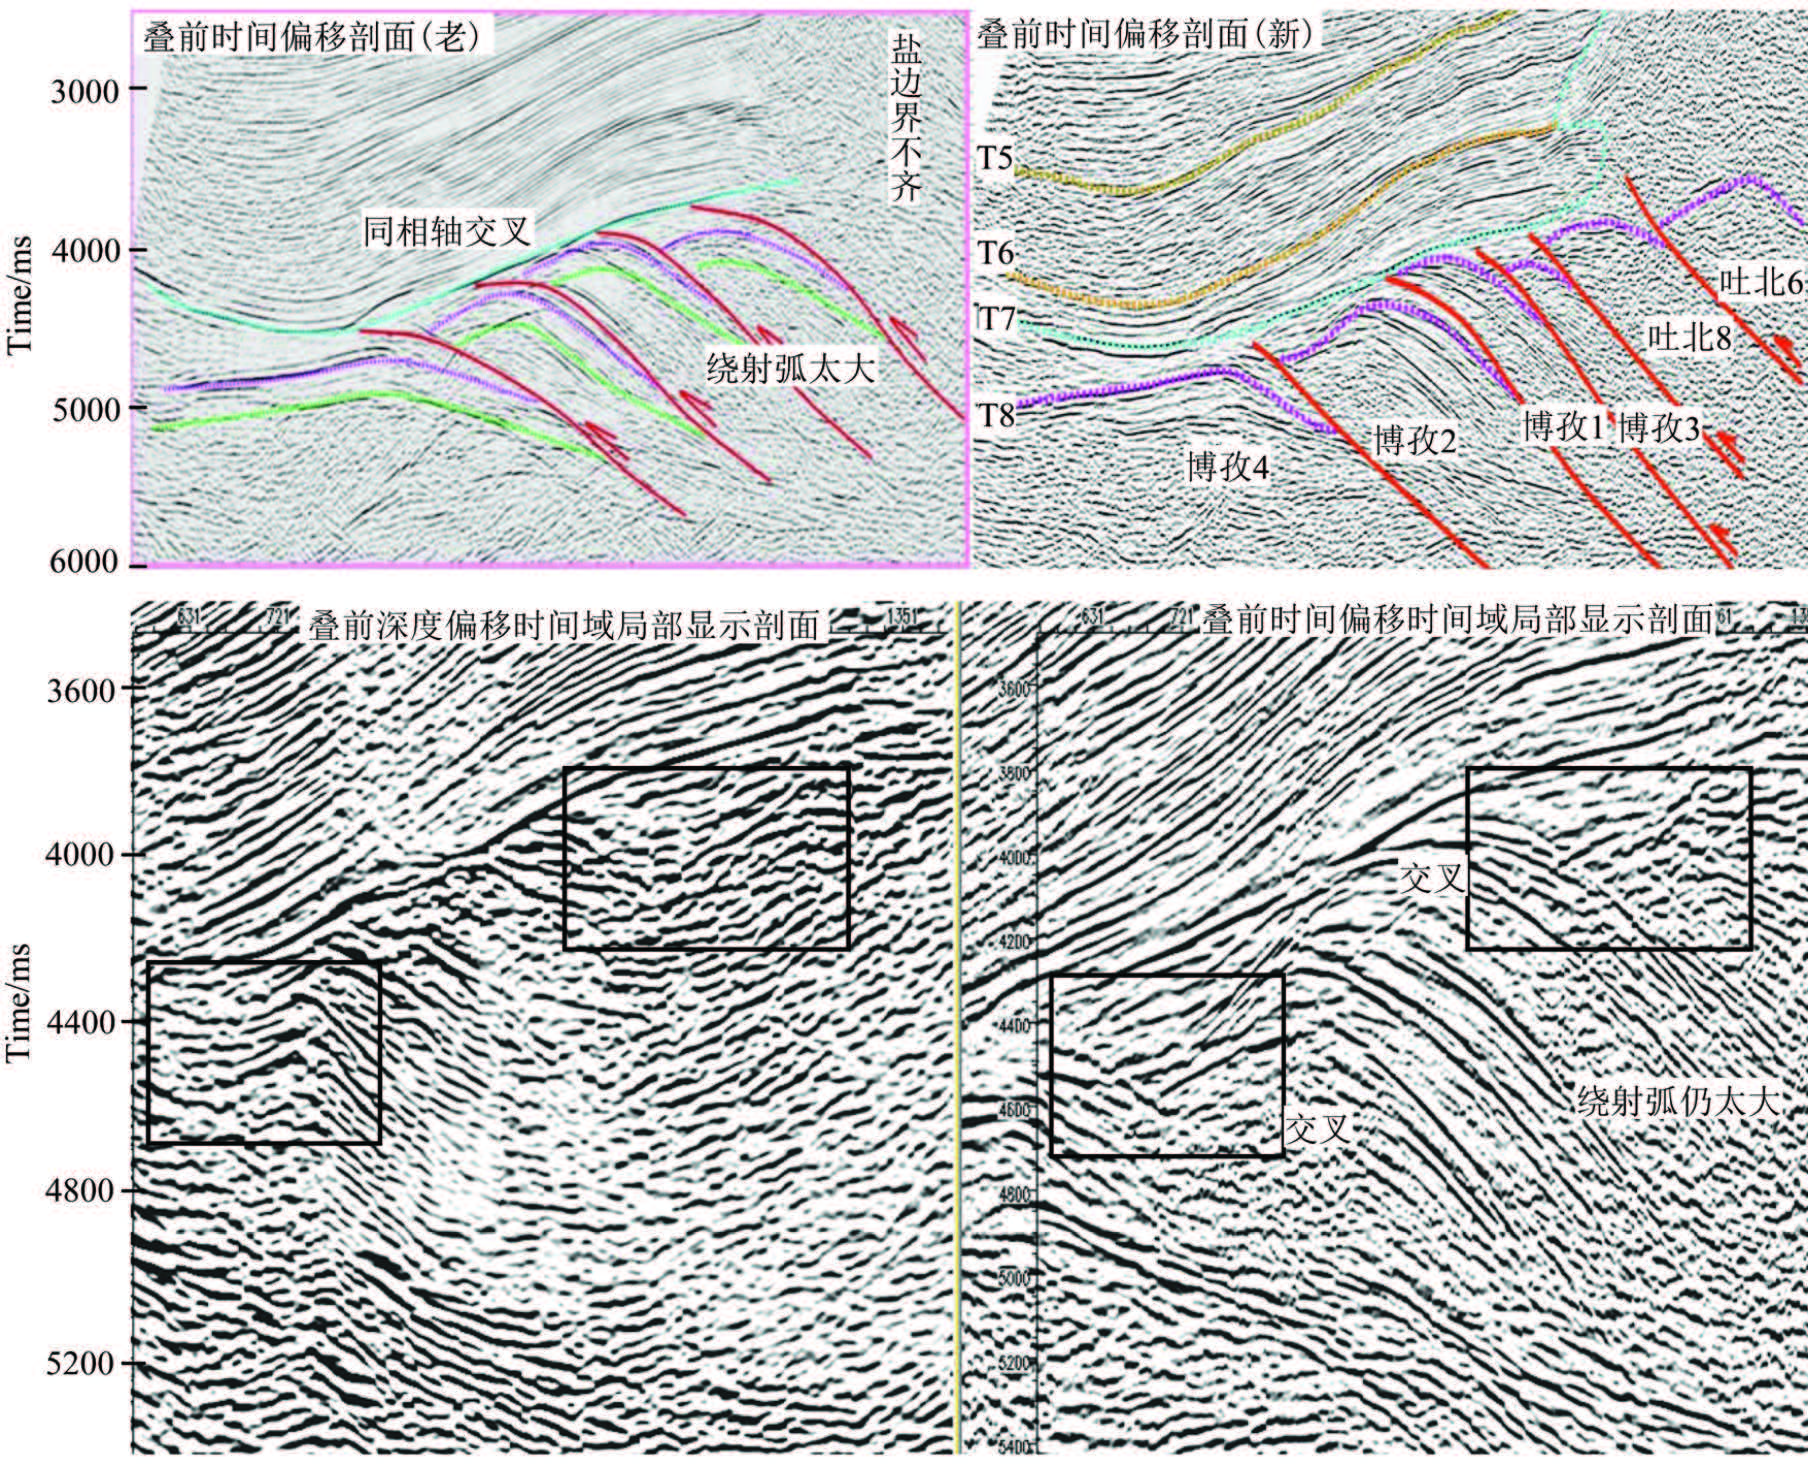
Through fine prestack data preprocessing and three-order migration velocity analysis,the quality of seismic data and accuracy of the migration velocity model have been greatly improved,which facilitate application of wave-equation prestack depth migration technology. Fig.18 compares sections of the structure Xiqiu 10 in Kuqa resulted from prestack depth and time migrations. On the time migration section,reflections from sub-salt T8 horizon are chaotic,cannot delineate small faulted blocks,and show local distortion of structural forms. While on the depth migration section,reflections from T8 are continuous,wave sets have visible features,diffracted waves from break points converge,small faulted blocks are easily identified,structural distortion is small,and lateral relief of horizons is clear. Similar contrasts are illustrated in Fig.19 for the structure Quele,in which the time migration profile shows diffracted waves related with small faulted blocks at the salt gypsum boundary and below salt do not converge and reflections of horizons are disordered; while such problems are not present on the depth migration profile. Fig.20 displays the case of the structure Bozi in Kuqa,in which the prestack time migration based on the ordinary Kirchoff processing is highly affected by the salt gypsum layer,with intersecting in-phase axes of sub-salt reflections,very large diffracted arcs,and unclear boundary reflections from the salt boundary; while the time migration based on the degenerate Fourier method suffers little from the salt gypsum layer,intersection of in-phase axes of sub-salt reflections is reduced,diffracted arcs converge further,and the salt gypsum boundary exhibits clear reflections. However,these problems are solved better on the prestack depth migration profile,which can delineate the real sub-salt structure (lower left in Fig.20).

|
Fig.18 Comparison of prestack depth (upper panel) and time (lower panel) migration sections (in part) for the Xiqiu 10 structure in the Kuqa depression |

|
Fig.19 Comparison of prestack depth (upper panel) and time (lower panel) migration sections for the Quele structure |
|
Fig.20 Comparison of conventional (upper left panel) and our (upper and right panel) prestack time migration sections for the Bozi structure, and comparison of prestack depth (lower and left panel) and time (lower right panel) migration sections (in part) for the Bozi structure |
The seismic imaging to complex steeping structures in the Kuqa depression requires to enhance S/N ratios of prestack seismic data and to reconstruct reflective signals from depth via data preprocessing. Conventional commercial denoising technology does not work well in this region. This study on prestack data preprocessing is conducted on three levels: (1) Deal with large-amplitude variations in original data,a series of methods are employed,including the amplitude-adaptive double domain short operator narrow-impedance band 2D filter to suppress near-offset surface waves with strong energy and distorted amplitude; the broad-band propagation operator based large-scale surface consistence processing to remove bad shot gathers and expansive abnormal interferences,and to balance energy variations of inter-shot records caused by exciting and receiving conditions. Perform long-wavelength static correction for large surface relief. (2) Handle medium-scale variations of amplitude and time lapse. The following procedures are used: wave-equation filtering to suppress semi-random and semi-coherent near-surface scattering,and to highlight weak signals from depth drowned in noise,mediumwavelength iterative static correction for near-surface velocity variations,serial deconvolution incorporating prediction deconvolution and surface-consistence deconvolution to enhance resolution. (3) Deal with small-scale variations of amplitude and time lapse. It includes treatments of surface consistence on wavelets,amplitude, and Q filtering,balancing small changes inter-shot and inter-gather records generated by exciting and receiving conditions,residual static correction and normal moveout correction,and amplitude-preserving suppressing random noise and frequency-division strengthening to raise S/N ratios of dominant bands.
The core of seismic imaging is migration velocity analysis. From the data of very low S/N ratios,the velocity models resulted from different methods or workers are highly variable,leading to large differences in migration results. This problem is extremely serious in the Kuqa area,where the geology is very complex as expressed by steep thrust nappes in the shallow subsurface,penetrating salt bodies with changeable shapes of tops and bottoms,complex sub-salt faults,and numerous faulted blocks. In this work,we establish the migration velocity model through three levels of analyses: DMO velocity,prestack time migration,and prestack depth migration. The key of this model establishment is time-depth conversion and fusing the linking-well velocity and depth-domain migration velocity fields. Previous on structural modeling and variable-velocity graphic technology for the Kuqa area provide important constraints for the velocity analysis in this work. It is based on gather leveling in the depth domain,modifies velocity disturbances superposed on the background field,and improves the topology-preservation structure of the migration velocity field.
In a nutshell,the seismic imaging to complex steep structures in the Kuqa depression comprises the following three steps: improve prestack data quality through preprocessing,establish the velocity model with topology-preservation by velocity analysis,and improve the degenerate Fourier migration operator for highwavenumber imaging. In comparison with the results by past commercial processing,the tests at structures Dabei,Bozi,Quele,Xiqiu 4 and Xiqiu 10 in the Kuqa area demonstrate that the methods presented in this paper are effective and successful,as evidenced by considerable enhancement of S/N ratios on most seismic survey lines,more reflection information from depth acquired,and more accurate subsurface structures delineated by imaging.
7 ACKNOWLEDGMENTSThis study was supported by the National Natural Science Foundation of China (41130418,40925013) and National Major Basic Research Program (973) (2006CB202306).
| [1] Yan S X, Liu H S, Yao X G. Mountain Geophysical Exploration Technology (in Chinese). Beijing:Petroleum Industry Press, 2001. |
| [2] Gou L. Studies on seismic exploration technology in the complex regions of western China[Ph. D. thesis] (in Chinese). Sichuan:Chengdu University of Technology, 2005. |
| [3] Wang X W, Gao J H, Liu W F, et al. Seismic Exploration Practice in Complex Regions (in Chinese). Beijing:Petroleum Industry Press, 2010. |
| [4] Lei G L, Zhang G W, Liu Z H. The growth formation of Kuqa foreland overthrust belt and its application in oil-gas exploration. Xinjiang Petroleum Geology (in Chinese), 2001, 22(2):107-110. |
| [5] He G Y, Lu H F, Li S X. Structure traps and petroleum exploration potentials of the qiulitage Structure belt in the Kuqa basin NW China. Chinese Journal of Geology (in Chinese), 2003, 38(4):506-510. |
| [6] Dong W, Fu L Y, Xiao Y J, et al. Quantitative analysis of the complexity in seismic exploration of the high and steep structures in Kuqa depression. Chinese J. Geophys.(in Chinese), 2011, 54(6):1600-1613. |
| [7] Fu L Y. Quantitative assessment of the complexity of geological structures in terms of seismic propagators. Sci. China Earth Sci., 2010, 53(1):54-63. |
| [8] Li Q Z. To the Way of the Accurate Exploration (in Chinese). Beijing:Petroleum Industry Press, 1993. |
| [9] Fu L Y. Comparison of different one-way propagators for wave forward propagation in heterogeneous crustal wave guides. Bull. Seismol. Soc. Am., 2006, 96(3):1091-1113. |
| [10] Fu L Y, Sun W J, Li D P. Degenerate migrators for imaging fault-related complex structures. Chinese J. Geophys.(in Chinese), 2007, 50(4):1241-1250. |
| [11] Stoffa P L, Fakkema J T, de Luna Freire R M, et al. Split-step Fourier migration. Geophysics, 1990, 54(4):410-421. |
| [12] Duan Y, Fu L Y, Liu D J. Local regular noise elimination using FKSUB model. Oil Geophysical Prospecting (in Chinese), 1996, 31(6):874-884. |
| [13] Lu H Y, Fu L Y, Jiang T. Wave-equation datuming based on fast Fourier transform. Progress in Geophysics (in Chinese), 2010, 25(4):1313-1322. |
| [14] Hu Z D, L X M, Wang J H. Studies on processing seismic data with low signal-to-noise ratio in Kuqa region. Oil Geophysical Prospecting (in Chinese), 2002, 37(1):108-117. |
| [15] Fu LY, Mu Y G. Boundary element method for elastic wave forward modeling. Chinese J. Geophys. (in Chinese), 1994, 37(4):521-529. |
| [16] He Z H, Wang C J, He Q D, et al. Reflection Seismic Data Migration Processing and Inversion Method (in Chinese). Chongqing:Chongqing University Press, 1989. |
| [17] Jia C Z. Tectonic Characteristics and Oil/Gas in Tarim Basin, China (in Chinese). Beijing:Petroleum Industry Press, 1997. |
| [18] Lu H F, Jia C Z. Kuqa-Keping Foreland Thrust Belt Structures (in Chinese). Beijing:Science Press, 2003. |
| [19] Tang L J, Lei G L. Studies on structure movements and model buildings in Quele-Xiqiu region (in Chinese). Petro China Tarim Oilfield Company and China University of Petroleum (Beijing), 2005(internal report). |
| [20] Wang H Q, Yang M H, Lü X X. Features of structural segmentation and accumunation of oil and gas in the Qiulitage structural belt, Kuqa fold- and-thrust belt. Chinese Journal of Geology (in Chinese), 2004, 39(4):523-531. |
| [21] Fu L Y. Joint inversions of seismic data for acoustic impedance. Geophysics, 2004, 69(4):994-1004. |
| [22] Wu M, Li W X, Fu L Y. Seismic inversions based on logging trace frequency-shared analysis. Oil Geophysical Prospecting (in Chinese), 2007, 42(1):65-71. |
| [23] Gazdag J, Sguazzero P. Migration of seismic data by phase shift plus interpolation. Geophysics, 1984, 49(2):124-131. |
| [24] Kessinger W. Extended split-step Fourier migration. 62nd Ann. Internat. Mtg., Soc. Expl. Geophys., Expanded Abstracts, 1992:917-920. |
| [25] Wu R S, Jin S. Windowed GSP (generalized screen propagators) migration applied to SEG-EAEG salt model data. 67th Ann. Internat. Mtg., Soc. Expl. Geophys., Expanded Abstracts, 1997:1746-1749. |
 2013, Vol. 56

