 2013, Vol. 56


2. CNPC Key Laboratory for Well Logging, China University of Petroleum, Qingdao 266555, China
The calculation of oil saturation in hydrocarbon reservoirs and the judgment of flooded level in flooded zones depend on the accurate acquisition of connate water resistivity which has always troubled the petrophysicists and log analysts to a great extent[1]. Spontaneous Potential (SP) logging is an important method which can provide the information of formation permeability as well as initial water resistivity in place. There are four resources contributing to the SP,including the diffusion potential,the membrane or Nernst potential,the electro-kinetic or streaming potential,and the oxidation/reduction potential,of which the latter two are relatively weak and can be ignored. Thus the SP in permeable formation is primarily the sum of the membrane and diffusion potentials which are mainly determined by the ratio of the mud filtrate to formation connate water salinity[2]. Since the membrane and diffusion potential are mainly generated in the interface of different fluids,it will be helpful to analyze and identify the radial distribution of the fluid salinity during the process of mud filtrate invasion.
Nowadays,array induction logging tools capable of providing signals with different probing depths and same resolution,are widely used in China’s oilfields,including array Induction Imaging logging tool (AIT) produced by Schlumberger,high resolution induction logging tool (HDIL) produced by Baker Hughes and high resolution array induction tool (HRAI) developed by Halliburton[3, 4, 5, 6, 7]. Based on the abundant information provided by array induction logging data,the proper formation model and reasonable algorithm,the formation resistivity distribution profile can be well reconstructed,meanwhile the generated position of the SP can also be determined. Thus,combined with SP logging data,formation water resistivity could be inverted effectively. In this work,through numerical simulation of mud invasion and analysis of SP generation position,a new “five-parameter” formation model is proposed. Then based on the joint inversion of array induction logging and SP,reconstruction of formation resistivity distribution profile and accurate calculation of the formation water resistivity are accomplished.
2 NUMERICAL SIMULATION OF MUD FILTRATE INVASION AND DETERMINATIONOF GENERATED POSITION OF SP
2.1 Numerical Simulation of Mud Filtrate InvasionThe process of mud filtrate invasion can be divided into two individual processes: the displacement of formation fluids by mud filtrate which results in the change of saturation in formation radial direction,and the diffusion of mud filtrate and formation water icon which contributes to the change of salinity of formation[8, 9]. Assume that mud filtrate and formation fluids in the displacement process are not miscible; reservoir rock and fluids are both slightly compressible; fluid transfusion complies with the law of Darcy. Then according to the B-L’s water oil displacement theory,the water-oil flow equation can be depicted as follows:
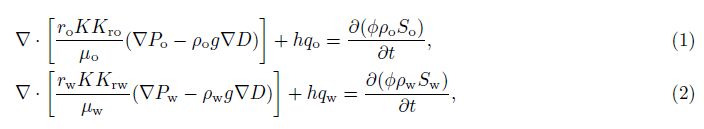
Then the diffusion equation can be written as

Numerical simulation of reservoir saturation,salinity,resistivity distribution during mud invasion process can be achieved with an appropriate formation model and finite difference method (FDM).
2.2 Determination of Generated Position of SPIn order to study the distribution characteristics of fluid and resistivity around the borehole during the mud invasion,typical oil layer,water layer and oil-water layer models were established. Reservoir saturation,salinity and resistivity profiles of different models were simulated (Fig.1). Model parameters are: formation porosity is 10%,permeability is 100 μm2,water salinity is 80000 mg/L,mud filtrate salinity is 44000 mg/L,residual hydrocarbon saturation is 20%,irreducible water saturation is 20%; Oil saturation: 75% in the oil layer,25% in water layer,and 50% in the oil-water layer.

|
Fig.1 Mud invasion characteristics of different reservoir types (a) Oil layer; (b) Water layer; (c) Oil-water layer. |
The following conclusions can be obtained from the distribution patterns of reservoir saturation,salinity,resistivity with different fluid types:
① The saturation and salinity vary monotonically in the radial direction during the mud filtrate invasion. The non-monotonic variation of radial resistivity is due to the speed difference of two effects;
②Saturation profile change is largely affected by original water saturation,as original water saturation increases,the displacement depth reduces gradually;
③Salinity change is less affected by original water saturation. Compared with the slowly changed saturation profiles,steep stepwise change appeared in salinity profiles;
④The SP is generated at the ladder of salinity mutation. In the resistivity profile,for the oil layer the position is at the rising part of the ladder; for the water layer lay is at the declining part of the ladder; and for the oil-water layer the position is at the declining part of “low resistivity annulus”.
3 “FIVE-PARAMETER” FORMATION MODELAccording to the resistivity distribution characteristic of mud filtrate invasion[10],the approximate resistivity distribution model around borehole is established as shown in Fig.2.

|
Fig.2 Schematic diagram of 5-parameter formation model |
The model is described by
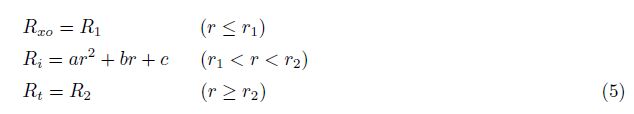
When the parabola coefficient a = 0,the new model degenerates into a “4-parameter model” in which the transition zone resistivity is assumed as a slope,and when r1≈ r2,the model degenerates into the “3-parameter model” in which the formation resis- tivity is described as a piston. Thus various patterns of resistivity distribution including the “low resistivity annulus” can be described by adjusting the parameters.
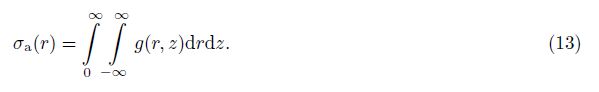
4 JOINT INVERSION OF ARRAY INDUCTION AND SPONTANEOUS POTENTIAL LOGGING During the calculation process of formation water resistivity,the joint inversion method in combination with physical parameters is adopted based on the data of array induction and SP logging. First,the resistivity profile is reconstructed and the generation position of SP is determined based on the “five parameters” formation model. Then,take the formation resistivity and the generation position of SP as known parameters,the formation water resistivity is inverted by using SP logging data in conjunction with mud filtrate resistivity. Generally,the inversion starts from non-permeable formation. By using the method of depth domain windowing,multi-layers above and under the target layer are inverted at the same time in order to eliminate the influence of surrounding rocks. The specific process is as follows.
Formation parameters (r1,r2,R1,R2,R1/2) determine the response of array induction logs in mud-invaded formation,which can be expressed by the following mathematical function

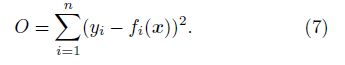
To minimize the objective function,the following equation is required
Solve the problem using regularization method with a regularization factor


|
Fig.3 Flowchart of array induction and spontaneous potential joint inversion |
Take the High Resolution Induction Logging tool (HDIL) from Baker Hughes for example,which can provide resistivity curves of three resolutions (M1-0.3 m,M2-0.6 m,M4-1.2 m) and six probing depths (R1-0.25 m,R2-0.5 m,R3-0.75 m,R6-1.5 m,R9-2.3 m,RX-3.0 m). Considering the signal processing of array induction signals and the overfocusing phenomenon of HDIL[11],the curve M2R1 (the resolution is 0.6 m,probing depth is 1.2 m) is abandoned,meanwhile the curves M1R2 (the resolution is 0.3 m,the probing depth is 0.5 m),and M4RX (the resolution is 1.2 m,the probing depth is 3.0 m),which are less processed,are adopted for inversion. Assuming that there are M layers in the depth window,inversion is based on the array induction logging response of N points N(N ≥ M),for which Jacobian matrix is expressed as
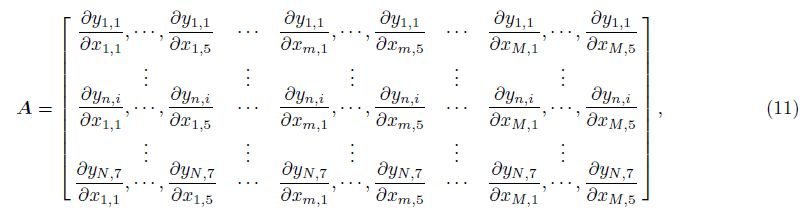

Consider
Thus there is
During the drilling process,due to the differences of drilling fluid and formation water salinity as well as the formation lithology,dipole layer generates on the surface of different salinity solution. From the principle of the SP logging,a dipole source of SP is distributed on the borehole and the boundaries between different formations (Fig.4).

|
Fig.4 Schematic diagram of spontaneous potential logging |
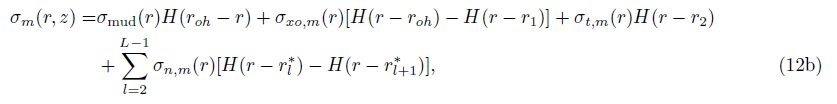
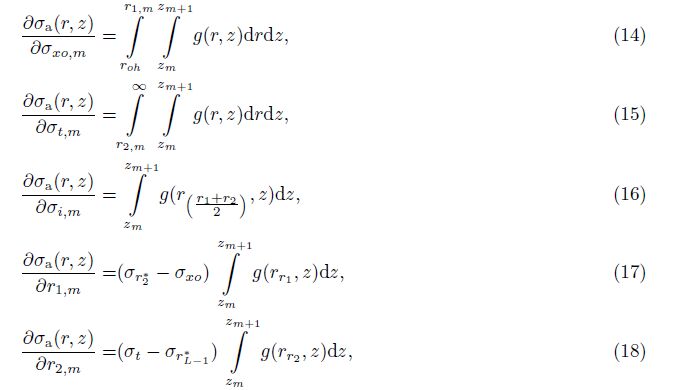
The numerical simulation of SP responses is adopted to calculate the Jacobian matrix in this paper. Assuming that the dipoles are distributed on the interface uniformly,the current potential can be used to implement the simulation of SP[12],and the electric field equation is
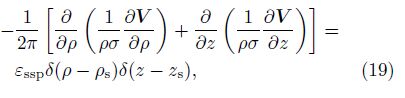
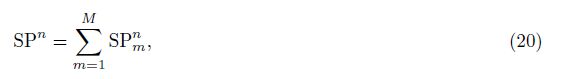
Define the functional

Eq.(21) could be solved quickly by using the finite element method to obtain SPn.
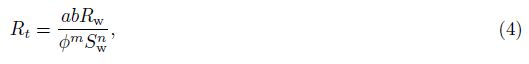
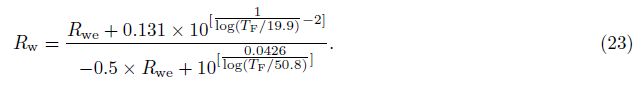
4.3 Formation Water Resistivity (Rw) AcquisitionFor pure sandstone formation,the formation water is mainly NaCl solution,the maximum formation spontaneous potential is determined by the ratio of the mud filtrate to formation water resistivity,which can be expressed as[13]

The inversion results of two sections from an oilfield in East China were selected and analyzed. The depth is 3880~3900 m (Fig.5),borehole diameter is 0.2 m,mud resistivity is 0.154 m. First,the activity layering method was adopted to implement the automatic zonation and characteristic value acquisition of the formation (in the third panel). The radial resistivity profile can be reconstructed based on the “five-parameters” model,which can reflect the radial variation of formation resistivity intuitively. The resistivity profiles of No.3 layer and 3897.38~3898.56 m of No.4 layer are shown in Fig.6,in which the SP generated positions are represented by the red lines. The inverted static spontaneous potentials (εssp) of No.2 layer and No.4 layer are both -44 mV indicating both the two layers have good property with the same connate water resistivity. The potential difference between No.2 layer (-34.1 mV) and No.4 layer (-43.3 mV) is due to the resistivity difference of the two layers. The inverted connate water salinity (64282 mg/L) agrees well with chemical analysis of formation water (64443.13 mg/L). The reconstructed SP curve and HDIL curves are displayed in the first and fifth panels,which show good agreement with measured curves which proves the inversion algorithm is stable and reliable.

|
Fig.5 Result of joint inversion of array induction and spontaneous potential logging in X well |

|
Fig.6 Comparison of the inverted invasion profile (the blue curve) and the measured resistivity from the HDIL (the scattered pink points) for layers No.3 and No.4 |
Meanwhile,the reconstruction of formation radial resistivity through inversion aided to the identification of formation fluid types. Asshown in Fig.5,though No.3 layer shows similar apparent resistivity as No.2 layer,its inverted resistivity profile exhibites a “low resistivity annulus” (R1/2 < Rt < Rxo) and its original formation resistivity is significantly lower than No.2 layer which indicates a typical oil-water characteristic,therefore is interpreted as an oil-water layer. The inversion results of No.2 layer present a typical oil layer with conductive invasion,while No.4 layer shows a typical resistive invasion characteristic which indicates a water layer. From the oil testing conclusions,No.2 layer is demonstrated to be an oil-bearing layer while No.4 layer is demonstrated to be a water layer,confirming the inversion results.
To further verify the correctness and applicability of the algorithm,18 sandstone layers in an oilfield with pure lithology were inverted with the proposed method. Part of the inversion results of water salinity and the chemical analysis results is compared in Table1. Connate water salinities in this area were obtained based on the joint inversion of HDIL and SP curves,and the results all show good agreement with the chemical analysis results. Inverted results show that the connate water salinity is 85000~120130212 mg/L in this area.
| Table 1 Comparison of water salinities of joint inversion and water analysis results |
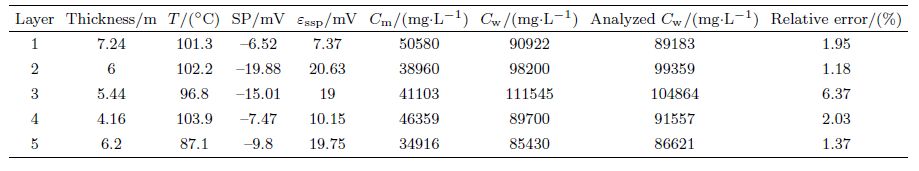
The joint inversion of HDIL and SP is a reliable method to estimate connate water resistivity,which ensures the accurate calculation of reservoir saturation. It provides a feasible method of formation evaluation,especially for the (natural) water flooded layers and zones lack of chemical analysis of formation water.
6 CONCLUSIONSThe non-monotonic variation of radial resistivity is due to the speed difference of displacement and diffusion effects during mud filtrate invasion. The SP is generated at the rising part of the ladder for the oil layer,the declining part of the ladder for the water layer lay,and the declining part of “low resistivity annulus” for the oil-water layer.
A variety of patterns of resistivity distribution including the “low resistivity annulus” can be described by the “five-parameter” model. The joint inversion of HDIL and SP can reconstruct the radial resistivity,identify the SP generated position,and calculate the connate water resistivity precisely,which can provide evidence for reservoir evaluation and fluid property identification.
The proposed joint inversion algorithm,which is stable and reliable,can provide a feasible method of formation evaluation for the (natural) water flooded layers and zones lack of chemical analysis of formation water. However,additional analysis is needed for the cases of the formation with high shale content or water with ion components other than those of NaCl. In addition,when the invasion depth is too large and exceeds the investigation depth of the array induction logs,the inversion results are open to doubt.
7 ACKNOWLEDGMENTSThe research was supported by the Project of National Natural Science Foundation of China (41174099),CNPC National Major Projects (2011ZX05020-008),and CNPC Science and Technology Development Projects (2011D 4101).
| [1] Zhang G J.Electrical Logging(in Chinese).Beijing:Petroleum Industry Press,1984. |
| [2] Pan K J,Tan Y J.High-efficient numeric simulation of spontaneous potential log in complex beds.Oil Geophysical Prospecting(in Chinese),2009,44(3):371-376. |
| [3] Strickland R W,Gulamabbas A M,Randal T B.High resolution array induction tool:US,6597993.2003-07-22. |
| [4] Sinclair P L.Multi-frequency array induction tool:US,6603312.2003-08-05. |
| [5] Barber T D,Rosthal R A.Using a Multiarray induction tool to achieve high-resolution logs with minimum environmental effects.//SPE 66th Annual Technical Conference and Exhibition,Dallas,Texas,USA,6-9 October 1991.http://www.onepetro.org/mslib/servlet/onepetropreview?id=00022725. |
| [6] Zhang Y R,Nie Z P,Qi L F.A nonlinear inversion approach to formation conductivity-Inversion of AIT measurements.Well Logging Technology(in Chinese),1997,21(5):305-309. |
| [7] Gao G Z,Torres-Verdin C.Fast inversion of borehole array induction data using an inner-outer loop optimization technique.//SPWLA 44th Annual Logging Symposium,Texas,USA,2003.http://www.onepetro.org/mslib/servlet/onepetropreview?id=SPWLA-2003-TT. |
| [8] Wu J H,Torres-Verdin C,Sepehrnoori K,et al.Numerical simulation of mud-filtrate invasion in deviated wells.SPE Reservoir Evaluation & Engineering,2004,7(2):143-154. |
| [9] Navarro D,Li S J,Liu R C,et al.Invasion effects on time-lapsed array induction logs.//SPWLA 48th Annual Logging Symposium,Austin,Texas,USA,2007.http://www.spwla.org/publications/view/item/3092. |
| [10] Deng S G,Sun Q T,Li H,et al.The sensitivity of the array resistivity log to mud filtrate invasion and its primary five-parameter inversion for improved oil water recognition.Petroleum Science,2012,9(3):295-302. |
| [11] Chew W C,Liu Q H.Inversion of induction tool measurements using the distorted Born iterative method and CG-FFHT.IEEE Transactions on Geoscience and Remote Sensing,1994,32(4):878-884. |
| [12] Zhang G J,Wang G L.Application of vector potential theory to spontaneous potential computation.Radio Science,1997,32(3):899-905. |
| [13] Pirson S J.Handbook of Well Log Analysis:for Oil and Gas Formation Evaluation.Englewood Cliffs:Prentice-Hall,1963. |
| [14] Schlumberger.Log Interpretation Charts.Houston:Schlumberger Educational Services,1991. |
| [15] Bigelow E L.Introduction to Wireline Log Analysis.Houston:Western Atlas International,1992. |