 2013, Vol. 56


Neutral wind in the middle and upper atmosphere, animportant area for satellite launch, plays a dominant role in the space environment. Not only is it an important parameter of studying the dynamic processes and energy transfer in the middle and upper atmosphere, but also has a great effect on the orbits of aerospace satellites. Therefore, neutral wind measurements make great contributions to the studying of dynamics, energetics and photochemical coupling of atmosphere for constructing atmospheric global scale models, and provide knowledge to ensure satellite safety and long-life operation.
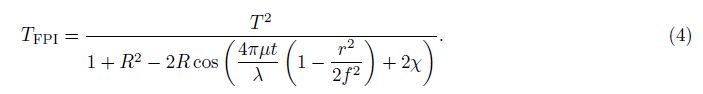
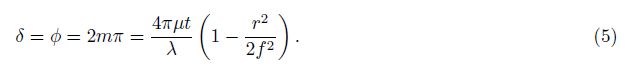
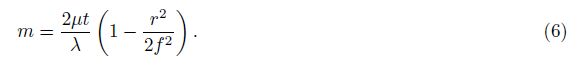
Currently, Doppler-shift measurements of atmospheric emission lines, such as airglow and aurora, have been used to measure atmospheric wind velocity and direction using ground-based and satellite instruments. Doppler wind measurements from satellites providing global scale coverage have been made using either Fabry-Perot interferometers or stepped Michelson interferometers. The former can measure windfield information based on the Fourier Transform of equal inclination interference formed by Fabry-Perotetalon. The latter, also known as stepped Fourier transform spectrometers (FTS), use a phase shift which can be determined by measuring four interferogram points to retrieve wind velocity. Compared to Stepped Michelson interferometer, Fabry-Perot interferometer has the advantages of higher sensitivity, higher spectral resolving power and simpler structure. Further advantage is that Fabry-Perot interferometers have no moving parts, which results in a higher stability, reliability and sensitivity[1].
To date, wind observations using Fabry-Perot interferometers from the ground have been made for several decades by many scientists[2, 3, 4, 5] while wind observations from the space dates from 1982, in which Fabry-Perot interferometeron board Dynamics Explorer 2 (DE-2)[6, 7, 8, 9] was launched. It obtained global measurements of the mesospheric and thermospheric wind in the altitude range 100~140 km using the 557.7 nm emission with an accuracy of ~10 m/s. Subsequently, the High Resolution Doppler Imager (HRDI)[10, 11, 12, 13] on board the Upper Atmospheric Research Satellite (UARS) was launched in 1991. It observed the emission and absorption lines of molecular oxygen airglow using low-, medium-, and high-resolution etalons for wind velocity, temperature, and volume emission rate retrieval for investigating the dynamics of the stratosphere (10~40 km), mesosphere and lower thermosphere (50~120 km). The goal of HRDI is to measure the vector winds with an accuracy of 5 m/s. The TIMED Doppler Interferometer (TIDI)[14, 15, 16] has been used for investigating the dynamics and energetics of the Earth’s mesosphere and lower-thermosphere (MLT) since 2001. It supplies vector wind field, temperature and minimum minor constituent of the atmosphere by observing airglow emission lines of 557.7 nm, 630.0 nm, and O2(0-0) with a vertical resolution of 2 km and accuracies that approach 3 m/s.
In China, wind measurements and studies of the middle and upper atmosphere both from the ground and space have been carried out in recent years. Yuan et al. made continuous measurements of wind velocity and temperature using the Fabry-Perot interferometer[17] and meteor radar[18, 19] at National Astronomical Observatories (Xinglong site). The retrieval results are in good agreement with Horizontal Wind Model of 1993 (HWM1993). Zhao et al.[20], Li et al.[21], and E et al.[22] studied the data process of wind retrieval using the method of determining complete interference fringe center proposed firstly by Kubota. Wang et al.[23] derived complete interference fringe center and radius to retrieve wind velocity using the circle fitting with least squares method. Han et al.[1, 24, 25] just studied the method of thinning incomplete interference fringes, but did not describe the method of determining the incomplete fringe center and radius.
To reduce costs of wind measurements, incomplete interference fringes, instead of complete circle, are becoming more common in application (e.g. TIDI). In this work, the center and radius of incomplete interference fringes were determined using the iterative method of Gaussian fitting and Taubincircle fitting. The methodology of wind retrieval is presented in Section 2. In Section 3, we describe the determination of center and radius of interference fringes. In Section 4, the retrieval results and analysis of wind retrieval are given and the conclusions are shown in the last section (Section 5).
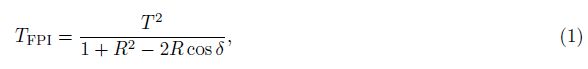
2 METHODOLOGYThe offsets of interference fringe peaksformed by FPI from the Doppler shift of the airglow emissions are determined to obtain the wind velocity. After the airglow lights pass through the front optics, they are converted into nearly parallel lights and then undergo multiple reflections in FPI etalon, and finally are focused onto CCD by a focusing device, which forms a group of concentric interference circles.
The transmission function of FPI etalon is


Two forms of interferograms imaged on FPI CCD are complete interference fringes (Fig.1) and incomplete interference fringes (Fig.2, fan-shaped in this paper). The center of the former form can be determined by an iterative method based on symmetry coordinates of fringe peaks with the center as symmetry point in horizontal and vertical directions alternately[5, 27]. Then each fringe peak corresponding to radius in the sliced image data is obtained after annular summing by Gaussian function fitting with a nonlinear least-square method[28, 29]. The center of the latter form can be determined by the perpendicular bisectors of uniformly-spaced sampling points atinterference fringe peaks, which, however, is with high randomness of point choice and low precision of point position. Therefore, the method is only applied to the thinning fringes.

|
Fig.1 FPI complete interference fringes |

|
Fig.2 FPI incomplete interference fringes (fan-shaped) |
In this paper, a method of center and radius determination of the incomplete interference fringes for wind retrieval is proposed. The procedures for data processing are as follows:
(1) Data pre-processing. The noise of the data must be reduced for the center and radius determination using mean filter and wiener weighting adaptive filter.
(2) The center and radius determination of interference fringes. Coordinates of fringe peaksare derived from Gaussian fitting based on the firstly guessed fringe center. Then, new center and radius of fringes are calculated using circle fitting proposed by Taubin[30].
(3) The final center and radius are determined by using iterative method using Gaussian fitting and circle fitting alternately.
3.1 Data Pre-ProcessingInterferograms of airglow formed on CCD are easy to be influenced and contaminated by noise for its low intensity. Besides cosmic rays, the noise, performing as a singular value or sudden change, comes from stray lights, including light leak of instruments and disturbance of environments. It directly affects the precision of center and radius determination. Therefore, data pre-processing must be carried out before wind retrieval including mean filtering[31] and wiener weighting adaptive filtering[32]. The intensity distributions of FPI interference fringes without pre-processing and after pre-processing are shown in Fig.3 and Fig.4, respectively. The former distribution is contaminated seriously by the noise, while the latter exhibits the interference intensity distribution well.

|
Fig.3 Interference intensity distribution of FPI before pre-processing |

|
Fig.4 Interference intensity distribution of FPI after pre-processing |
Procedures for determination of interference fringe center and radius are as follows:
(1) The coordinate (Cx, Cy) of the center is estimated firstly by manual operation.
(2) Interference fringes are sliced by several lines with equal angle-interval (Fig.5).

|
Fig.5 Cross sections of FPI interference fringes |
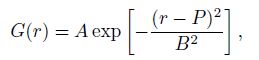
(3) Fringe peaks in the sliced image data are fitted by Gaussian function with a nonlinear least-square method[4, 33, 34, 35]. Gaussian function is given
(4) New center and radius of fringes are calculated using Taubincircle fitting based on the peak coordinates derived in step 3.
(5) The new center coordinates are compared with the original or previous one. If one of the x-axis and y-axis offsets is greater than 0.5 pixels, the procedure goes back to step 2. If both of them are less than 0.5 pixels, the iterative procedure is stopped and the final center and radius of fringes are obtained.
4 ANALOG SIMULATION OF FPI AND RESULTS ANALYSIS OF WIND RETRIEVALThe FPI system was simulated by ZEMAX using non-sequence mode. The simulation parameters are given in Table1.
| Table 1 FPI constants and parameters used in the simulation |
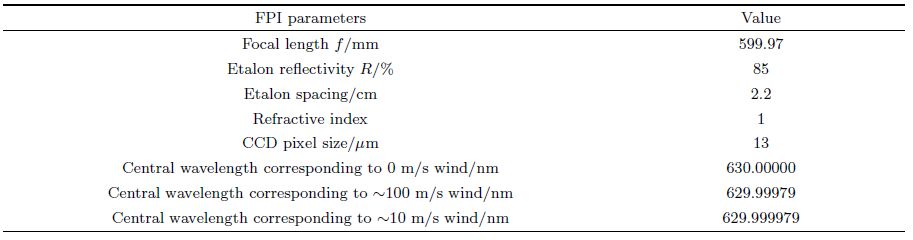
In the simulation, the size of CCD is 13.3 mm×13.3 mm with 1024×1024, and pixel size is 13 μm×13 μm, which is used commonly in space instruments. Because of wide existence and stronger intensity in F layer of ionosphere, 630.0 nm airglow is in wide spread use to retrieve wind of the upper atmosphere. Therefore, 630.0nm was chosen as a central wavelength (λ0) corresponding to 0 m/s. the intensity distribution of 630.0 nm airglow simulation after data pre-processing is shown in Fig.6. Since the common wind of the middle and upper atmosphere has a velocity from several scores of meters per second to hundreds of meters per second, the central wavelength of 629.99979 corresponding to ~100 m/s wind was chosen for simulation (Fig.7). For the purpose of validation of retrieving low wind velocity, the central wavelength of 629.999979 corresponding to ~10 m/s wind was also simulated (Fig.8).

|
Fig.6 Circle fitting and interference intensity distribution at λ=630.0 nm |

|
Fig.7 Circle fitting and interference intensity distribution at λ=629.99979 nm |

|
Fig.8 Circle fitting and interference intensity distribution at λ=629.999979 nm |
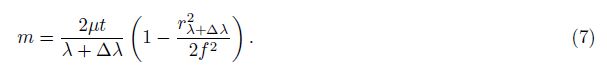
The simulation data of 630.0 nm was processed using the method described in Section 3. The center coordinate of 630.0 nm airglow ZEMAX simulation (λ0=630.0 nm) is (413.3283, 408.5913), and the radius (r) is 1.6579 mm filled with 127.5308 pixels shown in Fig.6 (red curve). The center coordinate of 629.99979 nm (λ1=629.99979 nm) is (413.3571, 409.3311), and the radius (rλ+△λ1) is 1.7267 mm filled with 132.8231 pixels shown in Fig.7. The center coordinate of 629.999979 nm (λ1=629.999979 nm) is (411.9925, 412.0979), and the radius (rλ+△λ2) is 1.6633 mm filled with 127.9429 pixels shown in Fig.8. Then, two pairs of wavelengths (λ0 and λ1, λ0 and λ2) are substituted in Eq. 1 $\frac{1}{{\lambda + \Delta \lambda }}{\text{ = }}\frac{1}{\lambda }\left( {1 + \frac{v}{c}} \right)$ to derive theoretical wind velocity, while another two pairs of radius (r and rλ+△λ1, r and rλ+△λ2) are substituted in Eq.(8) to obtain retrieval wind velocity. The results are compared in Table2.
| Table 2 Validation of retrieval results |
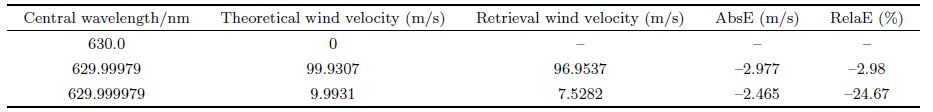
The absolute errors (AbsE) of retrieval results are both less than 3 m/s, which meet he requirement of 5 m/s wind retrieval error of the middle and upper atmosphere. The relative errors of retrieval results are -2.98% (row 2 in Table2) and -24.67% (row 3 in Table2), which demonstrate a higher retrieval precision for high wind velocity, but a relative lower retrieval precision for low wind velocity. That may be due to CCD pixel size. According to Eq.(8) and Table1, an error of 1 μm radius determination can lead to 2.34 m/s deviation of wind velocity. Therefore, the pixel size 13 μm is not small enough for low wind retrieval. Therefore, sub-pixel technology will be taken into account in further studies.
5 CONCLUSIONSIn this paper, a new method of determination of center and radius of interference fringes is proposed. The method combines the intensity distribution (Gaussian fitting) and the spatial distribution (Circle fitting) of fringes, which can improve the precision of wind retrieval. After denoising processing of the fringe intensity including mean filtering and adaptive filtering, cross sections are taken for the interference fringes and fringe peak coordinates are acquired according to the Gauss distribution of the intensity. Then, new center coordinates and radius are estimated by using circle fitting with the least square method. Finally, center coordinate and radius can be determined through the iterative operation. The new method was applied to Fabry-Perot interferometer data processing for wind velocity calculation of the middle and upper atmosphere. The errors of the calculation were less than 3 m/s, which demonstrated preliminarily that the method was suitable for the wind retrieval. However, for the purpose of higher retrieval precision of low wind velocity, sub-pixel of CCD image will be taken into account in the future work.
ACKNOWLEDGMENTSThis work was supported by the National Natural Science Foundation of China (41005013).
| [1] Han W H,Wang Y M,Lü J G,et al.Auto-processing of middle and upper atmosphere wind FPI interference fringe pattern.Science Technology and Engineering(in Chinese),2010,10(10):2420-2423. |
| [2] Ground-based Fabry-Perot interferometry of the terrestrial nightglow with a bare charge-coupled device:remote field site deployment.Optical Engineering,1994,33(2):457-465. |
| [3] Wu Q,Gablehouse R D,Solomon S C,et al.A New Fabry-Perot Interferometer for Upper Atmosphere Research.Proc.of SPIE.5660,218-227.doi:10.1117/12.573084. |
| [4] Shiokawa K,Kadota T,Ejiri M K,et al.Three-channel imaging Fabry-Perot interferometer for measurement of mid-latitude airglow.Applied Optics,2001,40(24):4286-4296. |
| [5] Shiokawa K,Kadota T,Otsuka Y,et al.A two-channel Fabry-Perot interferometer with thermoelectric-cooled CCD detectors for neutral wind measurement in the upper atmosphere.Earth Planets Space,2003,55:271-275. |
| [6] LKillen T,Kennedy B C,Hays P B,et al.Image plane detector for the dynamics explorer Fabry-Perot interferometer.Appl.Opt.,1983,22(22):3503-3513. |
| [7] Killeen T L,Hays P B.Doppler line profile analysis for a multichannel Fabry-Perot interferometer.Appl.Opt.,1984,23(4):612-620. |
| [8] Hays P B,Killeen T L,Kennedy B C.The Fabry-Perot.interferometer on dynamics explorer.Space Sci.Instrum.,1981,5:395-416. |
| [9] Rees D,Fuller-Rowell T J,lyons A,et al.Stable and rugged etalon for the dynamics explorer Fabry-Perot interferometer.1:Design and construction.Applied Optics,1982,21(21):3896-3902. |
| [10] Skinner W R,Hays P B,Abreu V J.High resolution Doppler imager.Ann Arbor:International Geoscience and Remote sensing Symposium,1987:673-676. |
| [11] Abreu V J,Hays P B,Skinner W R.The high resolution Doppler imager.Opt.Photon.News,1991,2(10):28-30. |
| [12] Hays P B,Abreu V J,Dobbs M E,et al.The high-resolution Doppler imager on the upper atmosphere research satellite.Journal of Geophysical Research,1993,98(D6):10713-10723. |
| [13] AOrtland D,Skinner W R,Hays P B,et al.Measurements of stratospheric winds by the high resolution Doppler imager.Journal of Geophysical Research,1996,101(D6):10351-10363. |
| [14] Killen T L,Skinnerm W R,Johnson R M,et al.TIMED Doppler interferometer(TIDI).SPIE,1999,3756:289-301. |
| [15] Skinner W R,Niciejewski R J,Killen T L,et al.Operational performance of the TIMED Doppler interferometer(TIDI).SPIE,2003,5157:47-57. |
| [16] Killeen T L,Wu Q,Solomon S C,et al.TIMED Doppler Interferometer:Overview and recent results.J.Geophys.Res.,2006,111:A10S01,doi:10.1029/2005JA011484. |
| [17] Yuan W,Xu J Y,Ma R P,et al.First observation of mesospheric and thermospheric winds by a Fabry-Perot interferometer in China.Chinese Science Bulletin,2010,55(35):4046-4051. |
| [18] Jiang G Y,Xu J Y,Yuan W,et al.A comparison of mesospheric winds measured by FPI and meteor radar located at 40N.Sci.China Tech.Sci.,2012,55(5):1245-1250,doi:10.1007/s11431-012-4773-1. |
| [19] Jiang G Y,Xu J Y,Shi J K,et al.The first observation of the atmospheric tides in the mesosphere and lower thermosphere over Hainan,China.Chinese Science Bulletin,2010,55(11):1059-1066. |
| [20] Zhao Z Q,Zhou X S,Ai Y.Wind-velocity detection in upper atmosphere with scanning Fabry-Perot interferometer.Journal of Applied Optics(in Chinese),2006,27(6):558-562. |
| [21] Li H,Zhang Y G.Simulation and analysis of thermospheric wind velocity.Journal of Applied Optics(in Chinese),2009,30(2):285-290. |
| [22] E F,Gao Q Y,Ai Y.A new method of processing the Fabry-Perot interference fringes.Optical Technique(in Chinese),2009,35(4):499-501. |
| [23] Wang L,Zhou Y,Hua D X,et al.Theoretical research and simulation of the atmospheric wind field and temperature based on the Fabry-Perot interferometer.Acta Optica Sinica(in Chinese),2011,31(10):1001001-1-1001001-6. |
| [24] Han W H,Lü J G,Wang Y M,et al.Image data processing of Spaceborne Fabry-Perot interferometer prototype.Chin.J.Space Sci.(in Chinese),2011,31(6):784-788. |
| [25] Wang Y M,Fu L P,Du S S,et al.Development for detecting upper atmospheric wind and temperature from satellite.Chin.J.Space Sci.(in Chinese),2009,29(1):1-5. |
| [26] Wilksch P A.Instrument function of the Fabry-Perot spectrometer.Appl.Opt.,1985,24(10):1502-1511. |
| [27] Kubota M.A study on middle-scale variations of thermospheric neutral winds associated with auroral activity over Syowa station,Antarctica.Japan:Tohoku University,1996. |
| [28] Dyson P L,Davies T P,Parkinson M L,et al.Thermospheric neutral winds at southern mid-latitudes:A comparison of optical and ionosonde hmF2 methods.J.Geophys.Res.,1997,102(27):189-196. |
| [29] Biondi M A,Sazykin S Y,Fejer B G,et al.Equatorial and low latitude thermospheric winds:measured quiet time variations with season and solar flux from 1980 to 1990.J.Geophys.Res.,1999,104(A8):17091-17106. |
| [30] Gabriel Taubin.Estimation of Planar curves,surfaces,and nonplanar space curves defined by implicit equations with applications to edge and range image segmentation.IEEE Transactions on Pattern Analysis and Machine Intelligence,1991,13(11). |
| [31] Lim J S.Two-Dimensional Signal and Image Processing.Englewood Cliffs:Prentice Hall,1990:469-476. |
| [32] Lim J S.Two-Dimensional Signal and Image Processing.Englewood Cliffs:NJ,Prentice Hall,1990:548. |
| [33] Shepherd G G,Guit W A,Miller D W,et al.WAMDⅡ,wide-angle Michelson Doppler imaging interferometer for space lab.Appl.Opt.,1985,24(11):1571-1583. |
| [34] Hays P B.Circle to line interferometer optical system.Appl.Opt.,1990,29(10):1482-1489. |
| [35] Killeen T L,Roble R G.Thermosphere dynamics:Contributions from the first 5 years of the Dynamics Explorer program.Rev.Geophys.,1988,26(2):329-367. |