2 青岛海洋科学与技术试点国家实验室, 海洋生态与环境科学功能实验室, 山东 青岛 266237)
北极是对全球气候变化响应和反馈最敏感的区域之一,近几十年来全球变暖以及CO2等温室气体浓度持续升高,其作为“极地放大”效应,气候发生了快速变化[1~2]。最直接的响应是海冰覆盖面积的不断减少,这进一步影响了海洋与大气之间的物质和热量交换、全球温盐环流、北极航道的开通利用和交通安全[3~4]。海冰是北极及地球系统的重要的组成部分,海冰覆盖减少了海洋与大气之间的热通量,通过其高反照率,对整个北极地区的气候有很大影响。海洋对太阳辐射的反照率大约0.10,而海冰的反照率为0.6~0.8[1, 5]。因此,与海洋表面相比,海冰表面对太阳辐射的反射是海洋的6~8倍,可维持极地区域的低温环境。另外,海冰变化会影响北大西洋深水形成而影响全球温盐环流,通过东格陵兰流输出的海冰增多将会降低格陵兰海的表层水盐度,从而减缓了北大西洋深水形成并减弱了全球温盐环流[6~8]。海冰也是极地海洋生态系统的重要构成部分[3]。
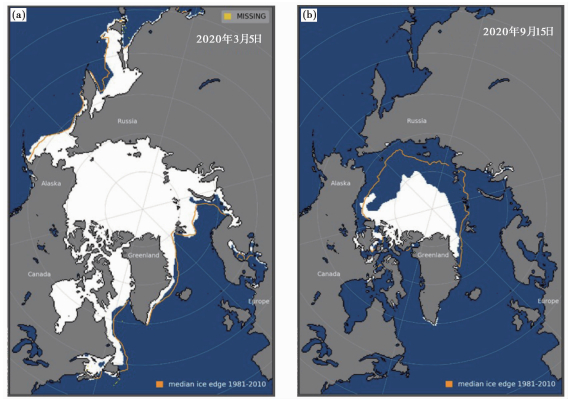
海冰的年际和季节变化是北冰洋区域的一个重要特征[3](图 1)。在冬季,北冰洋中央和绝大部分陆架边缘海完全被海冰覆盖;而在夏季,北冰洋陆架大部分区域无冰。巴伦支海受温暖的挪威/西斯匹次卑尔根洋流系统(北大西洋暖流支流)的影响,大部分海域常年无冰。北冰洋海冰通常有两种主要形式,季节性海冰(或第一年冰)和常年冰(或多年冰)。季节性海冰的厚度在冬季可达到2.5m[2~3];若季节性海冰在夏季未融化则变成多年冰。目前,北冰洋多年海冰的厚度约为3m[2~3]。此外,北冰洋陆架边缘海沿岸有陆缘固定冰(landfast ice),附着于海岸和陆架,每年固定时间可长达10个月[3]。自1978年以来,海冰密集度(单位面积的海冰面积百分比)以及覆盖范围(面积)可以通过卫星观测获得[9~10]。卫星数据显示,北冰洋海冰面积3月份最大(平均约14×106~15×106km2),4月份开始减少,到9月最小(平均约5×10⁶~7×10⁶km2)。在夏季,大部分第一年冰融化[9~12](图 1)。多年冰的面积目前约5×10⁶~7×10⁶km2,大部分集中在波弗特环流影响下的加拿大海盆和加拿大陆架,而在过去几十年其覆盖面积和厚度明显下降[13~14]。
|
图 1 北冰洋2020年3月份(海冰覆盖最大月份)和9月份(海冰覆盖最小月份)海冰覆盖情况橙色线为1981~2010年平均海冰边界(https://nsidc.org/data/seaice_index/) Fig. 1 Arctic sea ice extent in March(sea ice maximum)and September(sea ice minimum)2020. The orange lines mark the average sea ice extents during 1981~2010(https://nsidc.org/data/seaice_index/) |
近40年北极海冰面积以3.5~4.1 % /10a的速度退缩(NSIDC,数据来源与网址:https://nsidc.org/),模式预测结果显示2050年北冰洋夏季海冰可能完全消失[15~16]。海冰覆盖面积减小与全球变暖相关,但是驱动因素是自然变化规律还是人类活动的影响尚不明确,目前海冰的卫星观测只有四十多年的历史,因此需要构建长时间尺度的海冰记录,厘清其演变规律。历史暖期的气候情况对解释和预测21世纪的气候变化有重要的参考意义,可为模式的预测提供可靠的数据信息。古海洋和古气候的地质记录表明,历史上确实存在海冰覆盖程度低于现代的时期[17~19],例如,北冰洋在5000万年前没有海冰覆盖,表层水温在10℃以上,海洋生产力极高,沉积物中有机质的含量也很高[17]。而在早全新世暖期(Holocene Thermal Maximum,10~8ka),气候温暖,海冰消融,但由于海平面较低限制富营养的太平洋水进入北冰洋,因此海洋生产力相较逐渐变冷的中全新世和晚全新世较低[18]。距现代较近的中世纪暖期(Medieval Warm Period,800~1300A.D.),在北极圈边缘的冰岛陆架区海水表层温度上升,海冰减少[19],与欧亚大陆气候变化一致[20]。明确历史暖期北极海冰的覆盖程度,可以更清楚地了解现代海冰的变化机制并对预测未来变化趋势提供依据。
海冰的变化会影响海冰/海洋初级生产力以及物质在海洋中的运输,这些变化信号会保存在海洋沉积物中,记录海冰的历史演变[21]。传统的用于指示古海冰变化的指标包括冰筏碎屑(Ice-Rafted Detritus,简称IRD)、有孔虫、硅藻、地球化学指标等[22~25],以及2007年提出的有机分子海冰指标IP25(Ice Proxy with 25 carbon atoms)[26]。近年来,海洋、海冰和气候模式的发展,为海冰历史演变的研究提供了机理的证据支撑,在古海洋和古气候中的应用愈来愈重要。
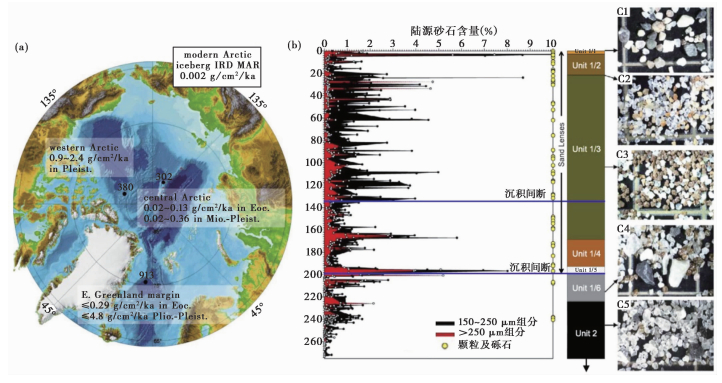
1 海冰指标和地质记录用于重建古海冰的传统指标有冰筏碎屑(IRD)、微体生物化石及其同位素等。海冰或冰盖在形成过程中会有陆源粗组分附着其中,在海冰/冰山(冰盖前缘断裂)漂流过程中会携带这些来自陆源的冰碛物。当冰山/海冰会融化时,这些陆源组分物质会释放到水体中最终沉降到海底,保存在海洋沉积物中并记录冰盖或海冰的扩张和消退[27]。通常,冰山搬运的IRD有较高含量的砂级组分(63μm),而海冰搬运的主要为粘土和粉砂级(63μm),从粒级上可以进行一定程度的区分[28]。前人研究通过分析北冰洋IODP302航次Arctic Coring Expedition(ACEX)位于罗蒙诺索夫脊钻孔(0~273m)中不同组分IRD含量以及颗粒结构,获得了全新世至中始新世(Holocene-Middle Eocene)的记录(图 2),研究结果表明北冰洋海冰大约形成于46Ma,从中始新世开始出现海冰的消长过程,这是北冰洋古海冰研究的重要发现[29]。IODP302钻孔IRD中碎屑铁氧化物矿物颗粒(detrital Fe oxide mineral grains)的沉积记录进一步显示,北冰洋的多年海冰出现于大约14Ma,因为漂流速率说明这些碎屑铁氧化物矿物颗粒经过一年以上漂流才沉积于ACEX钻孔位置[30]。海冰和冰山搬运的IRD虽然在粒径上有所区别,但搬运物质有粒级上的重合,有时候会比较难以确定IRD来源于冰山还是海冰[31~32]。海冰和冰盖变化的驱动机制及对气候的反馈有所不同,海冰的变化可直接影响海洋与大气之间的交换,而冰盖的变化会影响海平面[33~34]。
|
图 2 北冰洋IODP302航次ACEX钻孔中不同组分IRD含量以及颗粒结构(修改自John[29]) ( a)IODP302航次ACEX钻孔的站位;(b)IRD不同组分的含量和颗粒结构(C1、C2、C3、C4和C5) Fig. 2 The grain texture and composition of IRD in Arctic IODP302 ACEX core(modified from John[29]).(a)Station of IODP302 ACEX core; (b)Contents and the grain texture (C1, C2, C3, C4 and C5) of different composition of IRD |
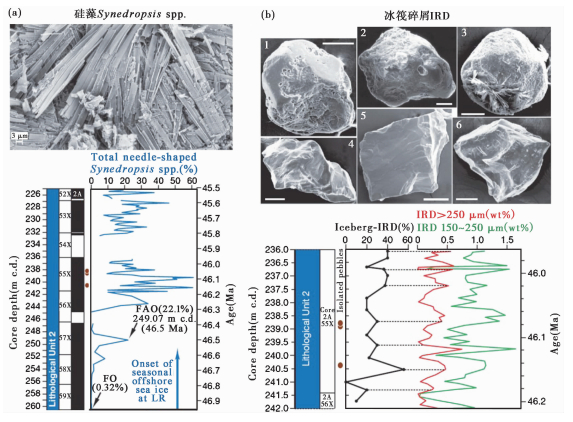
与陆源输入的IRD相比,沉积物中的微体生物化石主要来源于上层水体中微体植物和微体动物的沉降。北冰洋微体生物的生长与水温、光照和营养盐等因素相关,这些因素都受到海冰覆盖的影响[3],其中,光照是北冰洋微体生物生长的限制因素。海冰变化会通过改变阳光的透射率影响海水表层温度,从而影响浮游植物的生长。在多年冰覆盖海域,由于缺少光照,微体生物的丰度极低,一般为冷水种属;而在季节性海冰覆盖海域,微体生物会出现亚极地种属,与多年冰区域有明显差异[35~36]。硅藻是浮游植物的一种,某些种属对低温耐受性较强,可以附着在海冰底部,称为海冰硅藻[37]。在ACEX钻孔IRD记录的基础上,研究者们进一步结合海冰硅藻Synedropsis spp.的变化(图 3),获得了海冰出现的更为准确的时间,北冰洋陆架边缘海海冰形成于大约47.5Ma,北冰洋中心大约47Ma出现季节性海冰[32]。另外一种保存在沉积物中的微体浮游植物生物化石甲藻孢囊(dinoflagellate cyst)是甲藻的有机质外壳,北冰洋及亚北极区域沉积岩芯的dinocyst记录综合研究表明,在第四纪北冰洋中心的多年冰有偶尔开放情况,并非永久覆盖[38]。
|
图 3 北冰洋IODP302航次ACEX钻孔中海冰硅藻和IRD的记录(修改自Stickley等[32]) (a)海冰硅藻及沉积记录;(b)IRD及沉积记录 Fig. 3 Records of sea-ice diatom and IRD in Arctic IODP302 ACEX core(modified from Stickley et al.[32]). (a)Image and records of sea-ice diatoms; (b)Image and records of IRD |
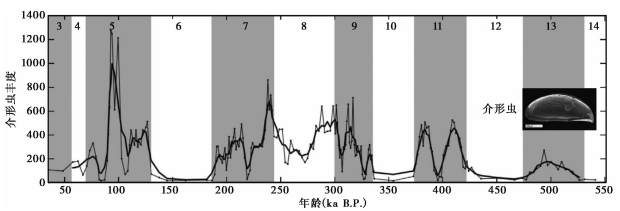
北冰洋沉积物中的微体动物化石也是指示海冰变化的常用指标[39~41]。西北冰洋门捷列夫脊的海冰介形虫Acetabulastoma arcticum沉积记录(图 4)显示,西北冰洋在氧同位素11期之后海洋环境发生了转变,出现永久性海冰,海冰的变化周期遵循2万年的岁差周期[39]。除介形虫的沉积记录外,西北冰洋第四纪的底栖有孔虫丰度、种类以及组成的记录显示,早更新世至晚更新世海冰逐渐扩张,季节性海冰向永久冰演化,中更新世气候转型时期(Mid-Pleistocene Transition,简称MPT)海冰突然扩张;在深海氧同位素7期(MIS7)之后,研究区域被永久海冰覆盖[40~41]。另外,沉积物中浮游有孔虫的稳定同位素δ18O和δ13 C作为地球化学指标,分别指示北冰洋淡水输入和海气交换情况,从而间接指示海冰的变化[42]。然而,微体生物化石在北冰洋海冰重建中的应用受到生物的碳酸钙和二氧化硅壳体在沉降过程溶解作用的限制,尤其在北冰洋低生产力冷水环境,壳体很难保存在深海沉积物中,极大地限制了其在北冰洋海冰重建中的应用[43]。此外,这些传统指标的最大限制性是不能量化北极海冰的历史演变。
|
图 4 西北冰洋门捷列夫脊海冰介形虫Acetabulastoma arcticum的沉积记录(修改自Cronin等[39]) 粗线表示平滑数据 Fig. 4 Records of sea-ice ostracod Acetabulastoma arcticuma in western Arctic Mendeleev Ridge(modified from Cronin et al.[39]).Thick line is smoothed data |
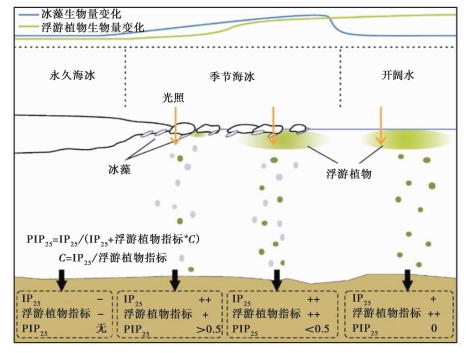
生物标志物是一种较新的地球化学指标,其来源明确,可以稳定地保存在海洋沉积物中,为海洋环境演变提供长时间的沉积记录[44]。2007年,在加拿大北极群岛的海冰以及沉积物中首次发现了一种由海冰硅藻合成的生物标志物,能够稳定地保存在沉积物中,命名为IP25(Ice proxy with 25 carbon atoms,有25个碳原子的海冰指标),是具有一个双键的高度支化的类异戊二烯(Highly Branched Isoprenoids,简称HBIs),目前只在北极和亚北极海域被发现[26]。HBIs是由Haslea,Navicula,Pleurosigma和Rhizosolenia等硅藻产生[45~47],其双键的数量(即不饱和度)主要与藻类的生长温度有关,随着环境温度降低,双键个数减少(不饱和度减小)[48]。因此,只有一个双键的IP25是具有特定来源的古海冰指标。虽然目前IP25的应用仍存在限制,比如水平输送和降解等[49],并且实验室培养难以模拟海冰的状况,缺少海冰密集度与IP25含量之间的矫正曲线,但是已广泛应用于北极和亚北极区域的海冰重建,其海冰重建数据与卫星观测海冰密集度具有良好的线性关系,可以重建长时间尺度的海冰变化[49~51]。前人研究表明,在季节性海冰区域的样品中检测到IP25,在永久性海冰以及开阔水区域的样品中未检测到IP25[26]。因此,未检测到IP25可以指示无冰或者永久性海冰两种情况,因为这两种海冰情况都不符合冰藻的生长条件,仅分析IP25一种生物标志物无法区分无冰和永久性海冰的情况。Müller等[52]结合浮游植物生物标志物菜子甾醇(brassicasterol)区分了这两种海冰情况,菜子甾醇主要由硅藻产生,用来指示浮游植物的丰度[44]。研究表明永久海冰区域IP25和菜子甾醇两种生物标志物都未检测到,因为光照无法穿透永久性海冰从而抑制了冰藻和浮游植物的生长;在季节性海冰区域,IP25和菜子甾醇的含量都很高,因为既有海冰又有光照,适宜冰藻和浮游植物的生长;而在无冰的开阔水区域,只检测到由浮游植物产生的菜子甾醇。随后,Müller等[53]使用弗拉姆海峡表层沉积物中的IP25和浮游植物生物标志物,建立了经验公式,并计算了PIP25指标(Phytoplankton-IP25 index),半定量重建了海冰密集度(图 5)。
|
图 5 北冰洋不同海冰情况下沉积生物标志物的变化以及冰藻和浮游植物生长的响应示意图(修改自Müller等[53]) Fig. 5 Illustration of sedimentary biomarker variability under different Arctic sea ice scenarios and the response of ice algae and phytoplankton(modified from Müller et al.[53]) |
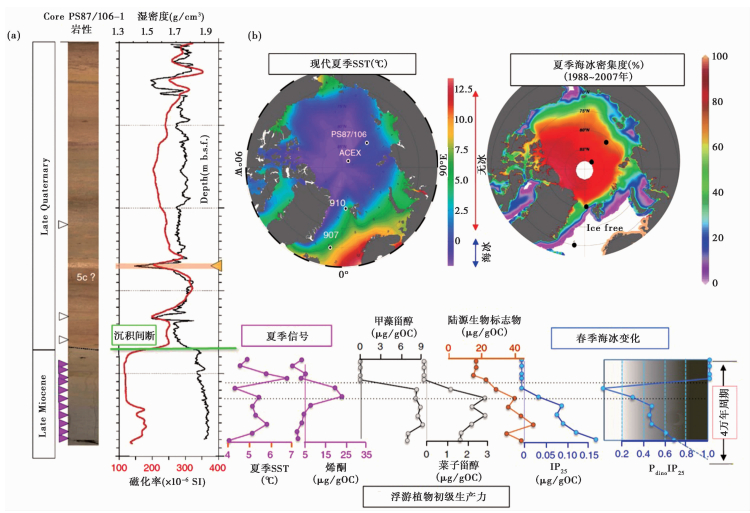
目前,PIP25指标已被用于泛北极区域现代海冰密集度的校正[50~51]以及古海冰的重建[54~55]。北冰洋中心区域被永久性海冰覆盖,沉积速率极低,古海冰重建受到很大限制。高纬度(>80°N)沉积岩芯中的IP25和浮游植物生物标志物记录表明,北冰洋中心区域和弗拉姆海峡的海冰在氧同位素3期和氧同位素2期扩张,其覆盖面积和厚度远高于现代海冰情况[56]。同时,该研究显示末次冰盛期(Last Glacial Maximum,简称LGM)夏季海冰消退至弗拉姆海峡,由北大西洋暖流和离岸风驱动[56]。在北冰洋边缘海,前人使用楚科奇海沉积岩芯中的IP25记录重建了西北冰洋全新世的海冰变化,认为早全新世海冰覆盖程度较低,为季节性海冰,自中全新世海冰开始逐渐扩张,主要受太平洋水输入与太阳辐射控制的影响[18, 57]。在更长时间尺度上,北冰洋中心IP25、烯酮和甾醇生物标志物的记录显示北冰洋中心在中新世由季节性海冰覆盖,夏季海冰完全消退(图 6),当时的气候要暖于现代[58]。
|
图 6 (a) 北冰洋晚中新世表层海水温度、烯酮含量、菜子甾醇含量、甲藻甾醇含量、陆源输入以及海冰的沉积记录;(b)北冰洋现代夏季海水表层温度和海冰分布图 修改自Stein等[58] Fig. 6 (a)Late Miocene sedimentary records of SST, alkenone, dinosterol, brassicasterol, terrestrial input and sea ice in the Arctic; (b)Arctic modern summer SST and sea-ice distributions. Modified from Stein et al.[58] |
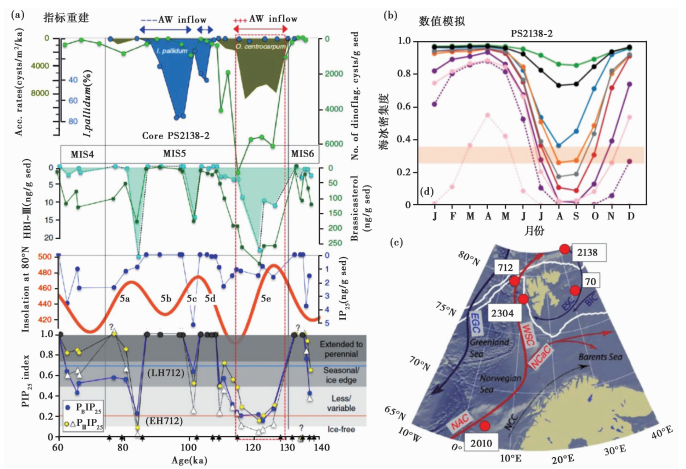
数值模拟是古气候和古海洋研究的重大进步,为北极极端气候时期的海冰重建提供机理支撑[59~60]。如,末次冰盛期(LGM)是末次冰期中气候最为寒冷、冰盖规模达到最大的时期,也是距我们最近的极寒冷时期,作为海冰建模端元有重要意义[61]。然而,末次冰盛期北冰洋的海冰覆盖情况在很长一段时期内都存在争议。Mercer[62]在1970年首次提出末次冰盛期“浮动冰架覆盖北极(floating ice shelf covering the Arctic)”假设。直到21世纪,仍有数值模拟支持该理论[63~64]。早在1995年,“浮动冰架覆盖北极”假设由于缺少地质记录的数据支持,受到了强烈的反对[61]。基于此争议,德国阿尔弗雷德·魏格纳,亥姆霍兹中心极地与海洋研究所AWI(Alfred Wegener Institute,Helmholtz Center for Polar and Marine Research)研发了北大西洋-北冰洋海冰模式(North Atlantic/Arctic Ocean Sea Ice Model,简称NAOSIM)[59~60],NAOSIM耦合了海冰动力-热力学模式和海洋模式,并充分考虑了大气的驱动,包括大气温度、降水和风速等。模式结果表明,末次冰盛期在北冰洋加拿大海盆存在反气旋;虽然穿极流减弱,但是仍有浮冰由北冰洋输送到北大西洋,因此NAOSIM模式的结果并不支持“浮动冰架覆盖北极(floating ice shelf covering the Arctic)”假设[65],并且,弗拉姆海峡和亚北极指标(IRD、IP25、有孔虫)的沉积记录也表明北大西洋暖流可在LGM夏季进入北冰洋[55, 66~67]。近年来的研究将北冰洋多指标的海冰记录与数值模拟相结合(图 7),虽然指标重建和数值模拟之间存在差异,但是共同指示了在气候温暖的末次间冰期(氧同位素5e),北冰洋中心依然存在海冰,而巴伦支海陆架边缘受北大西洋暖流的影响海冰减少;氧同位素6期,巴伦支海和东西伯利亚陆架边缘存在冰间湖,推翻了该时期整个北冰洋被冰架所覆盖的推断[58]。
|
图 7 (a) 北冰洋氧同位素6期和5期不同指标的海冰记录;(b)PS2138-2站位数值模拟海冰变化;(c)研究区域站位图 修改自Stein等[58] Fig. 7 (a)Multi-proxies of sea-ice records in MIS6 and MIS5 in the Arctic Ocean; (b)Numerical simulation of sea-ice variability at station PS2138-2; (c)Station map of the study area. Modified from Stein et al.[58] |
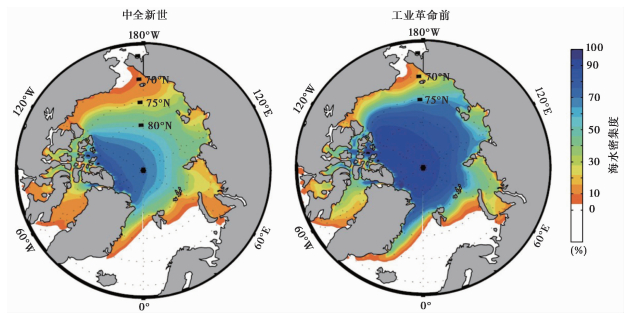
近几年,最新的气候模式用于研究中全新世北极海冰变化对中低纬度及北半球气候的影响[68~69]。首先,研究者基于CESM1-CAM5地球系统模式(Community Earth System Model version 1 with the Community Atmospheric Model version 5),表明北极海冰减少会引起区域不对称的表面温度响应[68]。尤其是在冬季,海冰减少使北美和北太平洋变暖,否则,该时期由于太阳辐射减弱,冬季会变冷;相反,在东亚,海冰减少使初冬的温度略降低[68]。这些地区温度的响应与中高纬度西风减弱和极地平流层变暖有关,中全新世气候的变化主要由北极海冰变化和太阳辐射控制[68]。随后,基于CESM1-CAM5、CNRM-CM5(Coupled Climate Model version 5)和MRI-CGCM3三组气候模式的模拟结果表明全新世中期北半球的年均温度与北极放大效应和海冰减少密切相关;北极海冰减少从夏季持续到冬季,导致中高纬度气温升高[69]。研究结果与指标数据一致,验证了全新世中期北半球的年平均温度比工业化前的气候要高[68](图 8),原因为北极放大效应引起的季节性温度升高。这项研究解决了“全新世温度难题”,因为全新世暖期的指标重建与数值模拟之间一直以来存在差异。
|
图 8 数值模拟北冰洋中全新世和工业革命前海冰密集度(修改自Park等[68]) Fig. 8 Numerical simulation of mid-Holocene and pre-industrial sea ice concentrations in the Arctic(modified from Park et al.[68]) |
准确地重建地质历史时期北冰洋海冰分布的情况,受到北冰洋沉积物地层年代框架的限制。由于低温和低生产力,北冰洋沉积物中有孔虫含量极低且不连续,限制了低纬地区普遍应用的有孔虫氧同位素地层的应用[70]。此外,放射性碳同位素定年的应用受到定年材料缺失、低沉积速率、碳储库效应不明的因素影响,造成很大不确定性。例如,在末次冰盛期(过去2.0~1.8万年),由于海冰的扩张,北冰洋中心只有1cm沉积物甚至出现沉积间断[71~72]。
北冰洋海冰重建指标存在各种限制。IRD有时候难以区分海冰还是冰山的搬运;而北冰洋低生产力和溶解作用,微体生物壳体不易保存在沉积物中,限制了微体化石指标的应用[43]。虽然生物标志物指标IP25的发展使北冰洋海冰演变的研究从定性发展为定量,但是PIP25指标的应用仍需考虑经验公式中单个生物标志物的含量[53]。例如,由于IP25的含量通常比浮游植物生物标志低1~2个数量级,在永久性海冰覆盖区域的沉积物中可能会检测到含量很低的浮游植物生物标志物而IP25含量会低于检测限,通过经验公式的计算PIP25值为0,这大大低估了海冰密集度(图 5)[53]。在这种情况下,通常指定PIP25值为1,代表永久性的海冰覆盖[72~73]。另外,生物标志物IP25作为有机分子化合物,在水体中沉降以及在沉积物中埋藏过程中会发生降解,以及有机质在沉积物中的成岩作用都会影响IP25准确指示海冰的变化[49]。古海冰的定量指标还需要进一步优化和研究。
4 总结和展望北冰洋季节性海冰出现于大约47.5Ma,永久性海冰出现于14Ma,其历史演变与气候变化密切相关,如温室效应和轨道尺度的驱动,并且能够反馈到全球气候变化中。北冰洋微体生物化石的沉积记录显示,氧同位素11期之后海冰的变化周期遵循2万年的岁差周期,受轨道尺度的驱动。在千年时间尺度上,北极海冰的变化与全球温盐环流密切相关,如冷期的氧同位素6期和2期,北冰洋陆架边缘出现冰间湖及夏季海冰消融,都与北大西洋暖流的变化有关。古海冰研究对于我们认识当前的气候变化也有重要意义,例如,数值模拟预测未来北极变暖、海冰消融,而全新世早期海冰覆盖程度远低于现代海冰在北冰洋的分布,但是早全新世的沉积记录显示在该时期海洋浮游植物的生产力远低于逐渐变冷的晚全新世。因此,未来北极变暖、海冰消融、海水表层温度升高的情况下北冰洋生产力却不一定升高。虽然沉积记录中不同指标的重建结果之间存在差异,但是数据积累会使重建更接近真实的结果。由于各项指标有其局限性,多项指标综合对比可以相互补充,能够获得更准确的海冰信息。迄今,北冰洋只有一次IODP航次,未来的北冰洋IODP钻孔将会获得更为连续的沉积记录,提供更为详细的海冰演变历史。另外,数值模拟在古海洋和古气候中的发展应用为海冰历史演变的研究提供了机理的证据支撑,并且,最新的气候模式结果显示中全新世北极海冰变化对中低纬度及北半球气候有影响。未来研究中,指标重建与数值模拟的结合将聚焦古海冰定量重建、控制机制探究以及对全球气候的驱动。
致谢: 感谢审稿专家和编辑部杨美芳老师宝贵的修改意见,在此一并感谢!
| [1] |
Serreze M C, Barry R G. Processes and impacts of Arctic amplification:A research synthesis[J]. Global and Planetary Change, 2011, 77(1-2): 85-96. DOI:10.1016/j.gloplacha.2011.03.004 |
| [2] |
Stroeve J C, Markus T, Boisvert L, et al. Changes in Arctic melt season and implications for sea ice loss[J]. Geophysical Research Letters, 2014, 41(4): 1216-1225. DOI:10.1002/2013GL058951 |
| [3] |
Thomas D N, Dieckmann G S. Sea Ice[M]. Oxford: Blackwell Publishing, 2010: 79-111.
|
| [4] |
苏洁, 徐栋, 赵进平, 等. 北极加速变暖条件下西北航道的海冰分布变化特征[J]. 极地研究, 2010, 22(2): 104-124. Su Jie, Xu Dong, Zhao Jinping, et al. Features of northwest passage sea ice's distribution and variation under Arctic rapidly warming condition[J]. Chinese Journal of Polar Research, 2010, 22(2): 104-124. |
| [5] |
Barry R G. The parameterization of surface albedo for sea ice and its snow cover[J]. Progress in Physical Geography:Earth and Environment, 1996, 20(1): 63-79. DOI:10.1177/030913339602000104 |
| [6] |
Aagaard K, Carmack E C. The role of sea ice and other fresh water in the Arctic circulation[J]. Journal of Geophysical Research:Oceans, 1989, 94(C10): 14485-14498. DOI:10.1029/JC094iC10p14485 |
| [7] |
Broecker W S. Thermohaline circulation, the Achilles Heel of our climate system:Will man-made CO2 upset the current balance?[J]. Science, 1997, 278(5343): 1582-1588. DOI:10.1126/science.278.5343.1582 |
| [8] |
Raymo M E, Rind D, Ruddiman W F. Climatic effects of reduced Arctic sea ice limits in the GISS Ⅱ general circulation model[J]. Paleoceanography, 1990, 5(3): 367-382. DOI:10.1029/PA005i003p00367 |
| [9] |
Vinnikov K Y, Robock A, Stouffer R J, et al. Global warming and Northern Hemisphere sea ice extent[J]. Science, 1999, 286(5446): 1934-1937. DOI:10.1126/science.286.5446.1934 |
| [10] |
Johannessen O M, Bengtsson L, Miles M W, et al. Arctic climate change, observed and modelled temperature and sea-ice variability[J]. Tellus A, 2004, 56(4): 328-341. DOI:10.3402/tellusa.v56i4.14418 |
| [11] |
Cavalieri D J, Gloersen P, Parkinson C L, et al. Observed hemispheric asymmetry in global sea ice changes[J]. Science, 1997, 278(5340): 1104-1106. DOI:10.1126/science.278.5340.1104 |
| [12] |
Stroeve J C, Serreze M C, Holland M M, et al. The Arctic's rapidly shrinking sea ice cover:A research synthesis[J]. Climatic Change, 2012, 110(3-4): 1005-1027. DOI:10.1007/s10584-011-0101-1 |
| [13] |
Johannessen O M, Shalina E V, Miles M W. Satellite evidence for an Arctic sea ice cover in transformation[J]. Science, 1999, 286(5446): 1937-1939. DOI:10.1126/science.286.5446.1937 |
| [14] |
Nghiem S V, Rigor I G, Perovich D K, et al. Rapid reduction of Arctic perennial sea ice[J]. Geophysical Research Letters, 2007, 34(19): L19504. DOI:10.1029/2007GL031138 |
| [15] |
Wang M Y, Overland J E. A sea ice free summer Arctic within 30 years:An update from CMIP5 models[J]. Geophysical Research Letters, 2009, 39(18): L18501. |
| [16] |
Liu J P, Song M R, Horton R M, et al. Reducing spread in climate model projections of a September ice-free Arctic[J]. Proceedings of the National Academy of Sciences of the United States of America, 2013, 110(31): 12571-12576. DOI:10.1073/pnas.1219716110 |
| [17] |
Backman J, Moran K, McInroy D, et al. IODP Expedition 302, Arctic Coring Expedition (ACEX):A first look at the Cenozoic paleoceanography of the Central Arctic Ocean[J]. Scientific Drilling, 2005, 1: 12-17. DOI:10.2204/iodp.sd.1.02.2005 |
| [18] |
Stein R, Fahl K, Schade I, et al. Holocene variability in sea ice cover, primary production, and Pacific-water inflow and climate change in the Chukchi and East Siberian Seas(Arctic Ocean)[J]. Journal of Quaternary Science, 2017, 32(3): 362-379. DOI:10.1002/jqs.2929 |
| [19] |
Massé G, Rowland S J, Sicre M A, et al. Abrupt climate changes for Iceland during the last millennium:Evidence from high-resolution sea ice reconstructions[J]. Earth and Planetary Science Letters, 2008, 269(3-4): 565-569. DOI:10.1016/j.epsl.2008.03.017 |
| [20] |
刘洋, 郑景云, 郝志新, 等. 欧亚大陆中世纪暖期与小冰期温度变化的区域差异分析[J]. 第四纪研究, 2021, 41(2): 462-473. Liu Yang, Zheng Jingyun, Hao Zhixin, et al. Regional differences for temperature changes in Medieval Warm Period and Little Ice over Europe and Asia[J]. Quaternary Sciences, 2021, 41(2): 462-473. |
| [21] |
Polyak L, Alley R B, Andrews J T, et al. History of sea ice in the Arctic[J]. Quaternary Science Reviews, 2010, 29(15-16): 1757-1778. DOI:10.1016/j.quascirev.2010.02.010 |
| [22] |
Andersen C, KoÇ N, Moros M. A highly unstable Holocene climate in the subpolar North Atlantic:Evidence from diatoms[J]. Quaternary Science Reviews, 2004, 23(20-22): 2155-2166. DOI:10.1016/j.quascirev.2004.08.004 |
| [23] |
Knudsen K L, Eiríksson J, Jansen E, et al. Palaeoceanographic changes off North Iceland through the last 1200 years:Foraminifera, stable isotopes, diatoms and ice rafted debris[J]. Quaternary Science Reviews, 2004, 23(20-22): 2231-2246. DOI:10.1016/j.quascirev.2004.08.012 |
| [24] |
Jiang H, Eiríksson J, Schulz M, et al. Evidence for solar forcing of sea-surface temperature on the North Icelandic Shelf during the Late Holocene[J]. Geology, 2005, 33(1): 73-76. DOI:10.1130/G21130.1 |
| [25] |
Ran L H, Jiang H, Knudsen K L, et al. Diatom-based reconstruction of palaeoceanographic changes on the North Icelandic shelf during the last millennium[J]. Palaeogeography, Palaeoclimatology, Palaeoecology, 2011, 302(1-2): 109-119. DOI:10.1016/j.palaeo.2010.02.001 |
| [26] |
Belt S T, Massé G, Rowland S J, et al. A novel chemical fossil of paleo sea ice:IP25[J]. Organic Geochemistry, 2007, 38(1): 16-27. DOI:10.1016/j.orggeochem.2006.09.013 |
| [27] |
章陶亮, 王汝建, 陈志华, 等. 西北冰洋楚科奇海台08P23孔氧同位素3期以来的古海洋与古气候记录[J]. 极地研究, 2014, 34(1): 46-57. Zhang Taoliang, Wang Rujian, Chen Zhihua, et al. Paleoceanographic and paleoclimatic records of core 08P23 from the Chukchi Plateau, western Arctic Ocean, since MIS 3[J]. Chinese Journal of Polar Research, 2014, 34(1): 46-57. |
| [28] |
Darby D A, Ortiz J, Polyak L, et al. The role of currents and sea ice in both slowly deposited central Arctic and rapidly deposited Chukchi-Alaskan margin sediments[J]. Global and Planetary Change, 2009, 68(1-2): 58-72. DOI:10.1016/j.gloplacha.2009.02.007 |
| [29] |
John S K. Cenozoic ice-rafting history of the central Arctic Ocean:Terrigenous sands on the Lomonosov Ridge[J]. Paleoceanography, 2008, 23(1): PA1S05. |
| [30] |
Darby D A. Arctic perennial ice cover over the last 14 million years[J]. Paleoceanography and Paleoclimatology, 2008, 23(1): PA1S07. |
| [31] |
Darby D A, Zimmerman P. Ice-rafted detritus events in the Arctic during the last glacial interval, and the timing of the Innuitian and Laurentide ice sheet calving events[J]. Polar Research, 2008, 27(2): 114-127. DOI:10.1111/j.1751-8369.2008.00057.x |
| [32] |
Stickley C E, St John K, KoÇ N, et al. Evidence for Middle Eocene Arctic sea ice from diatoms and ice-rafted debris[J]. Nature, 2009, 460: 376-379. DOI:10.1038/nature08163 |
| [33] |
DeConto R, Pollard D, Harwood D. Sea ice feedback and Cenozoic evolution of Antarctic climate and ice sheets[J]. Paleoceanography and Paleoclimatology, 2007, 22(3): PA3214. |
| [34] |
Merico A, Tyrrell T, Wilson P A. Eocene/Oligocene ocean de-acidification linked to Antarctic glaciation by sea level fall[J]. Nature, 2008, 452(7190): 979-982. DOI:10.1038/nature06853 |
| [35] |
de Vernal A, Rochon A, Fréchette B, et al. Reconstructing past sea ice cover of the Northern Hemisphere from dinocyst assemblages:Status of the approach[J]. Quaternary Science Reviews, 2013, 79(1): 122-134. |
| [36] |
Sha L, Jiang H, Seidenkrantz M-S, et al. Solar forcing as an important trigger for West Greenland sea-ice variability over the last millennium[J]. Quaternary Science Reviews, 2016, 131(A): 148-156. |
| [37] |
Boetius A, Albrecht S, Bakker K, et al. Export of algal biomass from the melting Arctic sea ice[J]. Science, 2013, 339(6126): 1430-1432. DOI:10.1126/science.1231346 |
| [38] |
Matthiessen J, Schreck M, Schepper D S, et al. Quaternary dinoflagellate cysts in the Arctic Ocean:Potential and limitations for stratigraphy and paleoenvironmental reconstructions[J]. Quaternary Science Reviews, 2018, 192: 1-26. DOI:10.1016/j.quascirev.2017.12.020 |
| [39] |
Cronin T M, Polyak L, Reed D, et al. A 600-ka Arctic sea-ice record from Mendeleev Ridge based on ostracodes[J]. Quaternary Science Reviews, 2013, 79: 157-167. DOI:10.1016/j.quascirev.2012.12.010 |
| [40] |
Polyak L, Best K M, Crawford K A, et al. Quaternary history of sea ice in the western Arctic Ocean based on foraminifera[J]. Quaternary Science Reviews, 2013, 79: 145-156. DOI:10.1016/j.quascirev.2012.12.018 |
| [41] |
Lazar K B, Polyak L. Pleistocene benthic foraminifers in the Arctic Ocean:Implications for sea-ice and circulation history[J]. Marine Micropaleontology, 2016, 126: 19-30. DOI:10.1016/j.marmicro.2016.04.004 |
| [42] |
Polyak L, Darby D A, Bischof J F, et al. Stratigraphic constraints on Late Pleistocene glacial erosion and deglaciation of the Chukchi margin, Arctic Ocean[J]. Quaternary Research, 2007, 67(2): 234-245. DOI:10.1016/j.yqres.2006.08.001 |
| [43] |
Schlüter M, Sauter E. Biogenic silica cycle in surface sediments of the Green-land Sea[J]. Journal of Marine Systems, 2000, 23(4): 333-342. DOI:10.1016/S0924-7963(99)00070-6 |
| [44] |
Eglinton T I, Eglinton G. Molecular proxies for paleoclimatology[J]. Earth and Planetary Science Letters, 2008, 275(1-2): 1-16. DOI:10.1016/j.epsl.2008.07.012 |
| [45] |
Belt S T, Allard W G, Rintatalo J, et al. Clay and acid catalysed isomerization and cyclisation reactions of highly branched isoprenoid(HBI) alkenes:Implications for sedimentary reactions and distributions[J]. Geochimica et Cosmochimica Acta, 2000, 64(19): 3337-3345. DOI:10.1016/S0016-7037(00)00444-0 |
| [46] |
Belt S T, Allard W G, Massé G, et al. Structural characterization of C30 highly branched isoprenoid alkenes(Rhizenes) in the marine diatom Rhizosolenia setigera[J]. Tetrahedron Letters, 2001, 42(32): 5583-5585. DOI:10.1016/S0040-4039(01)01063-2 |
| [47] |
Belt S T, Massé G, Allard W G, et al. C25, highly branched isoprenoid alkenes in planktonic diatoms of the Pleurosigma genus[J]. Organic Geochemistry, 2001, 32(10): 1271-1275. DOI:10.1016/S0146-6380(01)00111-5 |
| [48] |
Rowland S J, Belt S T, Wraige E J, et al. Effects of temperature on polyunsaturation in cytostatic lipids of Haslea ostrearia[J]. Phytochemistry, 2001, 56(6): 597-602. DOI:10.1016/S0031-9422(00)00434-9 |
| [49] |
Belt S T, Müller J. The Arctic sea ice biomarker IP25:A review of current understanding, recommendations for future research and applications in palaeo sea ice reconstructions[J]. Quaternary Science Reviews, 2013, 79(4): 9-25. |
| [50] |
Xiao X, Fahl K, Müller J, et al. Sea-ice distribution in the modern Arctic Ocean:Biomarker records from trans-Arctic Ocean surface sediments[J]. Geochimica et Cosmochimica Acta, 2015, 155: 16-29. DOI:10.1016/j.gca.2015.01.029 |
| [51] |
Kolling H M, Stein R, Fahl K, et al. Biomarker distributions in (sub)-Arctic surface sediments and their potential for sea ice reconstructions[J]. Geochemistry, Geophysics, Geosystems, 2020, 21(10): e2019GC008629. |
| [52] |
Müller J, Massé G, Stein R, et al. Variability of sea-ice conditions in the Fram Strait over the past 30, 000 years[J]. Nature Geoscience, 2009, 2(11): 772-776. DOI:10.1038/ngeo665 |
| [53] |
Müller J, Wagner A, Fahl K, et al. Towards quantitative sea ice reconstructions in the northern North Atlantic:A combined biomarker and numerical modelling approach[J]. Earth and Planetary Science Letters, 2011, 306(3): 137-148. |
| [54] |
Belt S T. Source-specific biomarkers as proxies for Arctic and Antarctic sea ice[J]. Organic Geochemistry, 2018, 125: 277-298. DOI:10.1016/j.orggeochem.2018.10.002 |
| [55] |
Belt S T. What do IP25 and related biomarkers really reveal about sea ice change?[J]. Quaternary Science Reviews, 2019, 204: 216-219. DOI:10.1016/j.quascirev.2018.11.025 |
| [56] |
Xiao X, Stein R, Fahl K. MIS 3 to MIS 1 temporal and LGM spatial variability in Arctic Ocean sea ice cover:Reconstruction from biomarkers[J]. Paleoceanography, 2015, 30(7): 969-983. DOI:10.1002/2015PA002814 |
| [57] |
Polyak L, Belt S T, Cabedo-Sanz P, et al. Holocene sea-ice conditions and circulation at the Chukchi-Alaskan margin, Arctic Ocean, inferred from biomarker proxies[J]. The Holocene, 2016, 26(11): 1810-1821. DOI:10.1177/0959683616645939 |
| [58] |
Stein R, Fahl K, Schreck M, et al. Evidence for ice-free summers in the Late Miocene central Arctic Ocean[J]. Nature Communications, 2016, 7: 1-13. DOI:10.1038/ncomms11148 |
| [59] |
Kauker F, Gerdes R, Karcher M, et al. Variability of Arctic and North Atlantic sea ice:A combined analysis of model results and observations from 1978 to 2001[J]. Journal of Geophysical Research, 2003, 108(C6): 3182. DOI:10.1029/2002JC001573 |
| [60] |
Køberle C, Gerdes R. Mechanisms determining the variability of Arctic sea ice conditions and export[J]. Journal of Climate, 2003, 16(17): 2843-2858. DOI:10.1175/1520-0442(2003)016<2843:MDTVOA>2.0.CO;2 |
| [61] |
Sher A. Is there any real evidence for a huge shelf ice sheet in East Siberia?[J]. Quaternary International, 1995, 28: 39-40. DOI:10.1016/1040-6182(95)00036-I |
| [62] |
Mercer J H. A former ice sheet in the Arctic Ocean?[J]. Palaeogeography, Palaeoclimatology, Palaeoecology, 1970, 8(1): 19-27. DOI:10.1016/0031-0182(70)90076-3 |
| [63] |
Grosswald M, Hughes T. The Russian component of an Arctic ice sheet during the Last Glacial Maximum[J]. Quaternary Science Reviews, 2002, 21(1-3): 121-146. DOI:10.1016/S0277-3791(01)00078-6 |
| [64] |
Grosswald M, Hughes T. The case for an ice shelf in the Pleistocene Arctic Ocean[J]. Polar Geography, 2008, 31(1-2): 69-98. DOI:10.1080/10889370802175929 |
| [65] |
Stälrz M, Gong X, Stein R, et al. Glacial shortcut of Arctic sea-ice transport[J]. Earth and Planetary Science Letters, 2012, 357-358: 257-267. DOI:10.1016/j.epsl.2012.09.033 |
| [66] |
Sarnthein M, Pflaumann U, Weinelt M. Past extent of sea ice in the northern North Atlantic inferred from foraminiferal paleotemperature estimates[J]. Paleoceanography and Paleoclimatology, 2003, 18(2): 1047. |
| [67] |
Hebbeln D T, Dokken E S, Andersen M, et al. Moisture supply for northern ice-sheet growth during the Last Glacial Maximum[J]. Nature, 1994, 370: 357-360. DOI:10.1038/370357a0 |
| [68] |
Park H S, Kim S J, Seo K H, et al. The impact of Arctic sea ice loss on mid-Holocene climate[J]. Nature Communications, 2018, 9: 4571. DOI:10.1038/s41467-018-07068-2 |
| [69] |
Park H S, Kim S J, Stewart A, et al. Mid-Holocene Northern Hemisphere warming driven by Arctic amplification[J]. Science Advances, 2019, 5(12): eaax8203. DOI:10.1126/sciadv.aax8203 |
| [70] |
Xiao W, Polyak L, Wang R, et al. Middle to Late Pleistocene Arctic paleoceanographic changes based on sedimentary records from Mendeleev Ridge and Makarov Basin[J]. Quaternary Science Reviews, 2020, 228: 106105. DOI:10.1016/j.quascirev.2019.106105 |
| [71] |
Cronin T M, Dwyer G S, Farmer J, et al. Deep Arctic Ocean warming during the last glacial cycle[J]. Nature Geoscience, 2012, 5: 631-634. DOI:10.1038/ngeo1557 |
| [72] |
Müller J, Stein R. High-resolution record of Late Glacial and deglacial sea ice changes in Fram Strait corroborates ice-ocean interactions during abrupt climate shifts[J]. Earth and Planetary Science Letters, 2014, 403: 446-455. DOI:10.1016/j.epsl.2014.07.016 |
| [73] |
Xiao X, Zhao M, Knudsen K L, et al. Deglacial and Holocene sea-ice variability north of Iceland and response to ocean circulation changes[J]. Earth and Planetary Science Letters, 2017, 472: 14-24. DOI:10.1016/j.epsl.2017.05.006 |
2 Laboratory for Marine Ecology and Environmental Science, Qingdao National Laboratory for Marine Science and Technology, Qingdao 266237, Shandong)
Abstract
In recent decades, with the global warming and the increase of atmospheric CO2 concentrations, the extent and thickness of the Arctic sea ice have been greatly reduced. The numerical simulation predicted that in the next 20~50 years, the central Arctic basin may become an ice-free area in summer. The sedimentary records of sea-ice variability in the Arctic Ocean can provide us a clear understanding of the controlling mechanism of modern sea ice decrease and provide an insight for predicting the future sea-ice change. This paper reviewed the approaches of Arctic sea-ice reconstruction, including proxies and modeling. Traditional proxies of paleo-sea ice include Ice-Rafted Detritus(IRD), paleo-microfossils, and geochemical indicators. The sedimentary records of IRD and paleo-microfossils suggested that the onset of sea ice in the Arctic was ca. 47.5 Ma and the onset of permanent sea ice was ca.14 Ma. However, these proxies have limitations to reconstruct paleo-sea ice because they are indirect proxies and cannot quantify sea-ice concentrations. In the past ten years, the development of IP25(Ice Proxy with 25 carbon atoms, biomarkers), a direct proxy of sea ice, is a milestone in the study of sea-ice reconstruction from qualitative evaluation to quantitative estimates. The combination of IP25 records and numerical simulation indicate the occurrence of polynya along the Arctic continental margins during Marine Isotope Stage 6. In recent years, new climate model showed that northern hemisphere temperature during the mid-Holocene was driven by the Arctic sea-ice variability. In future studies, with the combination of multi-proxy approach and the numerical simulation, we can better understand the controlling mechanism of sea-ice change and its driving to the global climate change. 2021, Vol.41

