2 Center for Advanced Measurements in Extreme Environments, University of Texas at San Antonio, San Antonio 78249, USA;
3 中国科学院生物演化与环境卓越创新中心, 北京 100044;
4 中国科学院大学, 北京 100049)
冰冻圈由于对气候变化具有高度敏感性和重要的反馈作用,成为全球气候变化最显著的指示器[1]。尤其是全球气候变暖的背景下,冰冻圈研究受到前所未有的重视[2]。极地海冰是冰冻圈最重要的组成部分之一,海冰通过全球水循环和能量再分配与地球其他圈层相互联系,在全球气候系统中扮演重要角色[3]。海冰变化不仅与当前气候变化密切关联,并且对“冰上丝绸之路”开发、极地生态环境、资源开发和地缘政治等方面产生重要影响[4],因此成为全世界高度关注的热点议题。
在全球气候变暖背景下,两极海冰呈现出相反的长期变化趋势,即北极海冰范围和厚度均显著减少[5~6],南极海冰范围则略有增加[7~8],其中罗斯海是南极海冰范围增大趋势最明显的区域[9]。目前,两极海冰的这种不对称变化的背后驱动机制还存在争议。已有研究集中在海冰变化与温度的相互作用上,而对降水在海冰生消过程中所起作用则知之甚少。两极海冰的不同变化趋势可能与降水在海冰生消中起到的不同作用有关:在北极降水通过融池现象减少海冰生长[10],在南极积雪通过生成雪冰增加海冰生长[11]。但是降水在两极海冰质量平衡中贡献多大,还需要进一步通过同位素混合模型来厘定。
过去海冰研究普遍采取野外识别和同位素判别法确定钻孔不同层位的起源[12~14],原来的判别方法由于分辨率较低和对混合作用的忽略,导致质量平衡结果往往误差较大和可重复性差。本文利用氧同位素(δ18O)和氘盈余(d-excess)建立的海冰同位素混合模型,选择合理的端元值计算不同组分贡献比,分别量化了融池在北极海冰质量平衡中的贡献[10]以及雪冰在南极海冰质量平衡中的贡献[11]。在罗斯海各种起源的海冰类型齐全(冰针冰、雪冰、附加冰和小板冰),本文提出三氧同位素(17O-excess)可以作为一种新的示踪同位素,从而量化罗斯海海冰质量平衡中四组分的贡献比。
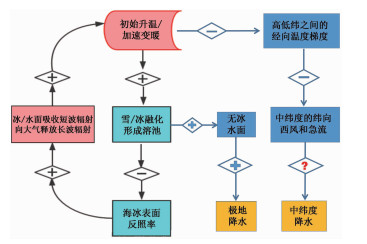
1 研究背景 1.1 海冰在气候系统中的重要作用极地海冰变化通过淡水和能量的交换,与气候系统的其他组成部分相互联系,因此海冰在全球气候系统中扮演重要角色[3]。本文系统地总结了前人相关的研究成果[15~25],得出极地海冰变化对全球气候系统的影响如图 1所示。在最近的观测与模式研究中均发现,随着温室气体浓度增加,全球温度变化在高纬度地区比在低纬度地区更显著,被称为极地放大效应[15~16]。原因在于,极地海冰减少-反照率下降-温度升高的正反馈过程加速了极地地区尤其是北极的变暖[17]。同时,极地海冰的覆盖范围存在明显的季节性变化,该季节性生消过程会改变海洋上层的盐度分布,进而影响到两极地区深层水的形成(南极底层水和北大西洋深层水),是全球经向翻转环流(MOC)的重要驱动力[18]。此外,极地特别是北极海冰范围减少,增加了极地无冰水面面积,局地蒸发增强会产生更多的极地降水[19~20]。另外,极地增暖减弱了大气的经向温度梯度,改变纬向上西风急流的位置和强度[21],可能会减少中纬度地区的降水[22],并且与我国的极端天气事件也密切相关[23~24];但也有研究对此质疑,认为极地变暖并非是中纬度极端天气产生的必要条件[25]。
|
图 1 海冰在全球气候系统中的重要作用该图左半部分是对温度的作用,右半部分是对降水的影响; 加号表示增强作用,减号表示减弱作用,问号表示存在争议 Fig. 1 The critical roles of sea ice in the global climate system. The left half of the figure displays the impact on temperature, and the right half displays the effects on precipitation; plus signs indicate enhancing, minus signs indicate weakening, and the question mark indicates controversy |
由于目前对极地复杂的海冰、冰架和冰盖过程缺乏了解,相对于全球其他区域而言,极地气候系统的模拟结果偏差最大[26]。特别的是,目前全球耦合气候模式对南极海冰的模拟存在很大不确定性[27],仍不清楚自然变率和人类活动对南极海冰影响的相对重要性[28]。由于海冰的复杂生长过程和极地观测资料匮乏,海冰模式对某些重要热力和动力过程的描述仍很不完善[29],因此深入理解海冰的物理特性和生长机制,将有助于获得海冰模式的关键物理参数化方案,从而改善气候模式。
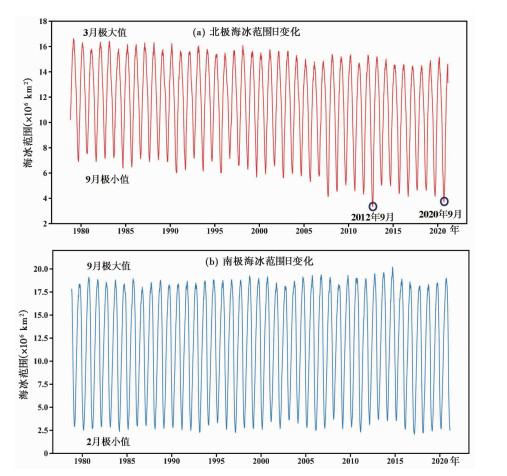
1.2 两极海冰的不对称变化两极海冰范围存在相反的季节性变化:北极海冰范围在3月最大,9月最小(图 2a);南极海冰范围在2月最小,9月最大(图 2b)。南极海冰范围的季节变率远大于北极[30]。自1978年有卫星观测记录(美国国家雪冰数据中心http://www.nsidc.org/data/seaice)以来,北极海冰范围和厚度均在显著减少。特别是在2020年9月北极海冰范围约为374×104km2,比1980年至2010年期间的平均值(627×104km2)小约40 %;有现代观测记录以来,2020年是仅次于2012年海冰范围第二小的年份。
|
图 2 北极(a)和南极(b)海冰范围自1978年10月26日至2021年3月31日的日变化 数据来源:美国国家雪冰数据中心http://www.nsidc.org/data/seaice Fig. 2 Arctic and Antarctic daily sea-ice extent from 10/26/1978 to 3/31/2021 (data source: National Snow and Ice Data Center http://www.nsidc.org/data/seaice) |
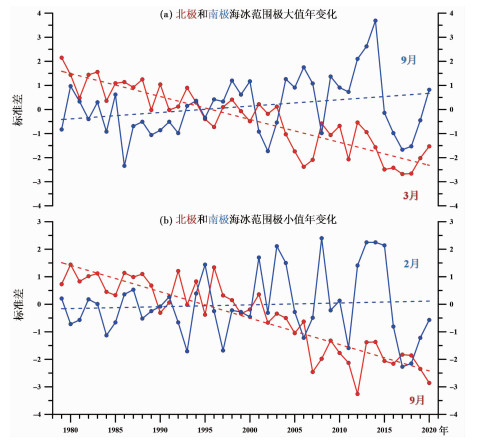
在全球气候变暖背景下,两极海冰范围的极大值(图 3a)与极小值(图 3b)均呈现相反的年代际变化趋势,即北极海冰范围显著减少,南极海冰范围则略有增加。特别需要注意的是,南极海冰范围在最近几年出现了前所未有的趋势突变,在2017年达到40年来的最低点[8]。对这一海冰范围异常变化机制的研究,可以完善海冰模式的关键物理参数,从而更加准确模拟南极海冰的变化。在南极的不同海域海冰范围长期变化趋势也不尽相同,其中罗斯海(Ross Sea)是南极海冰范围增大趋势最明显的地方[31],而在别林斯高晋海(Bellingshausen Sea)及其附近海域海冰范围实际上保持着长期减少的趋势[8]。罗斯海的海冰范围在1979~2015年持续增加,结冰期持续时间增长明显(共增加约两个月);然而最近几年罗斯海的海冰范围增加趋势发生逆转,特别是在2017年秋季冰缘前进发生了变晚现象(最晚的区域约迟了两个月)[32]。
|
图 3 两极海冰范围在1979~2020年的极大值(a)和极小值(b)相对变化趋势用相对于1981~2010年海冰范围均值的年际变化方差表示,虚线表示1979~2020年变化的拟合趋势线 数据来源:美国国家雪冰数据中心http://www.nsidc.org/data/seaice Fig. 3 Variations of maximum (a) and minimum (b) of sea ice extent in the Arctic and Antarctic during 1979~2020. It is expressed as the standard deviation of the interannual variation relative to the mean sea ice extent from 1981 to 2010, and the dotted line shows the fitting trend line of change from 1979 to 2020. Data source: National Snow and Ice Data Center http://www.nsidc.org/data/seaice |
目前,两极海冰不同变化趋势的背后驱动机制还存在着争议[33]。自有观测记录以来,北极海冰的变化与全球变暖几乎是同步的:北极海冰范围和密集度减小使得无冰水面增加,海冰表面的反照率比开阔海面的要高得多,于是通过无冰水面进入海洋的太阳辐射能增加,从而通过正反馈过程使北极加速变暖(图 1)。北极的海洋变化是影响海冰变化的最重要因素之一[34~36]:北冰洋上层海洋在21世纪增暖能量的80 % 来自于海表面的热通量[34];计算表明1965年以来北冰洋夏季上层海洋变暖足以使冬季的海冰生长减少0.75m[35];挪威海的沉积物记录显示冰岛-苏格兰溢流(ISOW)的历史变化与海冰活动密切相关[36]。海冰范围的变化也受到大气环流指数异常的强烈影响[37~39]:早期工作认为海冰变化和北大西洋涛动(NAO)有关[37];后来研究发现北极偶极子(AD)逐步成为驱动海冰变化越来越重要的环流因子[38];Ding等[39]对大气环流进一步研究发现,大气环流的长期趋势决定了60 % 的海冰变化,而内部变率决定了剩余的变化。
与北极不同,几十年来南极海冰范围却在全球变暖趋势下呈增长趋势[7~8]。最近的研究发现,厄尔尼诺-南方涛动(ENSO)和南半球环状模(SAM)是驱动南极气候变化的主要自然变率,这两种模态控制了南极海冰的多年代际变化趋势[28],而环南极大陆的纬向风的变化控制了南极海冰的季节变率[40]。南大洋上层海洋的状态也被认为是控制南极海冰演化的重要因素:Bintanja等[41]认为南极冰架融水较冷且密度较低,增加的融水积累到海洋上层,使变冷的表层水在秋冬季更容易重新冻结;Liu和Curry[42]认为是海洋温度升高促使降水增多,使海洋上层含盐度更低和海水密度相应下降,使海洋上层结构更趋稳定,从而减缓温暖的深层水上升引起的海冰融化。南极臭氧层空洞也是不可忽略的原因之一[43],臭氧空洞增强环绕南极大陆的西风强度,有效地把南极从全球变暖中隔离开,导致南极海冰面积出现异常增加情况。
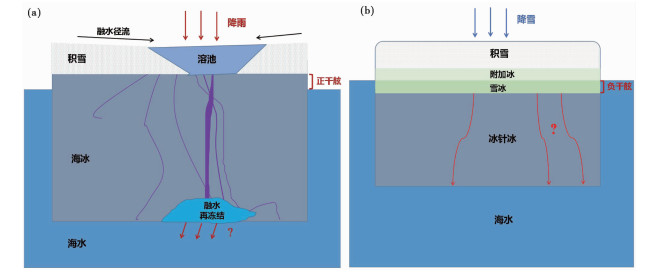
除了大尺度温度场和环流变化对海冰范围变化的驱动,Tian等[10~11]认为降水在海冰小尺度生消过程中也起到重要作用。南极海冰厚度一般在1~2m之间,而北极海冰一般在3~5m之间;覆盖海冰之上积雪的厚度在南极也远大于北极。如图 4所示,在北极地区主要是较薄的积雪覆盖在较厚的海冰上,所以海冰一般具有正的干舷,在夏季海冰表面出现融池(melt pond)现象[10];在南极是较厚的积雪覆盖在较薄的海冰上,所以海冰一般具有负的干舷,在海冰上覆积雪的底部,融化的雪水会和侵入的海水混合后重新冻结成雪冰(snow ice)[11]。
|
图 4 海冰在北极(a)和南极(b)对降水/积雪的不同响应过程 据文献[10]和[11]修改 Fig. 4 Different responses of sea ice to precipitation/snow cover in the Arctic (a) and Antarctic (b). Modified from references[10] and [11] |
北极融池是固态积雪融化的产物,同时也有海冰融化季节液态降雨的补给(图 4a)。夏季北极一年冰上观测到融池覆盖率可达到海冰面积一半以上[44],由于融池表面反照率低和吸收的太阳短波辐射多,从而加快了海冰的融化过程[45]。近年来,贯通的融池比例增大[46],进而增强了海冰的动力破碎过程[47]。在南极广泛发生的雪冰现象[48]:较厚的积雪重到把较薄的海冰的顶部表面压入海平面下时,海水和雪的混合物形成了一层雪泥。随后被重新冻结形成雪冰,从而合并到海冰冰层中(图 4b)。雪冰在南极海冰质量平衡中均起着关键的作用,目前报道的南极海冰质量平衡中雪冰的最高贡献比,是在阿蒙森海发现的36 % [49]。
因此,降水在北极主要起到促进海冰消融的作用,而在南极主要起到促使海冰加积生长的作用。然而,降水在两极海冰物质平衡中质量混合比多大,多少淡水在海冰生长过程中重新注入表层海洋,还需要通过质量平衡量化手段来加以厘定。
2 研究方法 2.1 判别法和混合模型海冰一般具有以下几种冰结构,即柱状、粗粒、细粒和混合结构[50]。冰结构及硬度可以作为解读海冰形成来源的辅助手段,但是因为极地多变的风浪环境和海冰复杂的物理过程,海冰的物理特性并不能很好地指示海冰的起源。虽然较早的海冰物质平衡模型采用盐度示踪[12, 14],但是因海冰生消过程中具有脱盐作用,盐度在海冰物质平衡是非闭合系统,因此不能作为有效示踪剂。其他水化学指标如离子浓度也被作为端元也被广泛用在水文研究中[51~52],但与盐度一样因在海冰生消过程中是非闭合系统而不能作为示踪剂。
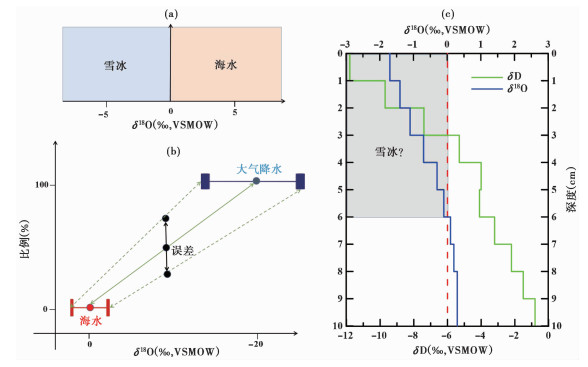
水体稳定同位素(δ18O和δD)研究已被广泛被用于冰芯古气候研究中[53~54]。因降水和海水起源的δ18O(或δD)具有完全不同的同位素信号,海冰钻孔的δ18O(或δD)也可以作为指示极地大气降水输入的示踪剂[55~56],常用于判别海冰钻孔剖面上降水起源层位的位置。以雪冰的同位素判别法为例,大多数研究都使用δ18O<0作为标准[55~56],来判别海冰钻孔层位是否为雪冰,如图 5a所示。本文对南极阿蒙森海一冰芯进行了高分辨率切片和同位素分析:当我们将0~10cm切片当做一个整体时(平均δ18O为-0.5 ‰)全部被认为是雪冰,而按照1cm间隔测试时只有0~6cm部分被诊断为雪冰(图 5c)。由于海冰冰芯通常较低分辨率(每个切片间隔5~10cm)的同位素测量,这种雪冰的同位素判别法可能存在较大误差。而同位素混合模型考虑了雪冰和下覆冰层之间存在的同位素的混合/扩散过程,不会对特定切片的海冰类型进行判断,而是计算出在该层位雪冰的贡献比例,见图 5b所示。
|
图 5 雪冰贡献的同位素判别方法(a)和混合模型(b)示意图,及对南极一海冰冰芯0~10cm切片的高分辨率同位素分析(c) Fig. 5 Schematic diagrams of snow-ice contributions determined by classification approach (a) and isotope mixing model (b); high-resolution isotopic analyses performed in the 0~10cm section of an Antarctic sea-ice core (c) |
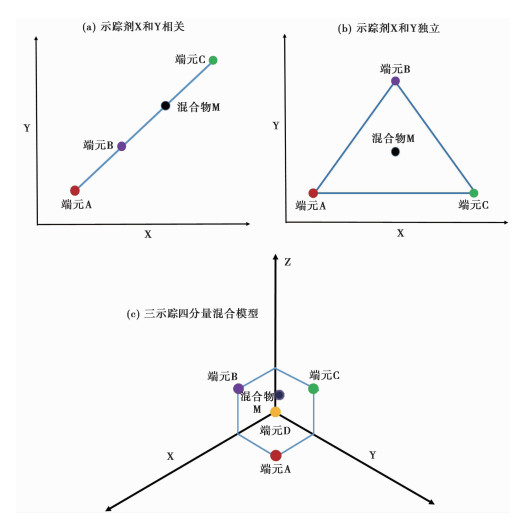
在二示踪三分量模型中,选择的示踪同位素X和Y必须相互独立。如果示踪同位素X和Y表现出显著的线性关系(图 6a),混合物M可以是1/2的B和1/2的C的混合,也可以是1/3的A和2/3的C的混合,因此这些端元的实际贡献无法确切得出。如果两个变量X和Y相互独立(图 6b),混合物M只能是1/3 A,1/3 B和1/3 C的混合。对于具有四个端元以上的多同位素示踪(图 6c),则需要找到不与示踪同位素X和Y共面,且处于封闭系统的新示踪同位素Z。
|
图 6 示踪同位素相关(a)和独立(b)时的质量平衡;(c)三示踪四分量混合模型 Fig. 6 Mass balance using correlated (a) and independent (b) tracers; (c)three-tracer for four-component model |
在极地不同水体中的δ18O和δD均存在共线性,因此在端元混合模型中只能两者取其一作为示踪同位素。虽然氘盈余(d-excess)是由δ18O和δD求出的二阶参数(d-excess=δD-8×δ18O),但是d-excess所示踪的信号独立于δ18O或δD。氘盈余已被广泛用于确定降水的水汽来源[57]和蒸发过程[58],也成功地应用于青藏高原冰川[59]、南极冰盖[60]和格陵兰冰盖[61]的冰芯古气候记录中。Kopec等[62]认为极地降水的d-excess值降低,指示着北极局地蒸发的水汽增加,这与海冰减少导致的北极无冰水面增加有关。因此海冰的d-excess可以示踪冰芯中降水来源层位的季节性[10]。当海冰质量平衡中存在3个以上的组分来源时,则需要找到独立于δ18O和d-excess的新示踪同位素。
随着三氧同位素的高精度测量的发展[63~64],研究发现降水的17 O盈余(17O-excess=δ′17 O-0.528δ′18 O)对水汽蒸发过程中的动力分馏作用的响应非常敏感。17O-excess和d-excess都可以示踪水汽来源及演化,但两者指示意义存在差异[65]:d-excess对水汽蒸发过程的温度和湿度响应灵敏;17O-excess的变化主要取决于水汽源区的湿度变化而与温度变化关系不大,降雪过程不会对17O-excess产生显著影响。最近的研究发现极地地区的雪样17O-excess可以示踪降雪的水汽来源和降雪-海冰之间的水文过程[66~67]。因此,17O-excess可以作为独立于δ18O和d-excess的示踪同位素,应用于4个组分以上的多同位素混合模型中。
另外一个可行的方向是开发水体中溶质的同位素,比如水体硝酸盐的氮氧同位素(δ 15 N和δ18O),水体可溶解无机碳(DIC)碳氧同位素(δ13C和δ18O)等同位素指标,作为多同位素混合模型中示踪同位素的备选项。但是和水体17O-excess不同的是,溶质的同位素在混合模型中具有浓度依赖性,即不同端元的溶质在海冰生消过程中的损耗可能不同,从而增加了质量平衡计算的复杂性[68]。
2.3 混合模型的选择海冰不同组分的同位素具有一定变化范围,并且需要考虑海冰生成和迁移过程中的同位素分馏过程的影响。可以采用线性混合模型(IsoError[69]和IsoSource[70])和贝叶斯混合模型(SIAR[71]、MixSIR[72]和MixSIAR[73])模型来计算各个组分贡献的误差范围,并比较不同混合模型的有效性。
以IsoError和IsoSource为代表的线性混合模型基于以下质量平衡方程[69~70]:

|
(1) |

|
(2) |
公式(1)和(2)中,Fi是组分i的贡献比;δij是组分i 的示踪剂j 的同位素值;δtj是混合物的示踪剂 j的同位素值。在共n种组分的情况下,一般选择n-1种示踪剂。
以SIAR、MixSIR和MixSIAR为代表的贝叶斯混合模型基于以下质量平衡方程[71~73]:

|
(3) |

|
(4) |

|
(5) |

|
(6) |
公式(3)~(6)中,Pk 是需要求解的组分k的贡献比;Xij是混合物i的示踪剂 j 的同位素值;Sjk是组分k的示踪剂 j的同位素值,以平均值μjk和标准差ωjk呈正态分布;Cjk是组分k的示踪剂j 的同位素分馏系数,以平均值 λjk和标准差τjk呈正态分布;εjk是组分k的示踪剂 j 在N个混合物之间的残差,以平均值0和标准差σj呈正态分布。质量平衡方程组中共有J种示踪同位素,K种组分来源和N种混合物,因此i取值为1,2,3,…,N,j取值为1,2,3,…,J,k取值为1,2,3,…,K。
以上线性混合模型和贝叶斯混合模型等研究方法的对比总结如表 1所示。这些混合模型在具体的质量平衡应用实践上各有优劣势。IsoError在Excel表格中操作,简单易懂,是二端元和三端元模型的最优选择;但是目前无多同位素混合模型。IsoSource具有图形用户界面(GUI),操作简单并且结果可视化;但模型容差参数的调整会导致贡献比结果的较大变化,并且当端元数远大于示踪同位素数量时,求出的贡献率分布范围经常过大而无实际意义。SIAR考虑了多种来源的不确定性和先验信息;但是需要用户有一定R语言基础。MixSIR只有当混合物取值非常稳定时结果才可靠;混合物取值的微小变动会引起贡献比结果的巨大变化,并且与其他模型相比误差较大[68]。MixSIAR不仅考虑了多种端元的不确定性和先验信息,还加入连续协变量与倍增误差项;具有GUI且操作界面友好,因此是目前最优的贝叶斯混合模型。综上所述,对于单同位素和双同位素混合模型,本文推荐使用IsoError进行计算;对于多同位素混合模型,本文推荐使用MixSIAR。
| 表 1 不同同位素混合模型的对比总结 Table 1 Summary of source partitioning methods using isotope mixing models |
随着北极气候加速变暖,北冰洋海冰快速融化,尤其是多年冰比例急剧下降,而日益增多的融池现象通过海冰-反照率正反馈作用对此起到了关键作用[17]。目前对海冰融池的研究大多集中在其空间分布上,因受研究区条件和技术限制,对于多年冰的融池在时间上的演化过程研究甚少。目前认为多年冰的融池主要来自雪被融水,现有的融池质量平衡模型未考虑到融池形成后新的降水补给[44~45]。目前的融池水化学模型认为在融池发展过程中会形成对流并充分混合[46],但缺乏实测记录的支持。针对以上问题,Tian等[10]通过获得的2015年Sea State航次中收集到两个多年冰站点的冰芯,开展了多种水体(海冰、积雪和海水)同位素研究,针对海冰融池进行了质量平衡研究。同位素测试均在得克萨斯大学圣安东尼奥分校地质系的液态水同位素分析仪(Picarro L2140-i water analyzer)上完成。
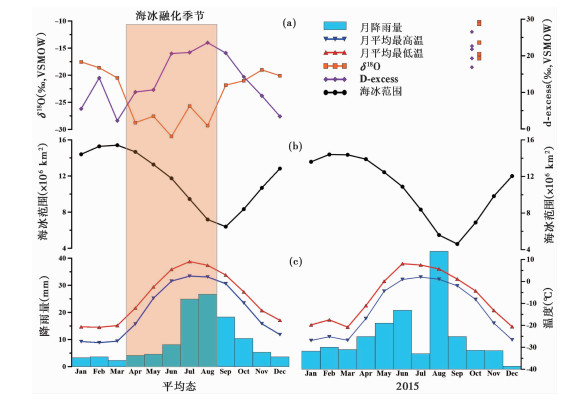
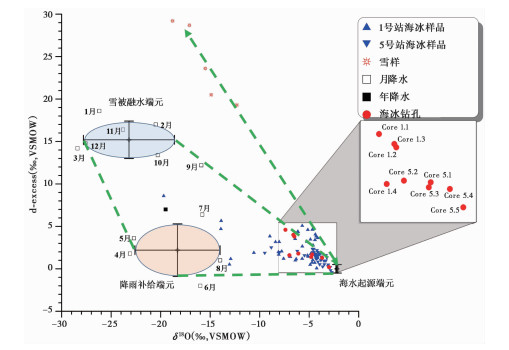
海冰的δ18O可以示踪大气降水和海水来源比例,却无法区分降水来源是雪被融化,还是融池形成后新的降水补给[10]。我们注意到海冰形成季节(9月到次年3月)与海冰融化季节(4月到8月)的降水水汽来源不同,导致两个季节降水氘盈余显著不同(图 7)[10]。考虑冰-水同位素分馏后,我们利用IsoError的双同位素示踪剂(δ18O和d-excess)模型,对海冰冰芯中的海水来源、雪被融化和降雨补给等三端元物质平衡进行了划分[10](图 8),结果表明,质量平衡计算得出在北极9个不同冰芯钻孔中,海水来源贡献比平均为82 %,雪被融水贡献比平均为13 %,降雨补给贡献比平均为5 %。
|
图 7 (a) 模拟的1950年以来的平均月降水δ18O(数据来源:OIPC,http://www.waterisotopes.org)和d-excess以及Sea State航次采集的雪样的同位素;(b)海冰范围在1981~2010年的月平均变化和2015年月变化;(c)阿拉斯加巴罗气象站1981~2010年和2015年的月平均降水,月平均最高温和最低温 据文献[10]修改 Fig. 7 (a)Modeled the long-term means of monthly δ18O and d-excess in precipitation(data source: OIPC, http://www.waterisotopes.org)and measured δ18O and d-excess of snow samples collected during the Sea State cruise; (b)Monthly sea ice extent for long-term means of 1981~2010 and 2015; (c)Monthly precipitation amount, maximum temperature, and minimum temperature for long-term means of 1981~2010 and 2015 at a meteorological station in Barrow, Alaska. Modified from reference[10] |
|
图 8 利用δ18O和d-excess建立的双同位素三元混合模型对北极海冰进行物质平衡划分 据文献[10]修改 Fig. 8 Sea-ice mass-balance in the Arctic utilizing two-tracer(δ18O and d-excess)for three-component model. Modified from reference[10] |
基于以上证据我们对北极多年冰的融池有以下新的认识:融池冻结过程中,大气降水并未与海水充分混合,大气降水起源信号并未进入表层海洋;新的双同位素三端元混合模型表明除了雪被融化,在融池形成后新的降水补给也是融池的物质平衡中的补充来源。本研究建立的双同位素三端元物质平衡模型在北极降水增加的前景[74~75]下具有重要实用价值。
3.2 南极雪冰的研究南极浮冰中广泛存在的雪冰现象,对南极海冰的物质平衡起着至关重要的作用。Tian等[11]通过对2010年12月至2011年1月在Oden Southern Ocean 2010/11航次获得的阿蒙森海的8个海冰冰芯的稳定同位素组成、冰结构和盐度进行研究,揭示了雪 ̄冰的生长过程及其对海冰发展的贡献。同位素测试均在得克萨斯大学圣安东尼奥分校地质系的液态水同位素分析仪(Picarro L2140-i water analyzer)上完成。
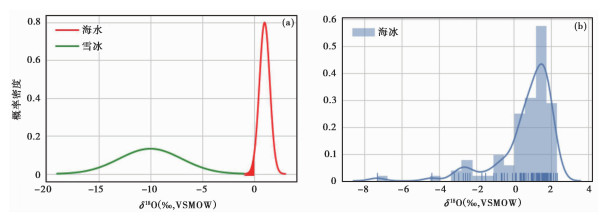
雪冰和海水起源样品同位素模拟分布(图 9a)具有双峰结构[11]:海水同位素分布具有较高的δ18O均值和较小的方差;而雪冰δ18O的均值较低且方差较大。然而阿蒙森海海冰样品同位素实际分布(图 9b)缺少雪冰δ18O的峰值,大量海冰样品δ18O值在-3 ‰和0 ‰之间,这表明雪冰和下覆冰层之间存在同位素的混合/扩散过程[11]。因此同位素混合模型相比同位素判别法,能给出更合理的雪冰在海冰质量平衡中的贡献比例。
|
图 9 雪冰和海水起源样品同位素模拟分布(a)和阿蒙森海海冰样品同位素实际分布(b) 据文献[11]修改 Fig. 9 Simulated distribution of typical isotope values for seawater and snow ice (a) and actual distribution of isotopic values for our sea-ice samples in the Amundsen Sea (b). Modified from reference[11] |
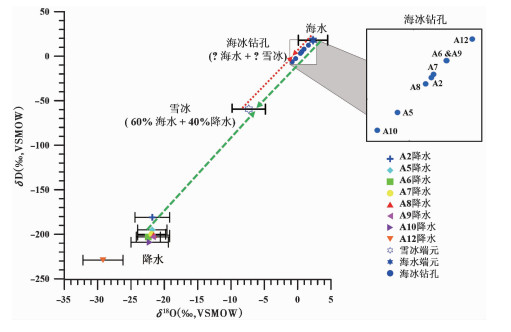
基于δ18O或δD的二元混合模型,利用IsoError混合模型计算采集冰芯中的雪冰贡献。同位素混合模型发现阿蒙森海浮冰的平均雪冰贡献比为16 %,而在雪冰质量中降水贡献比为40 % [11](图 10)。根据野外观测到的典型积雪-海水-雪冰密度和盐度,有研究推算得到降水应该在雪冰质量中占有30 % 到50 % 之间[76]。与以往研究相比,Tian等[11]的结果显示降水在雪冰中贡献比在不同钻孔中更为一致,且在过去研究推算的取值范围中值处,验证了同位素混合模型的有效性。但同位素混合模型求得的冰芯中雪冰贡献比(16 %)远低于过去研究在阿蒙森海的报道结果(36 %)[49],这是由于过去研究采用的同位素判别法会把混合层整体判断为雪冰层,从而高估雪冰贡献比(图 5c)。由于本研究获得的冰芯样本量较小,在未来的研究中,可以利用这种同位素混合模型对更多的南极冰芯进行检测。
|
图 10 利用δ18O建立的二元混合模型对南极海冰进行物质平衡划分 据文献[11]修改 Fig. 10 Sea-ice mass-balance in the Antarctic utilizing δ18O-tracer for two-component model. Modified from reference[11] |
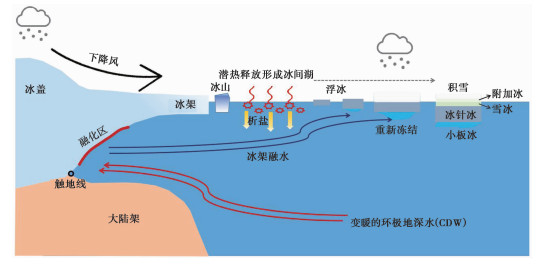
罗斯海海冰的主要组分和生成机制如图 11所示。罗斯冰架是世界上最大的冰架,并且在罗斯海域存在多个冰间湖(polynyas),表层水在罗斯海冰架下和冰间湖内下沉,成为南极底层水的主要来源之一[77]。罗斯海海域内的冰间湖是源自海水的冰针冰的主要产地[78],冰针冰的生成主要发生在秋季[79],来自南极冰盖的下降风(katabatic wind)对海冰生长起到促进生成[32]。在罗斯海海冰上部,是直接或间接来自降水形成的附加冰和雪冰[80]。特别需要注意的是在罗斯海海冰底部,来自冰架融水形成的小板冰也有重要贡献[81]。因此罗斯海各种起源的海冰类型齐全,通过多同位素多组分混合模型量化海冰的质量平衡,从而揭示罗斯海海冰异常变化的生长机制。
|
图 11 罗斯海海冰的主要组分和生成机制的概念模型 据文献[32]修改 Fig. 11 Conceptual models of major components and formation mechanisms of sea ice in the Ross Sea. Modified from reference[32] |
通过2017年PIPERS(Polynyas,Ice Production,and seasonal Evolution in the Ross Sea)航次采集的南极罗斯海的海冰、积雪、海水和冰架融水等水体样品的多同位素分析,本研究发展了针对罗斯海海冰目前质量平衡“三示踪四分量”同位素混合模型(图 6c),计算罗斯海海域不同位置海冰的质量平衡。同位素混合模型的三示踪同位素是δ18O或δD、d-excess和17O-excess,四分量对应着冰针冰、雪冰、小板冰和附加冰的贡献比例。后续工作将同时采用线性混合模型(IsoSource)和贝叶斯混合模型(MixSIAR)模型来计算各个组分贡献的误差范围,并比较不同混合模型的有效性。将结合PIPERS航次获得的大气、海洋和海冰的多种测试数据,与极地水体同位素历史数据和模拟结果对比,深入理解罗斯海海冰的生长过程及其异常变化的驱动因素。
4 结论本文通过对两极海冰质量平衡的研究背景综述,方法介绍和3个案例分析,得到的基本结论如下:
(1) 海冰在全球气候系统中扮演着重要角色。在全球变暖背景下,两极海冰范围呈现出相反的长期变化趋势,即北极海冰范围显著减少,南极海冰范围则略有增加。本文提出两极海冰的不对称变化可能与降水在两极海冰生消中起到的不同作用有关:在北极降水通过融池现象减少海冰生长,在南极积雪通过生成雪冰增加海冰生长。
(2) 降水在两极海冰质量平衡中贡献多大,可以通过同位素混合模型来厘定。因为海冰形成过程中的析盐作用,因此盐度和离子浓度无法作为示踪剂。δ18O和δD在极地不同水体中均存在共线性,因此只能两者取其一作为示踪同位素。对于单同位素和双同位素混合模型,本文推荐使用IsoError进行计算;对于多同位素混合模型推荐使用MixSIAR。
(3) 本文利用δ18O和d-excess建立两极海冰的同位素混合模型,量化了融池在北极海冰质量平衡中的贡献[10],和雪冰在南极海冰质量平衡中的贡献[11]。罗斯海是南极海冰增大最明显的区域,并且罗斯海各种起源的海冰类型齐全(冰针冰、雪冰、附加冰和小板冰),本研究提出17O-excess可以作为新的示踪同位素,从而量化罗斯海海冰质量平衡中四组分的贡献比,并进一步探究罗斯海海冰异常变化的生长机制。
致谢: 感谢审稿专家和编辑部杨美芳老师建设性的修改意见。
| [1] |
王朋岭, 黄磊, 巢清尘, 等. IPCC SROCC的主要结论和启示[J]. 气候变化研究进展, 2020, 16(2): 133-142. Wang Pengling, Huang Lei, Chao Qingchen, et al. The main content and insights of IPCC special report on the ocean and cryosphere in a changing climate(SROCC)[J]. Climate Change Research, 2020, 16(2): 133-142. |
| [2] |
秦大河, 周波涛, 效存德. 冰冻圈变化及其对中国气候的影响[J]. 气象学报, 2014, 72(5): 869-879. Qin Dahe, Zhou Botao, Xiao Cunde. Progress in studies of cryospheric changes and their impacts on climate of China[J]. Acta Meteorologica Sinica, 2014, 72(5): 869-879. |
| [3] |
李菲, 郜永祺, 万欣, 等. 全球变暖与地球"三极"气候变化[J]. 大气科学学报, 2021, 44(1): 1-11. Li Fei, Gao Yongqi, Wan Xin, et al. Earth's "three-poles" climate change under global warming[J]. Transactions of Atmospheric Sciences, 2021, 44(1): 1-11. |
| [4] |
杜德斌, 秦大河, 马亚华, 等. 冰冻圈地缘政治时代的到来[J]. 中国科学院院刊, 2020, 35(4): 514-522. Du Debin, Qin Dahe, Ma Yahua, et al. The age of cryopolitics is coming[J]. Bulletin of the Chinese Academy of Sciences, 2020, 35(4): 514-522. |
| [5] |
Laxon S W, Giles K A, Ridout A L, et al. CryoSat-2 estimates of Arctic sea ice thickness and volume[J]. Geophysical Research Letters, 2013, 40(4): 732-737. DOI:10.1002/grl.50193 |
| [6] |
Tschudi M A, Stroeve J C, Stewart J S. Relating the age of Arctic sea ice to its thickness, as measured during NASA's ICESat and IceBridge campaigns[J]. Remote Sensing, 2016, 8(6): 457. DOI:10.3390/rs8060457 |
| [7] |
Parkinson C L, DiGirolamo N E. New visualizations highlight new information on the contrasting Arctic and Antarctic sea-ice trends since the late 1970s[J]. Remote Sensing of Environment, 2016, 183: 198-204. DOI:10.1016/j.rse.2016.05.020 |
| [8] |
Parkinson C L. A 40-y record reveals gradual Antarctic sea ice increases followed by decreases at rates far exceeding the rates seen in the Arctic[J]. Proceedings of the National Academy of Sciences of the United States of America, 2019, 116(29): 14414-14423. DOI:10.1073/pnas.1906556116 |
| [9] |
Yuan N, Ding M, Ludescher J, et al. Increase of the Antarctic sea ice extent is highly significant only in the Ross Sea[J]. Scientific Reports, 2017, 7(1): 1-8. DOI:10.1038/s41598-016-0028-x |
| [10] |
Tian L, Gao Y, Ackley S F, et al. Stable isotope clues to the formation and evolution of refrozen melt ponds on Arctic sea ice[J]. Journal of Geophysical Research: Oceans, 2018, 123(12): 8887-8901. DOI:10.1029/2018JC013797 |
| [11] |
Tian L, Gao Y, Weissling B, et al. Snow-ice contribution to the structure of sea ice in the Amundsen Sea, Antarctica[J]. Annals of Glaciology, 2020, 61(82): 1-10. DOI:10.1017/aog.2020.55 |
| [12] |
Lange M A, Schlosser P, Ackley S F, et al. 18O concentrations in sea ice of the Weddell Sea, Antarctica[J]. Journal of Glaciology, 1990, 36(124): 315-323. DOI:10.3189/002214390793701291 |
| [13] |
Eicken H, Lange M A, Wadhams P. Characteristics and distribution patterns of snow and meteoric ice in the Weddell Sea and their contribution to the mass balance of sea ice[J]. Annales Geophysicae, 1994, 12: 80-93. DOI:10.1007/s00585-994-0080-x |
| [14] |
Jeffries M O, Shaw R A, Morris K, et al. Crystal structure, stable isotopes (δ18O), and development of sea ice in the Ross, Amundsen, and Bellingshausen seas, Antarctica[J]. Journal of Geophysical Research: Oceans, 1994, 99(C1): 985-995. DOI:10.1029/93JC02057 |
| [15] |
Bekryaev R V, Polyakov I V, Alexeev V A. Role of polar amplification in long-term surface air temperature variations and modern Arctic warming[J]. Journal of Climate, 2010, 23(14): 3888-3906. DOI:10.1175/2010JCLI3297.1 |
| [16] |
Dai A, Luo D, Song M, et al. Arctic amplification is caused by sea-ice loss under increasing CO2[J]. Nature Communications, 2019, 10(1): 1-13. DOI:10.1038/s41467-018-07882-8 |
| [17] |
Screen J A, Simmonds I. The central role of diminishing sea ice in recent Arctic temperature amplification[J]. Nature, 2010, 464(7293): 1334-1337. DOI:10.1038/nature09051 |
| [18] |
Carmack E C. The Arctic Ocean's freshwater budget: Sources, storage and export[M]//Lewis E L, Jones E P, Lemke P, et al. The Freshwater Budget of the Arctic Ocean. Dordrecht: Springer, 2000: 91-126.
|
| [19] |
Kopec B G, Feng X, Michel F A, et al. Influence of sea ice on Arctic precipitation[J]. Proceedings of the National Academy of Sciences of the United States of America, 2016, 113(1): 46-51. DOI:10.1073/pnas.1504633113 |
| [20] |
丁明虎, 肖王星, 效存德, 等. 东南极冰盖Lambert冰川流域300年来降雪记录[J]. 第四纪研究, 2017, 37(5): 1111-1118. Ding Minghu, Xiao Wangxing, Xiao Cunde, et al. The snowfall history of Lambert glacier basin during the past 300 years inferred from an ice core at LGB69, East Antarctica[J]. Quaternary Sciences, 2017, 37(5): 1111-1118. |
| [21] |
Francis J A, Vavrus S J. Evidence for a wavier jet stream in response to rapid Arctic warming[J]. Environmental Research Letters, 2015, 10(1): 014005. DOI:10.1088/1748-9326/10/1/014005 |
| [22] |
Routson C C, McKay N P, Kaufman D S, et al. Mid-latitude net precipitation decreased with Arctic warming during the Holocene[J]. Nature, 2019, 568(7750): 83-87. DOI:10.1038/s41586-019-1060-3 |
| [23] |
Tang Q, Zhang X, Yang X, et al. Cold winter extremes in northern continents linked to Arctic sea ice loss[J]. Environmental Research Letters, 2013, 8(1): 014036. DOI:10.1088/1748-9326/8/1/014036 |
| [24] |
Tang Q, Zhang X, Francis J A. Extreme summer weather in northern mid-latitudes linked to a vanishing cryosphere[J]. Nature Climate Change, 2014, 4(1): 45-50. DOI:10.1038/nclimate2065 |
| [25] |
Blackport R, Screen J A, van der Wiel K, et al. Minimal influence of reduced Arctic sea ice on coincident cold winters in mid-latitudes[J]. Nature Climate Change, 2019, 9(9): 697-704. DOI:10.1038/s41558-019-0551-4 |
| [26] |
Wang Z, Chen D. Polar climate system modeling in China: Recent progress and future challenges[J]. Science China: Earth Sciences, 2019, 62(7): 1076-1091. DOI:10.1007/s11430-018-9355-2 |
| [27] |
Roach L A, Dørr J, Holmes C R, et al. Antarctic sea ice area in CMIP 6[J]. Geophysical Research Letters, 2020, 47(9): e2019GL086729. |
| [28] |
Crosta X, Etourneau J, Orme L C, et al. Multi-decadal trends in Antarctic sea-ice extent driven by ENSO-SAM over the last 2, 000 years[J]. Nature Geoscience, 2021, 14(3): 156-160. DOI:10.1038/s41561-021-00697-1 |
| [29] |
刘骥平, 雷瑞波, 宋米荣, 等. 适应极地快速变化海冰模式的研发与挑战[J]. 大气科学学报, 2021, 44(1): 12-25. Liu Jiping, Lei Ruibo, Song Mirong, et al. Development and challenge of sea ice model adapting to rapid polar sea ice changes[J]. Transactions of Atmospheric Sciences, 2021, 44(1): 12-25. |
| [30] |
Massom R A, Stammerjohn S E. Antarctic sea ice change and variability-physical and ecological implications[J]. Polar Science, 2010, 4(2): 149-186. DOI:10.1016/j.polar.2010.05.001 |
| [31] |
Stammerjohn S, Massom R, Rind D, et al. Regions of rapid sea ice change: An inter-hemispheric seasonal comparison[J]. Geophysical Research Letters, 2012, 39(6): L06501. |
| [32] |
Ackley S F, Stammerjohn S, Maksym T, et al. Sea-ice production and air/ice/ocean/biogeochemistry interactions in the Ross Sea during the PIPERS 2017 autumn field campaign[J]. Annals of Glaciology, 2020, 61(82): 181-195. DOI:10.1017/aog.2020.31 |
| [33] |
Cornwall W. Scientists hope risky winter voyage yields icy rewards[J]. Science, 2017, 356(6335): 234-235. DOI:10.1126/science.356.6335.234 |
| [34] |
Steele M, Zhang J, Ermold W. Mechanisms of summertime upper Arctic Ocean warming and the effect on sea ice melt[J]. Journal of Geophysical Research: Oceans, 2010, 115: C11004. DOI:10.1029/2009JC005849 |
| [35] |
Steele M, Ermold W, Zhang J. Arctic Ocean surface warming trends over the past 100 years[J]. Geophysical Research Letters, 2008, 35(2): L02614. |
| [36] |
吴东, 刘焱光, Jón Eiríksson, 等. 3万年以来挪威海南部冰岛-苏格兰溢流变化及其对海冰活动的响应[J]. 第四纪研究, 2019, 39(4): 845-862. Wu Dong, Liu Yanguang, Jón Eiríksson, et al. Changes of Iceland-Scotland Overflow Water in southern Norwegian Sea and the responses to sea ice activities since 30 ka B. P[J]. Quaternary Sciences, 2019, 39(4): 845-862. |
| [37] |
Hu A, Rooth C, Bleck R, et al. NAO influence on sea ice extent in the Eurasian coastal region[J]. Geophysical Research Letters, 2002, 29(22): 101-104. DOI:10.1029/2001GL014293 |
| [38] |
Watanabe E, Wang J, Sumi A, et al. Arctic dipole anomaly and its contribution to sea ice export from the Arctic Ocean in the 20th century[J]. Geophysical Research Letters, 2006, 33(23): L23703. DOI:10.1029/2006GL028112 |
| [39] |
Ding Q, Schweiger A, L'Heureux M, et al. Influence of high-latitude atmospheric circulation changes on summertime Arctic sea ice[J]. Nature Climate Change, 2017, 7(4): 289-295. DOI:10.1038/nclimate3241 |
| [40] |
Eayrs C, Holland D, Francis D, et al. Understanding the seasonal cycle of Antarctic sea ice extent in the context of longer-term variability[J]. Reviews of Geophysics, 2019, 57(3): 1037-1064. DOI:10.1029/2018RG000631 |
| [41] |
Bintanja R, Van Oldenborgh G J, Drijfhout S S, et al. Important role for ocean warming and increased ice-shelf melt in Antarctic sea-ice expansion[J]. Nature Geoscience, 2013, 6(5): 376-379. DOI:10.1038/ngeo1767 |
| [42] |
Liu J, Curry J A. Accelerated warming of the Southern Ocean and its impacts on the hydrological cycle and sea ice[J]. Proceedings of the National Academy of Sciences of the United States of America, 2010, 107(34): 14987-14992. DOI:10.1073/pnas.1003336107 |
| [43] |
Ferreira D, Marshall J, Bitz C M, et al. Antarctic Ocean and sea ice response to ozone depletion: A two-time-scale problem[J]. Journal of Climate, 2015, 28(3): 1206-1226. DOI:10.1175/JCLI-D-14-00313.1 |
| [44] |
Polashenski C, Perovich D, Courville Z. The mechanisms of sea ice melt pond formation and evolution[J]. Journal of Geophysical Research: Oceans, 2012, 117: C01001. DOI:10.1029/2011JC007231 |
| [45] |
Xia W, Xie H, Ke C, et al. Summer surface albedo of sea ice in Pacific Arctic sector as measured during the CHINARE 2010 cruise[J]. Arctic, Antarctic, and Alpine Research, 2015, 47(4): 645-656. DOI:10.1657/AAAR0014-090 |
| [46] |
Holland M M, Bailey D A, Briegleb B P, et al. Improved sea ice shortwave radiation physics in CCSM 4:The impact of melt ponds and aerosols on Arctic sea ice[J]. Journal of Climate, 2012, 25(5): 1413-1430. DOI:10.1175/JCLI-D-11-00078.1 |
| [47] |
Hopkins M A, Thorndike A S. Floe formation in Arctic sea ice[J]. Journal of Geophysical Research: Oceans, 2006, 111: C11S23. DOI:10.1029/2005JC003352 |
| [48] |
Jeffries M O, Morris K, Weeks W F, et al. Seasonal variations in the properties and structural composition of sea ice and snow cover in the Bellingshausen and Amundsen Seas, Antarctica[J]. Journal of Glaciology, 1997, 43(143): 138-151. DOI:10.1017/S0022143000002902 |
| [49] |
Jeffries M O, Krouse H R, Hurst-Cushing B, et al. Snow-ice accretion and snow-cover depletion on Antarctic first-year sea-ice floes[J]. Annals of Glaciology, 2001, 33: 51-60. DOI:10.3189/172756401781818266 |
| [50] |
Weeks W F, Ackley S F. The growth, structure, and properties of sea ice[M]//Untersteiner N. The Geophysics of Sea Ice. Boston, MA: Springer, 1986: 9-164.
|
| [51] |
Barthold F K, Tyralla C, Schneider K, et al. How many tracers do we need for end member mixing analysis(EMMA)? A sensitivity analysis[J]. Water Resources Research, 2011, 47(8): W08519. |
| [52] |
Delsman J R, Essink G H P O, Beven K J, et al. Uncertainty estimation of end-member mixing using generalized likelihood uncertainty estimation(GLUE), applied in a lowland catchment[J]. Water Resources Research, 2013, 49(8): 4792-4806. DOI:10.1002/wrcr.20341 |
| [53] |
Dansgaard W. Stable isotopes in precipitation[J]. Tellus, 1964, 16(4): 436-468. DOI:10.3402/tellusa.v16i4.8993 |
| [54] |
Jouzel J, Vimeux F, Caillon N, et al. Magnitude of isotope/temperature scaling for interpretation of central Antarctic ice cores[J]. Journal of Geophysical Research: Atmospheres, 2003, 108(D12): 4361. DOI:10.1029/2002JD002677 |
| [55] |
Eicken H, Krouse H R, Kadko D, et al. Tracer studies of pathways and rates of meltwater transport through Arctic summer sea ice[J]. Journal of Geophysical Research: Oceans, 2002, 107(C10): 8046. DOI:10.1029/2000JC000583 |
| [56] |
Granskog M A, Røsel A, Dodd P A, et al. Snow contribution to first-year and second-year Arctic sea ice mass balance north of Svalbard[J]. Journal of Geophysical Research: Oceans, 2017, 122(3): 2539-2549. DOI:10.1002/2016JC012398 |
| [57] |
Cui J, An S, Wang Z, et al. Using deuterium excess to determine the sources of high-altitude precipitation: Implications in hydrological relations between sub-alpine forests and alpine meadows[J]. Journal of Hydrology, 2009, 373(1-2): 24-33. DOI:10.1016/j.jhydrol.2009.04.005 |
| [58] |
王圣杰, 张明军. 新疆天山降水稳定同位素的时空特征与影响因素[J]. 第四纪研究, 2017, 37(5): 1119-1130. Wang Shengjie, Zhang Mingjun. Spatio-temporal characteristics and influencing factors of stable isotopes in precipitation across the Chinese Tianshan Mountains[J]. Quaternary Sciences, 2017, 37(5): 1119-1130. |
| [59] |
田立德, 姚檀栋, 余武生, 等. 青藏高原水汽输送与冰芯中稳定同位素记录[J]. 第四纪研究, 2006, 26(2): 145-152. Tian Lide, Yao Tandong, Yu Wusheng, et al. Stable isotopes of precipitation and ice core on the Tibetan Plateau and moisture transports[J]. Quaternary Sciences, 2006, 26(2): 145-152. DOI:10.3321/j.issn:1001-7410.2006.02.001 |
| [60] |
Stenni B, Masson-Delmotte V, Selmo E, et al. The deuterium excess records of EPICA Dome C and Dronning Maud Land ice cores(East Antarctica)[J]. Quaternary Science Reviews, 2010, 29(1-2): 146-159. DOI:10.1016/j.quascirev.2009.10.009 |
| [61] |
Klein E S, Welker J M. Influence of sea ice on ocean water vapor isotopes and Greenland ice core records[J]. Geophysical Research Letters, 2016, 43(24): 12475-12483. |
| [62] |
Kopec B G, Feng X, Posmentier E S, et al. Seasonal deuterium excess variations of precipitation at Summit, Greenland, and their climatological significance[J]. Journal of Geophysical Research: Atmospheres, 2019, 124(1): 72-91. DOI:10.1029/2018JD028750 |
| [63] |
Luz B, Barkan E. Variations of 17O/16O and 18O/16O in meteoric waters[J]. Geochimica et Cosmochimica Acta, 2010, 74(22): 6276-6286. DOI:10.1016/j.gca.2010.08.016 |
| [64] |
Risi C, Landais A, Bony S, et al. Understanding the 17O excess glacial-interglacial variations in Vostok precipitation[J]. Journal of Geophysical Research: Atmospheres, 2010, 115: D10112. DOI:10.1029/2008JD011535 |
| [65] |
Landais A, Risi C, Bony S, et al. Combined measurements of 17Oexcess and d-excess in African monsoon precipitation: Implications for evaluating convective parameterizations[J]. Earth and Planetary Science Letters, 2010, 298(1-2): 104-112. DOI:10.1016/j.epsl.2010.07.033 |
| [66] |
Pang H, Hou S, Landais A, et al. Spatial distribution of 17O-excess in surface snow along a traverse from Zhongshan station to Dome A, East Antarctica[J]. Earth and Planetary Science Letters, 2015, 414: 126-133. DOI:10.1016/j.epsl.2015.01.014 |
| [67] |
Pang H, Hou S, Landais A, et al. Influence of summer sublimation on δD, δ18O, and δ17O in precipitation, East Antarctica, and implications for climate reconstruction from ice cores[J]. Journal of Geophysical Research: Atmospheres, 2019, 124(13): 7339-7358. |
| [68] |
Jackson A L, Inger R, Bearhop S, et al. Erroneous behaviour of MixSIR, a recently published Bayesian isotope mixing model: A discussion of Moore & Semmens(2008)[J]. Ecology Letters, 2009, 12(3): E1-E5. DOI:10.1111/j.1461-0248.2008.01233.x |
| [69] |
Phillips D L, Gregg J W. Uncertainty in source partitioning using stable isotopes[J]. Oecologia, 2001, 127(2): 171-179. DOI:10.1007/s004420000578 |
| [70] |
Phillips D L, Gregg J W. Source partitioning using stable isotopes: Coping with too many sources[J]. Oecologia, 2003, 136(2): 261-269. DOI:10.1007/s00442-003-1218-3 |
| [71] |
Parnell A C, Inger R, Bearhop S, et al. Source partitioning using stable isotopes: Coping with too much variation[J]. PloS One, 2010, 5(3): e9672. DOI:10.1371/journal.pone.0009672 |
| [72] |
Moore J W, Semmens B X. Incorporating uncertainty and prior information into stable isotope mixing models[J]. Ecology Letters, 2008, 11(5): 470-480. DOI:10.1111/j.1461-0248.2008.01163.x |
| [73] |
Stock B C, Jackson A L, Ward E J, et al. Analyzing mixing systems using a new generation of Bayesian tracer mixing models[J]. PeerJ, 2018, 6(4): e5096. DOI:10.7717/peerj.5096 |
| [74] |
Dou T, Xiao C, Liu J, et al. A key factor initiating surface ablation of Arctic sea ice: Earlier and increasing liquid precipitation[J]. The Cryosphere, 2019, 13(4): 1233-1246. DOI:10.5194/tc-13-1233-2019 |
| [75] |
Dou T, Xiao C, Liu J, et al. Trends and spatial variation in rain-on-snow events over the Arctic Ocean during the early melt season[J]. The Cryosphere, 2021, 15(2): 883-895. DOI:10.5194/tc-15-883-2021 |
| [76] |
Maksym T, Markus T. Antarctic sea ice thickness and snow-to-ice conversion from atmospheric reanalysis and passive microwave snow depth[J]. Journal of Geophysical Research: Oceans, 2008, 113: C02S12. DOI:10.1029/2006JC004085 |
| [77] |
Silvano A, Foppert A, Rintoul S R, et al. Recent recovery of Antarctic bottom water formation in the Ross Sea driven by climate anomalies[J]. Nature Geoscience, 2020, 13(12): 780-786. DOI:10.1038/s41561-020-00655-3 |
| [78] |
Drucker R, Martin S, Kwok R. Sea ice production and export from coastal polynyas in the Weddell and Ross Seas[J]. Geophysical Research Letters, 2011, 38(17): L17502. |
| [79] |
Comiso J C, Kwok R, Martin S, et al. Variability and trends in sea ice extent and ice production in the Ross Sea[J]. Journal of Geophysical Research: Oceans, 2011, 116: C04021. DOI:10.1029/2010JC006391 |
| [80] |
Kawamura T, Jeffries M O, Tison J L, et al. Superimposed-ice formation in summer on Ross Sea pack-ice floes[J]. Annals of Glaciology, 2004, 39: 563-568. DOI:10.3189/172756404781814168 |
| [81] |
Buffo J J, Schmidt B E, Huber C. Multiphase reactive transport and platelet ice accretion in the sea ice of McMurdo Sound, Antarctica[J]. Journal of Geophysical Research: Oceans, 2018, 123(1): 324-345. DOI:10.1002/2017JC013345 |
2 Center for Advanced Measurements in Extreme Environments, University of Texas at San Antonio, San Antonio 78249, USA;
3 Center for Excellence in Life and Paleoenvironment, CAS, Beijing 100044;
4 University of Chinese Academy of Sciences, Beijing 100049)
Abstract
Sea ice is one of the determining parameters of the climate system. In the context of global warming, sea ice extents in the Arctic and Antarctic displayed diverging long-term trends: the Arctic sea ice extent shrunk significantly, while Antarctic sea ice extent increased slightly. However, the driving mechanism for the asymmetrical changes in polar sea ice is not fully understood. Most studies on sea-ice changes have focused on its interaction with temperature, but little is known about the role of precipitation in the processes of sea-ice growth and melt. We found the asymmetrical changes of polar sea ice may be related to the different roles of precipitation: precipitation plays a role in promoting sea-ice melting in the Arctic, while promoting sea-ice accretion in the Antarctic. In this study, the different characteristics of isotope discrimination method, linear mixing model and Bayesian mixing model and their advantages and disadvantages in the applications are compared in detail. The precipitation contribution in the mass balance of polar sea ice could be determined based on stable-isotope tracers. In this study, we compared the different characteristics of the isotopic discriminant method, linear mixing model, and Bayesian mixing model and their advantages and disadvantages in the application. We used oxygen isotope(δ18O) and deuterium excess(d-excess) to build the isotope mixing model, and we quantified the contribution of melt pond to the mass balance of Arctic sea ice and snow ice to the mass balance of Antarctic sea ice. The most significant contribution of sea ice increase in the Antarctic is from the Ross Sea, and the Ross Sea has a full range of sea ice types with different origins(frazil ice, snow ice, superimposed ice, and platelet ice). We propose that triple oxygen isotope(17O-excess) could be utilized as a new tracer to quantify the contribution ratios of four components of sea ice in the Ross Sea, and then further explore the growth mechanism of sea ice anomalies in the Ross Sea, Antarctica. 2021, Vol.41
