 2021, Vol.41


在全球气候变暖大背景下,南极地区作为全球天气和气候变化的放大器和驱动器之一,其自身气候对全球大气环流、热量平衡以及气候演变产生了极为重要的影响,已成为世界各国学者的研究重点之一[1~4]。近几十年来,作为南极大陆最重要的气象要素之一的近地面气温发生了剧烈变化,深刻影响了南极冰盖能量平衡变化、物质平衡变化及对全球海平面的贡献,以及其周围地区的生态系统等方面[5~7]。
自1957/1958国际地球物理年(International Geophysical Year,简称IGY)以来,建立了许多人工气象观测站,不过这些气象站多位于沿海地区。缺少对南极内陆地区的温度记录数据,对于分析和研究南极内陆地区近地面气温带来了极大困难。自动气象站(Automatic Weather Station,简称AWS)可以实现在偏远地区和气候恶劣地区的长期无人检测,在过去20年间,超过100个AWS安装在南极大陆不同地区,用于补充观测南极大陆不同区域气候变化[8~9],其中大多数(≈90 %)位于东南极冰盖[10]。然而,这些自动气象站往往无法定期检修,增加了因仪器故障或电力短缺而丢失数据的可能性,再加上受南极恶劣的气候条件下耗资巨大的后勤保障限制,AWS缺乏长时间连续的温度观测数据,并且气象站点空间分布很不均匀,这对评估南极地区近地面气温时空变化带来了很大的挑战。尽管这些气象观测数据的限制,但是为研究南极地区气候变化趋势,已有大量研究利用气象站观测资料获取南极近地面气温信息[11~18]。这些研究基本一致发现近50年来南极半岛和西南极冰盖表现出前所未有的变暖趋势,是全球变暖最快的地区之一,而东南极冰盖没有呈现明显的气温变化趋势[19~23]。
对于气象站点比较缺乏的地区而言,再分析资料被认为是十分重要的替代产品。通过数据同化系统和天气预报模型,再分析资料可以在空间和时间上提供连续的大气参数信息。早期的欧洲中期天气预报中心(European Center for Medium Range Weather Forecasting,简称ECMWF)和美国国家环境预测中心/国家大气研究中心(National Centers for Environmental Prediction/National Center for Atmospheric Research,简称NCEP/NCAR)再分析资料(如ERA-15、ERA-40、NCEP1等)可用于南极气候变化评估,然而其可信度有限,如气温资料在1979年之前和之后存在较大数量上的差异。近年来,随着计算能力加强、数据同化技术提高和观测数据增多,再分析资料精度明显提高[24~25]。自2008年以来,新的再分析资料产品相继问世,主要包括:ECMWF更新的再分析资料(ERA-Interim)、NCEP再分析资料(CFSR)、美国国家航空航天局(NASA)的再分析资料(MERRA)以及日本气象厅(Japan Meteorological Agency,简称JMA)55年再分析资料(JRA-55)。尤其是最近,第二代NASA再分析资料(MERRA-2)和第五代ECMWF再分析资料(ERA5)的发布,引起了极大关注[26~28],可用于观测数据匮乏的极地地区气候变化评估。
再分析资料质量深受同化观测数据的数量影响,对于南极地区来说,质量较好的再分析资料时间跨度集中在1979年现代卫星数据被同化之后[29~31]。尽管已有再分析资料时间长度超过100年,但是由于数据质量不稳定致使其不适用于研究南极气候长期变化趋势分析[32~33]。针对此,近年来,开展了许多南极气候重建研究工作:如利用卫星地表温度数据作为背景场重建过去50年南极地区近地面气温[34];通过冰芯稳定同位素记录恢复过去长时间尺度气温变化[35~37];根据冰芯钻孔温度测量反演南极区域气温变化[38~40]。
由于气温重建过程中所使用的数据集不同,其重建结果所体现的南极近地面气温时空尺度也往往不相同[41~43]。冰芯稳定同位素记录或钻孔温度测量往往仅能反映有限区域的气温变化,此外,稳定同位素记录也受水汽来源及传输过程的影响[35~37];钻孔温度受冰层结构和内部运动的影响[38~40];使用可见光卫星地表温度数据集虽然覆盖范围广泛,但受天气影响较为严重,仅在晴空条件下有效[34]。再分析数据集,往往时间序列太短,且容易出现虚假趋势。与传统的重建方法相比,将实测气象站点数据与再分析数据集相结合使用,充分利用气温观测时间和再分析资料空间连续优势,可以更好地体现时空变化格局特征,是弥补观测数据不足以重建大空间尺度气温变化的一种有效手段[21, 34]。通过气象站实测数据可以真实地刻画南极大陆气温变化,以再分析资料作为时空温度协方差背景场,可以弥补气象站空间分布不均匀问题;并且空间插值方法可以利用有限的观测数据估算广大非站点分布区域的气温,克里格插值法通过使用模型字段来建立空间联系,从而有可能更好地降低局部环境因素对近地面气温的影响[34]。
本文利用85个南极气象站气温实测数据和三套再分析资料产品,使用克里格插值法重建1960~2019年南极近地面气温时空数据集,通过相关系数(correlation coefficient,简称r)、均方根误差(root-mean-square error,简称RMSE)两个指标对三套重建数据集的精度进行评估验证,选择最优重建产品研究过去60年来南极冰盖近地面气温时空变化。
2 数据与方法 2.1 数据来源 2.1.1 气象观测数据本研究利用自1957/1958国际地球物理年(IGY)以来持续观测至少15年的台站气温数据,包括53个人工气象站和32个自动气象站,其中Byrd气象站数据来源于Bromwich等[44~45]的重建结果,其他来源于美国威斯康星大学南极气象研究中心(Antarctic Meteorological Research Center,简称AMRC)南极自动气象站项目(Antarctic AWS Project)、英国南极调查局南极研究科学委员会(Scientific Committee on Antarctic Research,简称SCAR;the British Antarctic Survey,简称BAS)南极环境研究参考数据库(Reference Antarctic Data for Environmental Research,简称READER)、意大利南极研究项目(Italian Antarctic Research Programme)、乌得勒支大学海洋和大气研究所(Institute for Marine and Atmospheric Research,Utrecht University)南极自动气象站项目数据库(Antarctic AWS Project)。其中15个时间序列最长且连续的人工气象站气温数据,作为重建空间内插的基础数据(图 1);其余的70个气象站点中,38个人工气象站和32个自动气象站作为重建气温结果精度验证的数据来源。气象站点详细信息见表 1。

|
图 1 南极冰盖85个气象站点位置图 Fig. 1 Spatial distribution of 85 weather stations |
| 表 1 南极冰盖85个气象站点信息 Table 1 Main information of 85 weather stations. The number of each station is presented in Fig. 1 |
本文选取高分辨率和精度相对较高的CFSR、ERA5和MERRA-2这三套再分析资料2m气温作为重建气温数据集的背景场,其中CFSR是美国国家环境预报中心(NCEP)利用全球预报系统(Global Forecast System)结合三维变分数据同化系统生产的全球再分析数据产品,ERA5是欧洲中期天气预报中心(ECMWF)第五代再分析产品,MERRA-2是美国国家航空航天局(NASA)全球模拟与同化办公室推出的高分辨率全球再分析资料。以上资料的详细信息见表 2。
| 表 2 再分析资料数据信息 Table 2 Characteristics of reanalysis products used in this study |
利用15个南极人工气象站每月气温观测值,通过克里格插值方法来估算非站点的气温数据,从而获得连续空间上的气温数据。以15个站点月气温观测结果为基础,这些站点气温和南极大陆其余部分气温之间的空间关系是通过CFSR、ERA5和MERRA-2再分析资料估计,即以这3个再分析资料作为时空协方差背景场。克里格插值方法用协方差函数和变异函数来确定高程变量随空间距离而变化的规律,以距离为自变量的变异函数,计算相邻高程值关系权重值,在有限区域内对区域化变量进行无偏最优估计[46]。针对本研究站点稀少,而南极冰盖面积大的特点,本研究计算权重应用站点所在位置的再分析资料气温值与其他格点的相关系数计算。计算公式如下:对于包含n个样本的克里格插值法的统计模型[21, 34]:
|
(1) |
|
(2) |
其中,ΔZ(i,j)为待预测位置(i,j)的气温预测值,zk为已知气象站位置k的气温观测值,N为空间内插所使用气象站点的个数(N=15),ai,j,k为气温相关性符号,λi,j,k为待定权重系数,λi,j,k是利用1980~2019年站点所在格点的再分析资料2m气温序列与其他格点结果的相关系数计算而来,公式如下:
|
(3) |
|
(4) |
其中,ri,j,k2是站点所在格点处再分析资料的2m气温序列与第k个格点结果的皮尔逊相关系数。
2.2.2 南极冰盖近地面气温重建评估方法借助于未参与近地面气温重建的70个站点气温观测数据对近地面气温重建数据集精度进行独立验证,利用相关系数(r)、均方根误差(RMSE)这2个指标来分析比较重建结果与实测结果的差异。两种评估方法的公式及意义如下:
r能够反映实测值与重建值在时间上的相关性[47],对于包含n个样本的时间相关系数r定义如下:
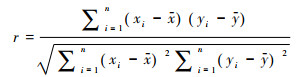
|
(5) |
RMSE能够反映重建值相对于实测值的偏离程度和离散程度[48],对于包含n个样本的RMSE定义如下:
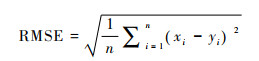
|
(6) |
公式(5)和(6)中,xi和yi分别表示在人工气象站处的观测值和重建值;x和y分别表示人工气象站处观测值的均值和重建值的均值,

利用70个验证气象站点的地理经纬度,将重建数据集中相应格网的气温提取出来,分别计算各站近地面年平均和月平均气温的r(包含70个样本)、RMSE、验证年尺度以及月尺度平均气温的重建精度(表 3和图 2)。
| 表 3 3个重建产品精度验证信息 Table 3 Overall skill statistics of the three Antarctic near-surface air temperature reconstructions |

|
图 2 月近地面气温重建产品精度评估(r和RMSE) Fig. 2 The accuracy of monthly averaged near-surface air temperature reconstruction products (correlation coefficients (r) and root-mean-square error(RMSE)) |
从表 3可以得出,70个气象站点年平均气温与利用ERA5重建的气温产品(RECONERA5)对应格点的年平均气温相关系数为0.70,相关性最强,且均方根误差为0.49℃,整体误差值最小,两者吻合性较好,RECONERA5重建结果的精度最高。RECONERA5月气温重建结果与70个气象站观测值的相关系数和均方根误差波动范围分别为0.60~0.74、0.44~0.59℃,其中,8月份的重建结果最好,相关性最高,均方根误差最小。12月份的重建结果稍差,相关系数最低,均方根误差最大(图 2)。总体而言,RECONERA5各月重建值与观测值的相关性都很高,而且均方根误差都很小,重建结果较为理想。
3.2 1960~2019年南极冰盖近地面气温时空变化特征 3.2.1 南极冰盖近地面气温时间变化为了从区域尺度上分析1960~2019年南极冰盖近地面气温变化,利用RECONERA5重建数据集分别计算了南极半岛、西南极冰盖和东南极冰盖的年和季节平均气温距平序列,采用了5年滑动平均法对数据进行了处理,使其随时间变化的趋势和方向更加明显(图 3)。基于最小二乘法计算了各区域年和季节近地面平均气温线性变化的趋势值(表 4)。

|
图 3 1960~2019年南极半岛及东、西南极冰盖近地面年(a)和季节平均气温年际变化(b:秋季,c:冬季,d:春季,e:夏季) Fig. 3 Time series of annual (a)and seasonal (b: autumn, c: winter, d: spring, e: summer)mean near-surface air temperature times, spatially averaged over the Antarctic Peninsula, East Antarctic Ice Sheet and West Antarctic Ice Sheet during 1960~2019 |
| 表 4 不同时期南极冰盖3个区域近地面气温变化(℃/10年) 线性趋势值(粗体表示趋势在95 % 的置信水平下显著) Table 4 Near-surface air temperature linear trends(℃/decade)for three Antarctic sub-regions during the different periods. Boldface denotes trends statistically significant at the 95 % confidence level |
1960~2019年南极冰盖3个区域年平均近地面气温年际变化均较大,但是其都呈现变暖趋势,重建结果再现了有据可查的南极半岛快速升温[15, 19],就年平均气温而言,南极半岛和西南极冰盖表现出显著的强变暖趋势(升温幅度分别为0.31℃/10年和0.11℃/10年,P < 0.05),东南极冰盖呈现出0.06℃/10年微弱但不显著的升温趋势,这与Nicolas和Bromwich[21]重建的1958~2012年温度趋势结果非常相似。1960~1998年南极冰盖3个区域年平均气温年际变化趋势方向与1960~2019年的结果一致,不过变化趋势数量上稍有差异:西南极冰盖略微增加,而东南极冰盖略微降低。1999~2019年南极冰盖3个区域年平均近地面气温年际变化同样很大,但其变化趋势不一致,南极半岛呈现0.16℃/10年的降温趋势,西南极冰盖也出现降温,但是其趋势值较小,仅为0.024℃/10年,而东南极冰盖呈现了0.28℃/10年升温趋势。
从季节变化来看,1960~2019年东南极冰盖秋季表现出0.002℃/10年的微弱降温趋势,但是南极半岛和西南极冰盖均呈现不同程度的升温趋势,这与Nicolas和Bromwich[21]的重建结果较吻合。秋季、冬季和夏季,南极半岛的升温幅度最大(分别为0.48℃/10年、0.36℃/10年和0.22℃/10年,p>0.05)。然而,春季,西南极冰盖升温幅度(0.25℃/10年,P < 0.05)较南极半岛更大(0.20℃/10年),这与Steig等[16]的研究结果相一致,而且东南极冰盖也出现显著增温趋势(0.17℃/10年,P < 0.05)。
南极冰盖3个区域年平均和季节平均气温在1960~1998年和1999~2019年两个时段变化差异显著。1999~2019年,南极半岛和西南极冰盖降温,东南极冰盖明显增温,且春季表现尤为突出。春季,整个东南极冰盖在1960~1998年间气温变化并不显著,但在1999~2019年表现出0.51℃/10年的增温趋势,南极半岛和西南极冰盖已分别从1960~1998年的0.03℃/10年、0.20℃/10年的升温趋势转变为1999~2019年的-0.52℃/10年、-0.43℃/10年的降温趋势,气温变化与年均气温变化趋势方向一致,不同的是,季节气温变化幅度远大于年平均气温。夏季,与1960~1998年相比,南极半岛在1999~2019年仍表现较为显著的降温趋势,而西南极冰盖和东南极冰盖呈现出升温趋势,且东南极冰盖的升温幅度明显大于西南极冰盖。秋季,1960~1998年南极半岛呈现出非常显著的增温趋势(0.50℃/10年、P < 0.05),而1999~2019年增温减缓,温度变化趋势极其微弱。冬季,1999~2019年东南极冰盖气温变化与年均气温变化趋势方向相反,即由1960~1998年的0.15℃/10年的升温趋势转变为1998~2019年的-0.06℃/10年的降温趋势。
3.2.2 南极冰盖近地面气温变化的空间差异利用0.25°×0.25°分辨率RECONERA5数据集,通过最小二乘法,分别计算出1960~2019年(图 4)、1960~1998年(图 5)和1999~2019年(图 6)南极冰盖近地面年平均和季节平均气温变化趋势空间分布情况。它们反映了南极冰盖近地面气温受大尺度天气系统以及局部地形影响,产生明显的年际变化和地带性特征。

|
图 4 1960~2019年南极冰盖近地面年平均(a)和季节平均(b:秋季,c:冬季,d:春季,e:夏季)气温变化趋势空间分布 黑色线圈定的范围是趋势值置信度超过95 % 的区域 Fig. 4 Spatial distribution of trends in the annual (a) and seasonal(b: autumn, c: winter, d: spring, e: summer)averaged near-surface temperature for the 1960~2019 period.The thick solid black line outlines the areas with trends significant at the 95 % confidence level |

|
图 5 1960~1998年南极冰盖近地面年平均(a)和季节平均(b:秋季,c:冬季,d:春季,e:夏季)气温变化趋势空间分布 黑色线圈定的范围是趋势值置信度超过95 % 的区域 Fig. 5 Spatial distribution of trends in the annual (a) and seasonal(b: autumn, c: winter, d: spring, e: summer)averaged near-surface temperature for the 1960~1998 period.The thick solid black line outlines the areas with trends significant at the 95 % confidence level.The thick solid black line outlines the areas with trends significant at the 95 % confidence level. |

|
图 6 1999~2019南极冰盖近地面年平均(a)和季节平均(b:秋季,c:冬季,d:春季,e:夏季)气温变化趋势空间分布 黑色线圈定的范围是趋势值置信度超过95 % 的区域 Fig. 6 Spatial distribution of trends in the annual (a) and seasonal(b: autumn, c: winter, d: spring, e: summer)averaged near-surface temperature for the 1999~2019 period.The thick solid black line outlines the areas with trends significant at the 95 %confidence level. The thick solid black line outlines areas with trends significant at the 95 % confidence level |
1960~2019年,南极半岛、西南极冰盖和东南极冰盖大部分地区年平均气温呈现出不同程度的升温趋势(图 4),这与大多数南极气温评估中出现的“暖半岛-冷大陆”温度趋势形成鲜明对比[35],而且与已有重建不同的是显著变暖延伸到60°~180°E的东南极内陆大部分区域[21]。其中,南极半岛、埃尔斯沃思地、罗斯冰架、罗斯海沿岸、麦克默多干谷、维多利亚地以及南极高原40°W~160°E部分地区增温最明显(>0.2℃/10年,P < 0.05),而东南极冰盖30°W~5°E范围的科茨地到毛德皇后地区域呈现出微弱的降温趋势。
对比图 5和6发现,1960~1998年南极冰盖近地面年平均气温变化趋势空间格局与1960~2019年的结果基本一致,但是其显著变暖区域更小,仅仅出现在南极半岛和西南极冰盖的东部区域。
与1960~1998年相比,1999~2019年南极冰盖年平均气温变化趋势空间分布差异显著。南极半岛、埃尔斯沃思地、玛丽伯德地、伊丽莎白地、玛丽皇后地以及威尔考斯地呈现不同程度的降温趋势。然而,南极点附近80°~90°S的范围内则呈现出显著的增暖趋势(>0.4℃/10年,P < 0.05),同时东南极冰盖30°W~5°E范围的科茨地到毛德皇后地区域也表现出幅度较大的升温趋势(>0.3℃/10年)。
1960~2019年,南极冰盖近地面季节平均气温变化趋势也呈现出明显的空间差异性(图 4b、4c、4d和4e)。整体上,春季与年平均气温变化趋势空间分布比较一致,正如Schneider等[49]所强调的西南极冰盖和东南极冰盖最显著变暖发生在南半球春季,而南极半岛并非如此。冬季,南极半岛、西南极冰盖大部分地区以及南极高原、恩德比地、伊丽莎白地和玛丽皇后地均呈现增温趋势,特别是南极半岛、埃尔斯沃思地和埃茨海岸增温趋势是显著的(>0.2℃/10年,P < 0.05),而玛丽伯德地、30°W~5°E范围的科茨地到毛德皇后地区域、奥茨海岸地、乔治五世地以及威尔考斯地呈现出降温趋势。南极半岛夏季、秋季与冬季表现出一致的升温趋势,秋季,奥茨海岸地、乔治五世地呈现出的降温趋势更加明显,达0.2℃/10年以上(P < 0.05)。
1960~1998年,南极冰盖近地面季节平均气温变化趋势与1960~2019年相比略有不同。春季,南极半岛北部小部分区域以及60°W~0°E扇区内大部分区域呈现出不显著的降温趋势,西南极半岛尤其是玛丽伯德地升温幅度明显增大(>0.2℃/10年)。冬季,整个南极冰盖呈现普遍增温趋势。秋季,东南极冰盖30°W~5°E范围的科茨地到毛德皇后地区域降温趋势更加显著(>0.2℃/10年,P < 0.05)。夏季,南极半岛则呈现出0.4℃/10年(P < 0.05)更为显著的升温趋势。
1999~2019年,南极冰盖近地面季节平均气温变化趋势表现出的空间差异性更加显著(图 6b、6c、6d和6e)。春季,气温变幅对比最为明显,南极半岛和西南极冰盖呈现明显降温趋势,东南极冰盖呈现明显升温趋势,其中南极点附近80°~90°S范围内的升温幅度超过了0.6℃/10年(P < 0.05),玛丽伯德地降温趋势最为显著,超过了0.8℃/10年(P < 0.05)。夏季,除南极半岛和埃尔斯沃思地外,其余地区均发生了不同程度的变暖趋势。秋季,南极半岛、玛丽伯德地、伊丽莎白地和玛丽皇后地均出现降温趋势,而科茨地、毛德皇后地、南极点附近80°~90°S范围内、威尔克斯地及奥茨地升温趋势是较为明显。与秋季相反,冬季,南极半岛呈现升温趋势,而科茨地、毛德皇后地、威尔克斯地及奥茨地则为幅度较大的降温趋势。
4 讨论精度验证结果表明,基于CFSR、ERA5和MERRA-2再分析资料重建的三套数据集精度都较为理性,其均方根误差均小于0.6℃,说明在克里格插值法参数设定上以相关系数作为权重方案是合理的。与使用距离作为权重的方法相比,用再分析资料格点序列的相关性为克里格插值的权重系数考虑了地形与大气环流对气温时空变化的影响,更适用于南极冰盖近地面气温重建[21]。
相比较而言,RECONERA5数据集精度最高,对该数据集的分析表明,1960~1998年南极半岛呈显著变暖趋势,而且主要发生在南半球夏秋两季,但是自1999年以来,南极半岛变暖趋势转为降温趋势,尤其在夏季更显著。这与南极半岛6个站点资料合成分析所得结果比较一致[23]。1960~1998年南极半岛夏秋季显著增温,可能主要因为夏秋季节,南极大陆上空平流层臭氧耗竭和温室气体浓度增加,导致南半球对流层西风增加[50],进而影响南半球环状膜(SAM)向正位相趋势发展,使得南极绕极风增强,导致更多的暖空气向南极半岛输送,从而导致南极半岛增温[51~54]。1999~2019年夏季显著降温,可能得益于臭氧耗损减弱,臭氧空洞的暂时稳定改变了南极半岛上空的风力模式,暂时缓解了温室气体变暖影响[50~51];大气环流的变化促进了近海冷的对流层流动,从而导致南极半岛的进一步降温;同时,海冰变化也起着至关重要的作用,较强的中纬度急流将冷空气吹向南极半岛,威德尔海海冰增加并向南极半岛推进,进一步扩大了降温范围[51]。同样,1960~1998年西南极冰盖也经历了变暖,但主要发生在冬春季。尽管SAM是南半球热带外大气环流的主要模态,其变率在多个时间尺度上对南极气温变化产生重要影响,但是具有明显的季节性,主要是夏秋季SAM起作用。与SAM相比,西南极冰盖对热带太平洋海表温度(SST)异常更敏感[55],SST正异常产生的大气罗斯波列影响阿蒙森海上空大气环流变化,致使暖空气深入西南极内陆。1999~2019年西南极冰盖春季降温趋势,可能与热带太平洋东部海域SST降低有关[56]。1960~1998年东南极冰盖气温变化不显著,但是1999年后南极点附近的南极内陆区域显著增暖,这主要是因为进入21世纪西太平洋SST增加强烈引起中纬度急流进而致使威德尔海区域气旋异常,大气环流异常伴随着SAM正位相趋势,驱动南大西洋上空温暖空气吹向南极内陆引起升温[57]。虽然中纬度急流在一年中的大部分时间都很强,但在夏季较弱,产生较少的气旋,热带强迫在南极半岛气候变化中扮演很小的角色[51~52]。
综上,过去60年来不同时段的南极冰盖近地面气温变化深受热带SST异常、SAM等自然变化的影响,但是臭氧消耗、温室气体排放等人为因素的作用也不能忽视,主要取决于温室气体以及平流层臭氧等变化对南半球大气环流模式和南极海冰等的影响程度。臭氧减少通过影响地球辐射平衡和改变环流模式两方面作用于南极地区的降温[58~60]。臭氧减少引起辐射扰动增大,通过减少短波辐射的吸收,可造成极低平流层冷却,从而影响平流层的大气环流及输送过程,则会产生使地面气温下降的动力[61~62]。一种推论认为,平流层臭氧消耗通过改变低层对流层热波通量来影响SAM[62];另一种推论认为,平流层臭氧消耗通过影响平流层低层气流强度和对流层顶水平动量波通量而影响SAM[62]。同时,南极臭氧层的消耗和温室气体的增加都促成了SAM的转变,由于SAM伴随着极地地区的热间接垂直运动,其正位相趋势也有利于东南极大部分地区的冷却[50, 63~64],从而引起南极地区气候的变化。由于气候系统内部变化的复杂性,加上太阳活动、火山爆发等自然强迫因素也会影响南极大气振荡进而引起南极地区气温变化[65],对于南极冰盖近地面气温时空变化的成因机制探讨,仍需进一步加强。
5 结论本研究以再分析资料为背景场,利用克里格插值方法,结合气象站气温观测资料,重建了三套1960~2019年南极冰盖近地面月气温时空数据集。在此基础上,利用精度最高的RECONERA5数据集分析了过去60年来冰盖气温时空变化特征。
区域尺度上,1960~2019年间,就年平均气温而言,南极半岛和西南极冰盖呈现出分别为0.31℃/10年(P < 0.05)和0.11℃/10年(P < 0.05)的显著增加趋势;从季节变化来看,南极半岛除春季外的所有季节均呈现显著增温趋势,特别是在秋季增温趋势最为显著,达0.48℃/10年(P < 0.05),西南极冰盖和东南极冰盖春季也分别呈现0.25℃/10年(P < 0.05)和0.17℃/10年(P < 0.05)显著增温趋势。1960~1998年,南极冰盖3个区域气温变化趋势方向与1960~2019年的结果一致,且南极半岛在夏秋两季升温趋势仍比较显著,升温幅度分别为0.40℃/10年和0.50℃/10年(P < 0.05)。1999~2019年南极半岛和西南极冰盖年平均气温均呈降低趋势,降温幅度分别为0.16℃/10年和0.024℃/10年,特别是夏季南极半岛呈现出0.47℃/10年的显著降温趋势,表明全球变暖停滞事件也在这两个区域发生。
南极冰盖近地面气温变化趋势的空间格局因季节和趋势计算的时期不同差异明显。1960~1999年,冬季几乎整个南极冰盖经历了增暖但不显著;夏秋两季南极半岛及西南极冰盖较小部分呈显著变暖趋势(>0.2℃/10年,P < 0.05),降温区域范围秋季较夏季更大;春季显著增温出现在西南极冰盖,而60°W~0°E扇区内大部分区域出现了降温趋势。1999~2019年,冬季南极半岛和南极点附近区域呈现升温趋势,而其他区域经历了不同程度地降温;秋季南极半岛部分、西南极冰盖西部和东南极的大部分区域经历了降温,而南极点附近呈显著升温趋势(>0.2℃/10年,P < 0.05)。夏季南极半岛和埃尔斯沃思地降温趋势明显,其余区域出现了不同程度的增温趋势。春季区域气温变化对比明显,呈现了南极半岛和西南极冰盖变冷-东南极冰盖增温的空间模态,而且南极点附近80°~90°S范围内的升温幅度超过了0.6℃/10年(P < 0.05)。
| [1] |
效存德. 南极地区气候系统变化: 过去, 现在和将来[J]. 气候变化研究进展, 2008, 4(1): 1-7. Xiao Cunde. Changes in Antarctic climate system: Past, present and future[J]. Advance in Climate Change Research, 2008, 4(1): 1-7. DOI:10.3969/j.issn.1673-1719.2008.01.001 |
| [2] |
陈立奇. 南极和北极地区变化对全球气候变化的指示和调控作用——第四次IPCC评估报告以来一些新认知[J]. 极地研究, 2013, 25(1): 1-6. Chen Liqi. Evidence of Arctic and Antarctic changes and their regulation of global climate change(future findings since the fourth IPCC assessment report released)[J]. Chinese Journal of Polar Research, 2013, 25(1): 1-6. |
| [3] |
Wild M, Calanca P, Scherrer S C, et al. Effects of polar ice sheets on global sea level in high-resolution greenhouse scenarios[J]. Journal of Geophysical Research: Atmospheres, 2003, 108(D5): 4165. DOI:10.1029/2002JD002451 |
| [4] |
Allison I, Morrissy J V. Automatic weather stations in the Antarctic[J]. Australian Meteorological Magazine, 1983, 31(2): 71-76. |
| [5] |
Giovinetto M B, Waters N M, Bentley C R. Dependence of Antarctic surface mass balance on temperature, elevation, and distance to open ocean[J]. Journal of Geophysical Research: Atmospheres, 1990, 95(D4): 3517-3531. DOI:10.1029/JD095iD04p03517 |
| [6] |
Gregory J M, Huybrechts P. Ice-sheet contributions to future sea-level change[J]. Philosophical Transactions of the Royal Society A: Mathematical, Physical and Engineering Sciences, 2006, 364(1844): 1709-1732. DOI:10.1098/rsta.2006.1796 |
| [7] |
Herbei R, Rytel A L, Lyons W B, et al. Hydrological controls on ecosystem dynamics in Lake Fryxell, Antarctica[J]. PLoS One, 2016, 11(7): e0159038. DOI:10.1371/journal.pone.0159038 |
| [8] |
Allison I, Wendler G, Radok U. Climatology of the East Antarctic ice sheet (100° E to 140° E) derived from automatic weather stations[J]. Journal of Geophysical Research: Atmospheres, 1993, 98(D5): 8815-8823. DOI:10.1029/93JD00104 |
| [9] |
Reijmer C H. Antarctic Meteorology, A Study with Automatic Weather Stations[D]. Utrecht: The Doctoral Dissertation of Utrecht University, 2001: 64-73.
|
| [10] |
Lazzara M A, Weidner G A, Keller L M, et al. Antarctic automatic weather station program: 30 years of polar observation[J]. Bulletin of the American Meteorological Society, 2012, 93(10): 1519-1537. DOI:10.1175/BAMS-D-11-00015.1 |
| [11] |
Schwerdtfeger W. Changes of temperature field and ice conditions in the area of the Antarctic Peninsula[J]. Monthly Weather Review, 1976, 104(11): 1441-1443. DOI:10.1175/1520-0493(1976)104<1441:COTFAI>2.0.CO;2 |
| [12] |
King J C, Harangozo S A. Climate change in the western Antarctic Peninsula since 1945:Observations and possible causes[J]. Annals of Glaciology, 1998, 27: 571-575. DOI:10.3189/1998AoG27-1-571-575 |
| [13] |
Thompson D W J, Solomon S. Interpretation of recent Southern Hemisphere climate change[J]. Science, 2002, 296(5569): 895-899. DOI:10.1126/science.1069270 |
| [14] |
Vaughan D G, Marshall G J, Connolley W M, et al. Recent rapid regional climate warming on the Antarctic Peninsula[J]. Climatic Change, 2003, 60(3): 243-274. DOI:10.1023/A:1026021217991 |
| [15] |
Turner J, Colwell S R, Marshall G J, et al. Antarctic climate change during the last 50 years[J]. International Journal of Climatology, 2005, 25(3): 279-294. DOI:10.1002/joc.1130 |
| [16] |
Steig E J, Schneider D P, Rutherford S D, et al. Warming of the Antarctic ice-sheet surface since the 1957 International Geophysical Year[J]. Nature, 2009, 457(7228): 459-462. DOI:10.1038/nature07669 |
| [17] |
Richard Y, Rouault M, Pohl B, et al. Temperature changes in the mid-and high-latitudes of the Southern Hemisphere[J]. International Journal of Climatology, 2013, 33(8): 1948-1963. DOI:10.1002/joc.3563 |
| [18] |
Marshall G J, Orr A, Turner J. A predominant reversal in the relationship between the SAM and East Antarctic temperatures during the twenty-first century[J]. Journal of Climate, 2013, 26(14): 5196-5204. DOI:10.1175/JCLI-D-12-00671.1 |
| [19] |
Vaughan D G, Marshall G J, Connolley W M, et al. Recent rapid regional climate warming on the Antarctic Peninsula[J]. Climatic Change, 2003, 60(3): 243-274. DOI:10.1023/A:1026021217991 |
| [20] |
Orr A, Cresswell D, Marshall G J, et al. A 'low-level' explanation for the recent large warming trend over the western Antarctic Peninsula involving blocked winds and changes in zonal circulation[J]. Geophysical Research Letters, 2004, 31(6). DOI:10.1029/2003GL019160 |
| [21] |
Nicolas J P, Bromwich D H. New reconstruction of Antarctic near-surface temperatures: Multidecadal trends and reliability of global reanalyses[J]. Journal of Climate, 2014, 27(21): 8070-8093. DOI:10.1175/JCLI-D-13-00733.1 |
| [22] |
Jones J M, Gille S T, Goosse H, et al. Assessing recent trends in high-latitude Southern Hemisphere surface climate[J]. Nature Climate Change, 2016, 6(10): 917-926. DOI:10.1038/nclimate3103 |
| [23] |
Turner J, Lu H, White I, et al. Absence of 21st century warming on Antarctic Peninsula consistent with natural variability[J]. Nature, 2016, 535(7612): 411-415. DOI:10.1038/nature18645 |
| [24] |
Saha S, Moorthi S, Wu X, et al. The NCEP climate forecast system version 2[J]. Journal of Climate, 2014, 27(6): 2185-2208. DOI:10.1175/JCLI-D-12-00823.1 |
| [25] |
Huai B, Wang Y, Ding M, et al. An assessment of recent global atmospheric reanalyses for Antarctic near surface air temperature[J]. Atmospheric Research, 2019, 226: 181-191. DOI:10.1016/j.atmosres.2019.04.029 |
| [26] |
Bromwich D H, Fogt R L, Hodges K I, et al. A tropospheric assessment of the ERA-40, NCEP, and JRA-25 global reanalyses in the polar regions[J]. Journal of Geophysical Research: Atmospheres, 2007, 112(D10). DOI:10.1029/2006JD007859 |
| [27] |
Sterl A. On the (in) homogeneity of reanalysis products[J]. Journal of Climate, 2004, 17(19): 3866-3873. DOI:10.1175/1520-0442(2004)017<3866:OTIORP>2.0.CO;2 |
| [28] |
Renwick J A. Trends in the Southern Hemisphere polar vortex in NCEP and ECMWF reanalyses[J]. Geophysical Research Letters, 2004, 31(7). DOI:10.1029/2003GL019302 |
| [29] |
Marshall G J. Trends in Antarctic geopotential height and temperature: A comparison between radiosonde and NCEP-NCAR reanalysis data[J]. Journal of Climate, 2002, 15(6): 659-674. DOI:10.1175/1520-0442(2002)015<0659:TIAGHA>2.0.CO;2 |
| [30] |
Hodges K I, Hoskins B J, Boyle J, et al. A comparison of recent reanalysis datasets using objective feature tracking: Storm tracks and tropical easterly waves[J]. Monthly Weather Review, 2003, 131(9): 2012-2037. DOI:10.1175/1520-0493(2003)131<2012:ACORRD>2.0.CO;2 |
| [31] |
Bromwich D H, Fogt R L. Strong trends in the skill of the ERA-40 and NCEP-NCAR reanalyses in the high and midlatitudes of the Southern Hemisphere, 1958-2001[J]. Journal of Climate, 2004, 17(23): 4603-4619. DOI:10.1175/3241.1 |
| [32] |
Marshall G J, Harangozo S A. An appraisal of NCEP/NCAR reanalysis MSLP data viability for climate studies in the South Pacific[J]. Geophysical Research Letters, 2000, 27(19): 3057-3060. DOI:10.1029/2000GL011363 |
| [33] |
Hines K M, Bromwich D H, Marshall G J. Artificial surface pressure trends in the NCEP-NCAR reanalysis over the Southern Ocean and Antarctica[J]. Journal of Climate, 2000, 13(22): 3940-3952. DOI:10.1175/1520-0442(2000)013<3940:ASPTIT>2.0.CO;2 |
| [34] |
Monaghan A J, Bromwich D H, Chapman W, et al. Recent variability and trends of Antarctic near-surface temperature[J]. Journal of Geophysical Research: Atmospheres, 2008, 113(D4). DOI:10.1029/2007JD009094 |
| [35] |
Schneider D P, Steig E J, van Ommen T D, et al. Antarctic temperatures over the past two centuries from ice cores[J]. Geophysical Research Letters, 2006, 33(16). DOI:10.1029/2006GL027057 |
| [36] |
Steig E J, Ding Q, White J W C, et al. Recent climate and ice-sheet changes in West Antarctica compared with the past 2, 000 years[J]. Nature Geoscience, 2013, 6(5): 372-375. DOI:10.1038/ngeo1778 |
| [37] |
Thomas E R, Bracegirdle T J, Turner J, et al. A 308 year record of climate variability in West Antarctica[J]. Geophysical Research Letters, 2013, 40(20). DOI:10.1002/2013GL057782 |
| [38] |
Barrett B E, Nicholls K W, Murray T, et al. Rapid recent warming on Rutford Ice Stream, West Antarctica, from borehole thermometry[J]. Geophysical Research Letters, 2009, 36(2). DOI:10.1002/2013GL057782 |
| [39] |
Muto A, Scambos T A, Steffen K, et al. Recent surface temperature trends in the interior of East Antarctica from borehole firn temperature measurements and geophysical inverse methods[J]. Geophysical Research Letters, 2011, 38(15). DOI:10.1029/2011GL048086 |
| [40] |
Orsi A J, Cornuelle B D, Severinghaus J P. Little Ice Age cold interval in West Antarctica: Evidence from borehole temperature at the West Antarctic Ice Sheet (WAIS) divide[J]. Geophysical Research Letters, 2012, 39(9). DOI:10.1029/2012GL051260 |
| [41] |
Johanson C M, Fu Q. Antarctic atmospheric temperature trend patterns from satellite observations[J]. Geophysical Research Letters, 2007, 34(12). DOI:10.1029/2006GL029108 |
| [42] |
Schneider D P, Steig E J, Comiso J C. Recent climate variability in Antarctica from satellite-derived temperature data[J]. Journal of Climate, 2004, 17(7): 1569-1583. DOI:10.1175/1520-0442(2004)017<1569:RCVIAF>2.0.CO;2.3 |
| [43] |
Chapman W L, Walsh J E. A synthesis of Antarctic temperatures[J]. Journal of Climate, 2007, 20(16): 4096-4117. DOI:10.1175/JCLI4236.1 |
| [44] |
Bromwich D H, Nicolas J P, Monaghan A J, et al. Central West Antarctica among the most rapidly warming regions on Earth[J]. Nature Geoscience, 2013, 6(2): 139-145. DOI:10.1038/ngeo1671 |
| [45] |
Bromwich D H, Nicolas J P, Monaghan A J, et al. Correction: Corrigendum: Central West Antarctica among the most rapidly warming regions on Earth[J]. Nature Geoscience, 2014, 7(1): 76-76. DOI:10.1038/ngeo2016 |
| [46] |
Ricardo A O. Geostatistics for Engineers and Earth Scientists[M]. Netherlands: Kluwer Academic Publishers, 1999: 39-63.
|
| [47] |
徐建华. 计量地理学[M]. 北京: 高等教育出版社, 2014: 84-85. Xu Jianhua. Quantitative Geography[M]. Beijing: Higher Education Press, 2014: 84-85. |
| [48] |
贾俊平. 统计学[M]. 北京: 中国人民大学出版社, 2014: 66-67. Jia Junping. Statistics[M]. Beijing: China Renmin University Press, 2014: 66-67. |
| [49] |
Schneider D P, Deser C, Okumura Y. An assessment and interpretation of the observed warming of West Antarctica in the austral spring[J]. Climate Dynamics, 2012, 38(1): 323-347. DOI:10.1007/s00382-010-0985-x |
| [50] |
Perlwitz J, Pawson S, Fogt R L, et al. Impact of stratospheric ozone hole recovery on Antarctic climate[J]. Geophysical Research Letters, 2008, 35(8). DOI:10.1029/2008GL033317 |
| [51] |
Turner J, Lu H, White I, et al. Absence of 21st century warming on Antarctic Peninsula consistent with natural variability[J]. Nature, 2016, 535(7612): 411-415. DOI:10.1038/nature18645 |
| [52] |
Oliva M, Navarro F, Hrbáček F, et al. Recent regional climate cooling on the Antarctic Peninsula and associated impacts on the cryosphere[J]. Science of the Total Environment, 2017, 580: 210-223. DOI:10.1016/j.scitotenv.2016.12.030 |
| [53] |
Marshall G J, Orr A, Van Lipzig N P M, et al. The impact of a changing Southern Hemisphere Annular Mode on Antarctic Peninsula summer temperatures[J]. Journal of Climate, 2006, 19(20): 5388-5404. DOI:10.1175/JCLI3844.1 |
| [54] |
Van Lipzig N P M, Marshall G J, Orr A, et al. The relationship between the Southern Hemisphere annular mode and Antarctic Peninsula summer temperatures: Analysis of a high-resolution model climatology[J]. Climate, 2008, 21(8): 1649-1668. DOI:10.1175/2007JCLI1695.1 |
| [55] |
Ding Q, Steig E J, Battisti D S, et al. Winter warming in West Antarctica caused by central tropical Pacific warming[J]. Nature Geoscience, 2011, 4(6): 398-403. DOI:10.1038/ngeo1129 |
| [56] |
Kosaka Y, Xie S P. Recent global-warming hiatus tied to equatorial Pacific surface cooling[J]. Nature, 2013, 501(7467): 403-407. DOI:10.1038/nature12534 |
| [57] |
Clem K R, Fogt R L, Turner J, et al. Record warming at the South Pole during the past three decades[J]. Nature Climate Change, 2020, 10(8): 762-770. DOI:10.1038/s41558-020-0815-z |
| [58] |
Randel W J, Wu F. Cooling of the Arctic and Antarctic polar stratospheres due to ozone depletion[J]. Journal of Climate, 1999, 12(5): 1467-1479. DOI:10.1175/1520-0442(1999)012<1467:COTAAA>2.0.CO;2 |
| [59] |
Arblaster J M, Meehl G A. Contributions of external forcings to southern annular mode trends[J]. Journal of Climate, 2006, 19(12): 2896-2905. DOI:10.1175/JCLI3774.1 |
| [60] |
Cai W, Cowan T. Trends in Southern Hemisphere circulation in IPCC AR4 models over 1950-99:Ozone depletion versus greenhouse forcing[J]. Journal of Climate, 2007, 20(4): 681-693. DOI:10.1175/JCLI4028.1 |
| [61] |
Steig E J, Schneider D P, Rutherford S D, et al. Warming of the Antarctic ice-sheet surface since the 1957 International Geophysical Year[J]. Nature, 2009, 457(7228): 459-462. DOI:10.1038/nature07669 |
| [62] |
Thompson D W J, Solomon S, Kushner P J, et al. Signatures of the Antarctic ozone hole in Southern Hemisphere surface climate change[J]. Nature Geoscience, 2011, 4(11): 741-749. DOI:10.1038/ngeo1296 |
| [63] |
Shindell D T, Schmidt G A. Southern Hemisphere climate response to ozone changes and greenhouse gas increases[J]. Geophysical Research Letters, 2004, 31(18). DOI:10.1029/2004GL020724 |
| [64] |
Thompson D W J, Solomon S. Interpretation of recent Southern Hemisphere climate change[J]. Science, 2002, 296(5569): 895-899. DOI:10.1126/science.1069270 |
| [65] |
Jones J M, Widmann M. Early peak in Antarctic Oscillation index[J]. Nature, 2004, 432(7015): 290-291. |
Abstract
This study presents a reconstruction of monthly near-surface air temperature over the entire Antarctic Ice Sheet(AIS) from 1960 to 2019. This reconstruction uses the kriging technique to interpolate more than 50 a air temperature observational records, supplemented by the spatiotemporal temperature covariances of the three global reanalysis products including the Climate Forecast System Reanalysis(CFSR), the European Centre for Medium-Range Weather Forecasts fifth-generation reanalysis(ERA5), and the Modern-Era Retrospective Analysis for Research and Applications, version 2(MERRA-2). Comparison with the independent observations from 70 weather stations shows that the monthly temperature dataset reconstructed based on ERA 5 has the highest accuracy, with a correlation coefficient of 0.70 and a root mean square error of 0.49℃. Spatial changes in the linear trends in air temperature depend largely on the season and analyzed time spans. From 1960 to 2019, significant warming occurs in the Antarctic Peninsula(AP) and the West AIS, in terms of annual mean temperature, the AP and West AIS show significant increasing warming of 0.31℃/decade and 0.11℃/decade, respectively; From the perspective of seasonal variation, the AP shows significant warming trends in all seasons except spring, especially in autumn, when the warming trend reach 0.48℃/decade, and we also find significant warming in West AIS at 0.25℃/decade in spring. Different from the previous studies, our reconstruction reveals larger areas with the significantly increasing trends in the annual temperature, especially for most of the interior of the 60°~180°E sector, for the 1960~2019 period. The "global warming hiatus" event occurs in the AP and West AIS, with the decreasing trends in the annual mean temperature averaged at the respective region, at the rates of 0.16℃/decade and 0.024℃/decade, respectively, especially in summer, the AP shows significant cooling trend of 0.47℃/decade, during 1999~2019. From 1960 to 1998, there is no any significant air temperature changes throughout the year in the entire East AIS. However, during 1999~2019, significant warming trends occur in part of inland regions around the South Pole, especially in summer, the warming rate is more than 0.6℃/decade. These results are useful for the estimation of the spatial variability in air temperature on the different time scales over the AIS.