2 中国科学院地质与地球物理研究所, 中国科学院新生代地质与环境重点实验室, 北京 100029;
3 中国科学院生物演化与环境卓越创新中心, 北京 100044;
4 中国科学院大学地球与行星科学学院, 北京 100049;
5 中国科学院大气物理研究所, 大气科学和地球流体力学数值模拟国家重点实验室, 北京 100029;
6 北京师范大学, 地表过程与资源生态国家重点实验室, 北京 100875)
最近,过去2000年全球变化网络(Past Global Changes 2k Network,简称PAGES2k)发现全球过去2000年温度重建结果与国际耦合模式比较计划第五阶段(Coupled Model Intercomparison Project Phase 5,简称CMIP5)多模式集合平均结果在年代际尺度表现出显著的一致性变化[1],特别是15世纪中叶的两次连续火山喷发(公元1452年、公元1459年)前后这种“一致变化”现象尤为明显。这一模式和气候代用记录完全匹配的时间窗口为揭示火山活动等外强迫影响相对真实气候变化的机制提供了难得的机遇。
过去对于15世纪中叶火山活动的研究主要集中在确定库瓦火山(Kuwae)喷发的具体时间和规模。早期的冰芯记录研究将库瓦火山喷发时间确定为1452/1453年[2~3],后期高分辨的冰芯研究结果表明库瓦火山的喷发发生在1458/1459年,其可能是过去7个世纪的最强火山喷发事件,喷发地点位于现今大洋洲的瓦努阿图共和国。另外一次相对较小的北半球火山喷发事件则发生在1452/1453年[4~5]。已有基于树轮年表的气候重建数据表明,这两次火山喷发事件对北半球平均温度产生显著的降温效应[6~7],而区域气候对其的响应研究并不多见,需要进一步研究。
火山活动无疑是15世纪中叶气候系统变化最显著的外强迫[8~10]。大型火山喷发将大量的硫酸盐物质注入平流层,并形成气溶胶云向全球散布,气溶胶云对太阳辐射的散射和反射作用增加了地球的行星反射率,减少了大气层顶和地面的净入射太阳辐射,从而造成对流层和地表的降温以及大气环流和降水的调整[11~13]。由于气溶胶的沉降作用,单次火山喷发对太阳辐射的影响只有2~3年。因此,过去研究多集中于火山喷发对年际尺度气候变化的影响。然而,最近过去千年气候重建和模拟对比研究发现,在年代际和多年代际尺度上,火山喷发会通过影响海洋热含量、海洋环流和海冰的变化对全球气候系统产生重要影响[14~16]。
北半球的“两极”——青藏高原和北极包含了北半球主要的冰川、冰盖和积雪,作为全球气候变化的关键区和敏感区[17~19],是研究火山活动影响区域气候变化的理想区域。过去的研究基于代用记录的古气候重建证实15世纪中叶青藏高原出现年代际尺度的温度下降和降水减少[20~23],并推断不同纬度的火山喷发对青藏高原的冷却作用存在显著差异。此外,厄尔尼诺-南方涛动(El Niño -Southern Oscillation,简称ENSO)作为气候系统年际尺度最显著的内在变率,也可能影响青藏高原气候对火山强迫的响应过程[24]。而北极的夏季温度重建结果显示在15世纪中叶也存在年代际尺度的降温[25],其可能物理过程是连续火山喷发会使得北极温度下降和海冰扩张,并通过海洋-海冰耦合过程使火山活动对北极温度的影响持续数十年到百年[26~28]。然而,这些研究并未讨论青藏高原和北极的协同变化以及火山喷发对两地年代际尺度气候变化关联的影响。最近已有学者开始注意到北大西洋涛动(North Atlantic Oscillation,简称NAO)/北极涛动(Arctic Oscillation,简称AO)通过影响青藏高原及其周边区域的大气环流,从而对青藏高原冬季雪深异常有着明显的调控作用[29~32]。同时,北极海冰的变化可以调制NAO/AO对青藏高原积雪的影响,从而使两地区之间存在直接的联系[32],但青藏高原和北极水热变化在年代际尺度上的可能联系仍不清楚。
本文基于通用地球系统模式过去千年集合模拟试验(Community Earth System Model-Last Millennium Ensemble,简称CESM-LME),分析了15世纪中叶的两次火山喷发对青藏高原和北极的水热组合的年代际影响,尝试探讨了可能的物理机理,并简要地分析了火山强迫下两地区之间的联系,为理解区域气候对火山活动的年代际响应过程提供参考。
1 数据与方法 1.1 模式模拟结果CESM-LME试验是目前已公布的通用地球系统模式最大的单模式过去千年模拟集合试验。时间跨度为公元850~2005年,其中共包括13个全强迫的集合试验,分别命名为1号至13号模拟试验[33]。由于1号模拟试验缺失850~1699年大气模块的部分输出数据,无法进行全时段环流分析,因此本文后续从12个集合试验中进行筛选分析。该试验使用美国国家大气研究中心(National Center for Atmospheric Research,简称NCAR)开发的通用地球系统模式(Community Earth System Model, 简称CESM)1.1版本。该模式由大气、海洋、陆地、陆冰、海冰和生物地球化学等主要模块组成,并通过耦合器进行实时的数据交换[34]。CESM-LME试验的大气和陆地分量模块的空间分辨率为纬度2°×经度2°,海洋和海冰分量模式的空间分辨率为纬度1°×经度1°。
1.2 研究时段的选取为了研究火山活动的年代际影响,依据CESM-LME集合试验使用的火山强迫序列[3],选取包含两次火山喷发的30年跨度的公元1445~1474年作为火山强迫时段;选取相同时间跨度的公元1422~1451年为无火山强迫时段(时段内无大型火山活动)。
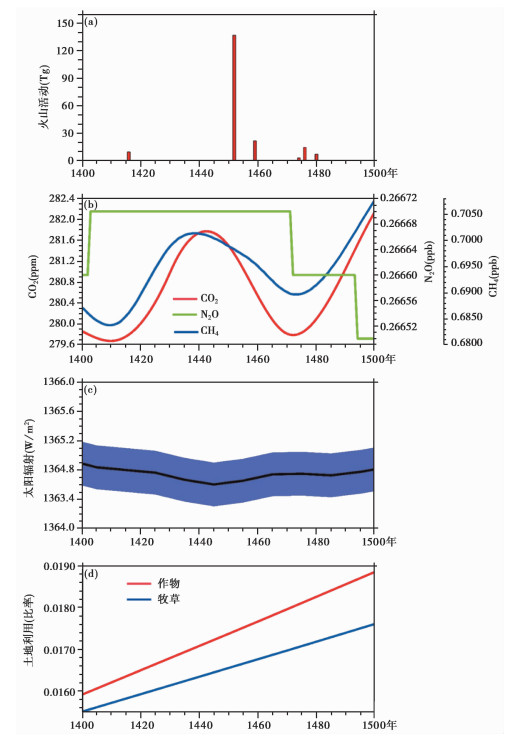
图 1给出了15世纪CESM-LME试验的强迫场,主要包括火山强迫、太阳活动、温室气体和土地利用变化。分别对除火山强迫外的外强迫进行突变检验(Mann-Kendall检验[35]),发现各强迫因子在1422~1474年期间并不存在突变。
|
图 1 15世纪CESM-LME主要强迫因子的变化 (a)火山气溶胶平流层注入量(单位:Tg);(b)温室气体浓度(包括CO2(单位:ppm)、N2O(单位:ppb)和CH4(单位:ppb));(c)总太阳辐射量(单位:W/m2);(d)土地利用变化(单位:全球陆地占比) Fig. 1 Evolution of the major forcings used for the CESM-LME during fifteenth century.(a)Global stratospheric volcanic sulfate aerosol injection(units: Tg); (b)Greenhouse gas concentrations(including CO2(units: ppm), N2O(units: ppb), and CH4(units: ppb)); (c)Total solar irradiance(units: W/m2); (d)Land use change(units: global-land fraction) |
本工作基于数据同化的思想,通过计算15世纪中叶火山强迫时段各集合成员全球平均温度模拟结果与古气候重建结果[1]的相关系数,根据相关系数的显著性检验挑选与重建更为一致的模拟成员用于后续分析。
1.4 滤波方法本文使用了巴特沃斯(Butterworth)滤波[36]和加权滑动平均两类滤波方法。为了避免较多数据的损失,在挑选集合成员时,使用巴特沃斯带通滤波器对模式结果和重建结果进行处理,保留了年代际-多年代际尺度的变化特征。另一方面为了防止滤波方法在数据始端和末端引入虚假的波动,在探究温度和降水的变化规律时,利用31年的加权滑动平均(权重由兰索斯滤波方法计算得出[37])对温度和降水的时间序列进行处理,以便于分析火山强迫对区域气候年代际尺度的影响。
2 结果与讨论 2.1 集合成员筛选结果在进行集合成员筛选前,使用巴特沃斯带通滤波对代用资料重建和各集合成员的全球年平均温度序列进行处理,保留30~200年周期的温度变化特征。随后计算火山强迫时段(1445~1474年)内各集合成员的全球年平均温度序列与重建结果的相关系数,并从12个集合试验中进行筛选出相关系数最大的4个集合成员,分别是第3号(No.3)、第6号(No.6)、第8号(No.8)和第10号(No.10)模拟试验,用于后续分析。
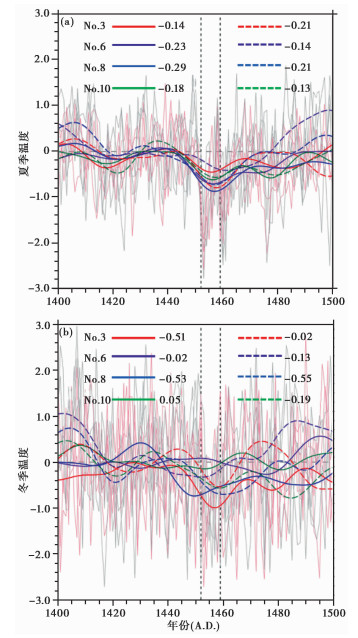
2.2 火山喷发影响区域温度的年代际变化对于夏季气候来说,相对于无火山强迫的参考时段,在火山强迫时段(公元1445~1474年),4个成员青藏高原夏季温度距平的30年平均值为-0.14~-0.29℃,4个模拟成员北极夏季温度距平(4条彩色虚线)的30年平均值为-0.13~-0.21℃(图 2a)。在各集合成员中,青藏高原和北极的夏季温度均在两次火山喷发期间达到一个世纪(公元1400~1500年)内的最低值(第6号模拟试验的北极温度除外)。可以看出,青藏高原和北极的夏季区域平均温度在火山强迫下出现明显的年代际尺度的下降。
|
图 2
15世纪中叶火山喷发前后青藏高原和北极的温度变化
(a)夏季(6月至8月)平均温度(单位:℃);(b)冬季(上年12月至2月)平均温度(单位:℃) 彩色粗实线和粗虚线分别为各集合成员的青藏高原(27°~37°N,75°~105°E)和北极(60°N以北)温度距平30年低通滤波结果(对比时段为公元1422~1451年); 浅红色和浅灰色细实线分别为青藏高原和北极逐年温度距平的原始序列;图例中的数值为火山强迫时段(公元1445~1474年)温度距平的30年平均值 黑色竖虚线指示15世纪中叶两次火山喷发时间 Fig. 2 Surface temperature in the Tibetan Plateau and Arctic responding to volcanic eruptions during mid-fifteenth century.(a)Boreal summer(June-August)mean area-averaged temperature anomalies(units: ℃); (b)Boreal winter(December-February)mean area-averaged temperature anomalies. Colored thick solid lines and dash lines indicate 30-a filtered mean area-averaged temperature anomalies in Tibetan Plateau(27°~37°N, 75°~105°E)and Arctic(north of 60°N), separately. Anomalies are relative to 1422~1451 A.D. each ensemble member is a different color. Light red(Tibetan Plateau)and light gray(Arctic)lines are raw data. The values in legend are mean area-averaged temperature anomalies during 1445~1474 A.D. Vertical black dash lines denote the year of eruptions |
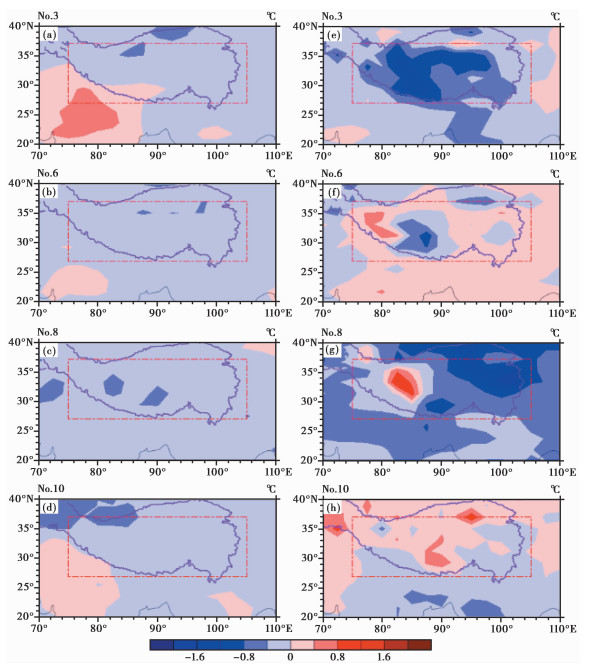
火山强迫时段内,各集合成员的青藏高原夏季温度年际和年代际变化(细实线和粗实线)在降温开始和达到极值的时间点上均较为一致(图 2a)。从温度变化的空间场可以看出,青藏高原受到火山喷发的影响,主体区域均表现为较一致的降温,且不同集合成员的结果中,温度变化的空间模态较为一致(图 3a~3d)。
|
图 3
火山强迫时段青藏高原温度距平场
左侧为夏季平均温度(a~d),右侧为冬季平均温度(e~h) 图中红色虚线框为青藏高原区域;温度距平的对比时段为公元1422~1451年 Fig. 3 Surface temperature anomalies over the Tibetan Plateau during 1445~1474 A.D.(a~d)Boreal summer mean temperature anomalies; (e~h)Boreal winter mean temperature anomalies(with respect to 1422~1451 A.D.); Red rectangles denote the region of the Tibetan Plateau |
虽然不同集合成员结果中北极夏季温度年际和年代际变化(细实线和粗实线)在降温开始的时间点上存在一定的差异,但是火山强迫时段内年代际尺度的降温和升温过程是各集合成员的共同特征——北极夏季温度(图 2a彩色粗虚线)下降趋势开始时间,即降温开始时间较不一致,但在1445~1474年变化趋势较一致,均存在下降(年代际降温)和上升(年代际的温度恢复)过程。同样,火山强迫时段内,尽管各集合成员显示北极夏季温度变化的区域和幅度存在一定的差异,但温度变化的空间场均表现出降温主导的空间模态(图略)。这表明不同集合成员的结果中,火山强迫对青藏高原和北极夏季温度的影响较为一致。此外,从5个单火山强迫成员在1445~1474年期间的30年平均夏季温度异常值的结果来看,青藏高原夏季平均降温0.15℃,北极夏季平均降温0.20℃。这与4个全强迫成员的结果相当,也说明火山强迫在夏季区域气候变化中起到了主导作用。
针对冬季气候,在火山强迫的影响下,多数集合成员的结果中,15世纪中叶冬季温度的年代际尺度的下降和恢复仍较为明显,但是不同集合成员中冬季温度的变化过程差异很大,降温幅度也存在显著差异(图 2b),这与各集合成员间较一致的夏季降温有明显区别。
具体来说,在火山强迫时段内,两个集合成员(第6号和第10号模拟试验)的青藏高原冬季温度距平的30年平均值分别为-0.02℃和0.05℃(图 2b),难以证实存在年代际尺度的降温阶段。其他两个集合成员(第3号和第8号模拟试验)的结果中,虽然均存在明显的年代际尺度的降温,但是在降温开始和达到极值的时间点上存在明显的差异。与温度变化的时间序列相对应,各集合成员之间青藏高原冬季温度变化的空间模态也存在明显的差异(图 3e~3h)。两个未出现明显冷却过程的成员(第6号和第10号模拟试验)温度变化的空间模态以较弱的升温主导,其他两个集合成员温度变化的空间模态尽管均为负距平主导,但空间上降温幅度与降温区域存在明显差异。
而对于北极冬季温度来说,在各成员之间的差异表现与青藏高原冬季温度的结果类似。虽然均表现出年代际尺度的降温和升温过程,但是在降温开始时间点和温度回升过程方面存在明显差异,尤其在火山强迫时段温度距平的30年平均值上,各集合成员的差异最为明显。不同集合成员的结果中,北极冬季温度变化的空间场之间存在明显的差异(图略),与夏季温度的一致变化形成鲜明对比。
从以上结果可以看出,研究区域夏季温度年代际尺度的下降更为明显,而各集合成员的冬季的温度变化具有较大的差异,这表明夏季温度受到了火山活动的直接强迫影响,使得各集合成员出现较一致的变化。可能原因是火山喷发可能对海洋热含量产生更长时间尺度的累积效应,并且这一效应在大型火山喷发和连续的火山喷发中更为显著[15, 38]。另外,火山喷发也有可能在长时间尺度上影响了海洋环流和海冰变化及其耦合过程,从而引起气候系统长时间尺度的响应[26~28, 39]。
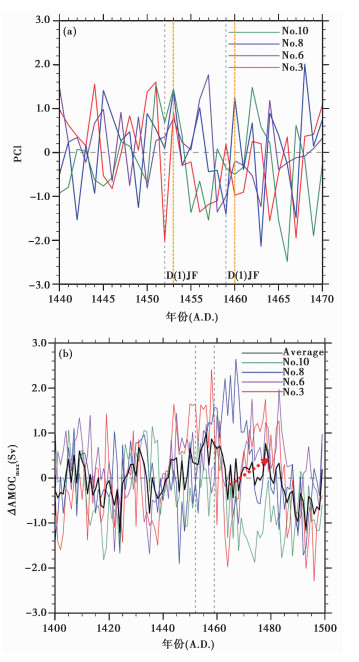
而冬季温度除了受到火山活动直接影响之外,可能还受到火山活动的间接强迫影响。一方面由图 4a可以看出,在1452年较强低纬火山喷发后的次年冬季,4个模拟成员均显示北极涛动(AO)转为正位相。并且在两次火山喷发之后,多成员平均的大西洋经圈翻转环流(Atlantic Meridional Overtruning Circulation, 简称AMOC)在1465~1480年期间存在增强的趋势(图 4b)。这意味着火山活动间接影响区域气候的具体过程是火山爆发可以增加平流层的纬向温度梯度,根据热成风原理[40],平流层低层的西风将加强,由于中高纬度地区冬季行星波活动频繁,而行星波的活动受到高纬风切变的控制,因此行星波将在增强的纬向风的下方即垂直风切变最大的地方被折射到低纬地区,低纬度地区对流层角动量将输送到高纬度地区,对流层西风增强,引起北极涛动转为正位相(图 4a),冬季风随之减弱[41~42],进而导致北极冬季暖化[40, 43~45]。因为北极涛动处于正位相,有利于北大西洋副极地地区深水对流的发展,深水对流加强引起10至20年后AMOC加强[46](图 4b),进一步影响了两极温度的年代际变化。通过分析单次火山喷发后北半球冬季温度的变化(图略),我们发现并不是所有成员都出现“冬季暖化”现象,同时,火山喷发影响下北极涛动虽然存在正位相的响应,但是北极涛动变化在各成员之间仍存在差异,说明尽管火山活动可以强迫北极涛动趋于正位相,但影响北极涛动的因素并不唯一,这也导致不同集合成员结果中冬季温度的变化存在较大差异。
|
图 4 北极涛动与大西洋经圈翻转环流的变化 (a)北极涛动(AO):20°N以北1000 hPa位势高度逐月变化的第一主成分(PC1)(相对整个模拟时段进行了标准化)作为北极涛动指数,其中灰色竖虚线指示火山喷发年份,橙色竖虚线指示火山喷发次年冬季;(b)大西洋经圈翻转环流(AMOC):以北大西洋20°~60°N和深度500~2000m范围内经向翻转流最大值作为大西洋经圈翻转环流强度(ΔAMOCmax),黑色曲线代表选择的4个成员的平均变化,对比时段为1422~1451年,灰色竖虚线指示火山喷发年份 Fig. 4 The evolutions of Arctic Oscillation and Atlantic Meridional Overturning Circulation.(a)Arctic Oscillation(AO); The index of AO is defined as the first leading principal component from the EOF analysis of monthly mean height anomalies at 1000-hPa poleward of 20° latitude for the Northern Hemisphere. Vertical black dash lines denote the year of eruptions and vertical orange dash line denotes the first winter after the eruption. (b)Atlantic Meridional Overturning Circulation(AMOC); The AMOC index is the maximum in the zonally averaged overturning stream function in the North Atlantic between 30°N and 60°N and between 500-and 2000-m depth. Black line indicate average AMOC index of four members. Anomalies are relative to 1422~1451 A.D. Vertical black dash lines denote the year of eruptions |
在两次火山喷发影响的15世纪中叶,各集合成员尽管在年际和年代际降水开始减少的时间点上存在差异,但青藏高原和北极的夏季降水均表现出年代际尺度的下降和回升过程(图 5a)。综合各集合成员的结果,在火山强迫的影响下,青藏高原的夏季降水(30年平均值)相较无火山强迫时段减少了0.5 % ~2.2 %,北极的夏季降水(30年平均值)减少了0.4 % ~2.0 %。两地区的夏季降水减少持续数十年,直至15世纪70年代至80年代,青藏高原和北极的夏季降水才恢复到火山喷发前的状态,部分集合成员可能受15世纪60年代后的火山喷发影响,其降水减少持续到16世纪。
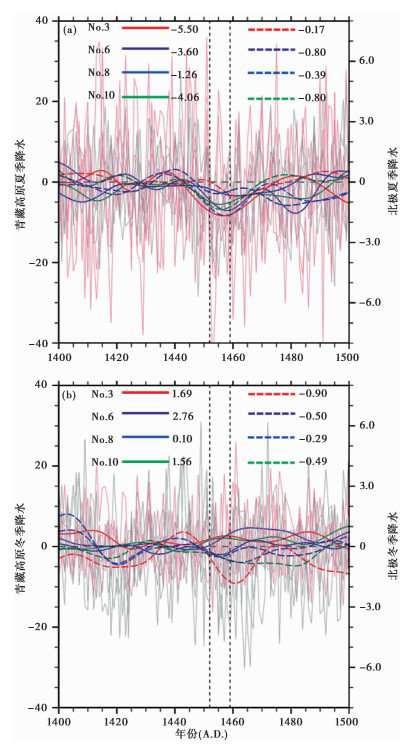
|
图 5
15世纪中叶火山喷发前后青藏高原和北极降水变化(单位:mm/月)
(a)夏季平均降水;(b)冬季平均降水彩色粗实线和粗虚线分别为各集合成员的青藏高原(27°~37°N,75°~105°E)和北极(60°N以北)降水距平30年低通滤波结果(对比时段为公元1422~1451年);浅红色和浅灰色细实线分别为青藏高原和北极逐年降水距平的原始序列;图例中的数值为火山强迫时段(公元1445~1474年)降水距平的30年平均值 黑色竖虚线指示15世纪中叶两次火山喷发时间 Fig. 5 Precipitation in the Tibetan Plateau and Arctic responding to volcanic eruptions during mid-fifteenth century.(a)Boreal summer mean area-averaged precipitation anomalies(units: mm/month); (b)Boreal winter mean area-averaged precipitation anomalies. Colored thick solid lines and dash lines indicate 30-yrs filtered mean area-averaged precipitation anomalies in the Tibetan Plateau(27°~37°N, 75°~105°E) and Arctic(north of 60°N), respectively. Anomalies are relative to 1422~1451 A.D. each ensemble member is a different color. Light red(Tibetan Plateau)and light gray(Arctic)lines are raw data. The values in legend are mean area-averaged precipitation anomalies during 1445~1474 A.D. Vertical black dash lines denote the year of eruptions |
各集合成员的结果中,相较无火山强迫时段,北极冬季降水减少了1 % ~3 % (30年平均值)。北极冬季降水尽管在变化过程上存在一些差异,但均具有类似与夏季降水的年代际降水减少的共同特征(图 5b)。而火山强迫时段内,3个集合成员的青藏高原冬季降水相较无火山强迫时段增加了5 % ~8 % (30年平均值),青藏高原冬季降水这一变化与北极完全相反。
本文给出CESM-LME试验的4个模拟成员青藏高原的夏季降水和北极地区的夏季、冬季降水均出现年代际尺度的减少(如图 5所示)。而影响其降水减少的可能物理过程是:在火山强迫下,地表温度降低,使得蒸发散作用减弱,减少了大气中的水汽含量,从而导致全球降水减少[12]。火山喷发引起的降温也会使得大气持水能力下降,从而使得可降水量减少,这在寒冷地区尤为明显[47]。另一方面,青藏高原位于东亚季风和印度季风的边缘区域,其降水很大程度受到夏季风环流的直接影响[48]。火山喷发造成海洋和陆地的差异性降温,减小了海陆热力差异,使得夏季风强度减弱、季风降水减少[13, 49~50]。而火山喷发造成的低温以及其引起的海冰增加可能与现代变暖背景下北极的水汽平流输入增强过程相反[51],造成北极降水减少。因此,除青藏高原的冬季降水以外,火山强迫下青藏高原和北极地区年代际尺度的降温和大气环流的相应调整可能是同期降水减少的根本原因。
青藏高原冬季降水增加可能与火山喷发的间接效应有关。由于受到火山气溶胶的热力学和对臭氧层扰动的影响,北极涛动在年际尺度上转为正位相[40, 43~45],从而在冬季时通过加强中纬度西风、印缅槽等过程使大西洋和印度洋向青藏高原的水汽输送得到加强,最终使得青藏高原的冬季降水增加[29]。另一方面,气候系统内部变率印度洋偶极子可能也是青藏高原冬季降水增加的原因之一[52~53]。冬季时,正位相印度洋偶极子引起的大气对流异常可以通过罗斯贝波在印度北部触发气旋型的区域大气环流,从而增加孟加拉湾向青藏高原的水汽输送[52~53],而这种印度洋偶极子的位相转变可能与火山喷发的间接效应有关[54]。那么,这意味着在15世纪中叶连续的火山喷发影响下,类似的机制在年代际尺度影响北极涛动和印度洋偶极子,使得青藏高原冬季降水增多。当然需要注意的是,青藏高原降水的模拟依旧具有很大的挑战,几乎所有参与国际耦合模式比较计划第三阶段(CMIP3)和第五阶段(CMIP5)的模式在高原地区降水的模拟方面都存在湿偏差[55],因此上述关于青藏高原冬季降水增加的归因讨论仍存在不确定性。
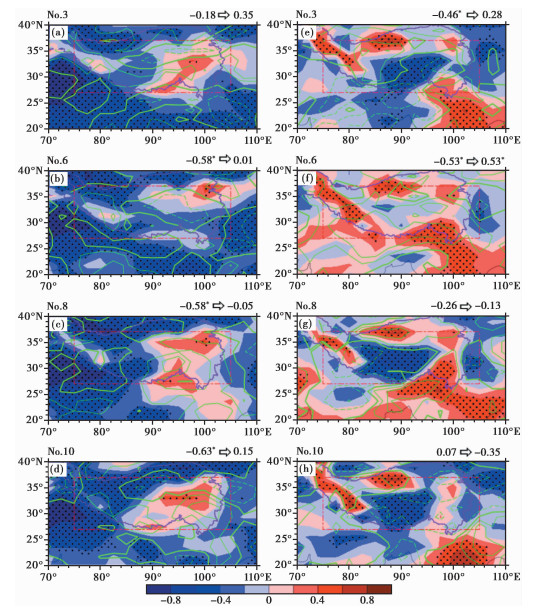
2.4 火山喷发影响区域水热组合的年代际变化15世纪中叶火山喷发影响到青藏高原和北极温度和降水的年代际变化,必然会对两区域水热组合产生影响。图 6a~6d为比较无火山强迫时段和火山强迫时段两段时间内夏季区域平均温度和降水的相关系数,发现青藏高原夏季水热关系由显著的负相关转为不相关或较弱的正相关。在火山强迫时段,青藏高原西部区域的夏季水热组合虽然仍以负相关主导,但与无火山强迫时段相比,其负相关性明显减弱。此外,多个集合成员的结果均表明(第6号模拟试验除外),青藏高原东南部夏季水热组合的正相关关系在火山强迫时段得到加强。西部和东南部夏季水热组合的变化主导了青藏高原区域平均温度和降水相关系数趋于正值。青藏高原冬季区域平均温度和降水的相关系数也表明冬季水热关系在火山强迫的影响下存在由负相关向正相关转变的过程。火山强迫下,尽管青藏高原中部区域的水热组合仍为负相关,但是边缘区域水热组合的正相关关系加强,这可能是区域平均的温度和降水负相关关系减弱(图 6e~6h)的主要原因。
|
图 6
15世纪中叶火山喷发前后青藏高原水热组合关系的变化
左侧为夏季水热组合(a~d),右侧为冬季平均温度(e~h) 填色表示火山强迫时段(公元1445~1474年)温度和降水的相关系数,蓝色和红色数值分别表示无火山强迫(公元1422~1451年)和火山强迫时段区域平均温度和降水的相关系数;打点和星号指示相关性通过95 % 的显著性检验;绿色等值线表示温度和降水相关性的变化(火山强迫时段温度和降水的相关系数减去无火山强迫时段温度和降水的相关系数),粗实线为零值,细实线为正值,虚线为负值,等值线间距为0.2; 红色虚线框为青藏高原区域 Fig. 6 Hydro-thermal combination in the Tibetan Plateau responding to volcanic eruptions during mid-fifteenth century.(a~d)Boreal summer hydro-thermal combination; (e~h)Boreal winter hydro-thermal combination; correlation coefficients between temperature and precipitation(shading)are calculated during 1445~1474 A.D. Blue and red values are the correlation coefficients between area-averaged temperature and area-averaged precipitation during 1422~1451 A.D. and 1445~1474 A.D., respectively. The regions and values that are significant at the 95 % confidence level are dotted and asterisked, respectively. Green contours indicate variations of hydro-thermal combination(r(1445-1474) minus r(1422-1451)), zero line is thickened, solid lines and dash lines denote positive and negative, respectively. Contour interval is 0.2. Red rectangles denote the region of the Tibetan Plateau |
北极区域平均的夏季温度和降水的相关关系变化表明,在火山强迫下,北极的水热组合向正相关转变(图略)。各集合成员的结果中,北极水热组合变化的空间场显示大部分区域水热组合的关系趋于正相关,但是变化的空间模态具有很大差异,这可能是由于高纬地区温度的内在变率较大[47],导致各集合成员的空间模态存在明显不同。北极冬季水热组合的空间模态在无火山强迫和火山强迫时段内虽然均以正相关主导,但是不同集合成员的结果中,北极区域平均的冬季温度和降水相关系数变化有较大差异,阻碍了进一步探讨冬季水热组合在火山强迫影响下的变化。
通过计算两时段(无火山强迫时段和火山强迫时段)内青藏高原和北极之间温度的相关系数和降水的相关系数,我们发现青藏高原和北极的夏季温度(降水)表现出显著的正相关,并且两地区冬季温度出现由负相关向正相关转变的趋势(表 1)。
| 表 1 青藏高原和北极温度/降水的相关关系 Table 1 Correlation of temperature/precipitation between the Tibetan Plateau and Arctic |
在火山喷发强迫下,青藏高原和北极地区的温度(降水)均出现一致的变化。火山喷发可以通过差异性暖化平流层等过程影响北极涛动的变化以及通过影响短波辐射和大洋环流来影响大西洋多年代际振荡[45~46, 56],同时气候重建(观测)和模式研究认为北极涛动和大西洋多年代际振荡通过改变大气环流、暖化平流层和调控热量输送等热力学和动力学过程显著影响北极地区和青藏高原的气候变化[22, 29, 42, 57~58]。因此,青藏高原和北极区域气候不仅受到火山喷发这一最直接的共同的外强迫影响外,同时火山喷发的间接效应引起的气候系统其他组分(北极涛动、大西洋多年代际振荡等)的变化可能也对两地区的气候产生显著影响。本文的结果表明,这些作用均使研究区域的水热组合趋于正相关,也使青藏高原和北极地区温度(降水)趋于正相关。上述的变化在夏季时更为显著,而各集合成员冬季的结果存在一定程度的差异。这一差异表明,在年代际尺度上,火山强迫的直接效应是夏季气候变化的主要影响因素,而两极的冬季气候变化可能主要受到火山强迫的间接效应调控,该间接效应通过影响气候系统内部变率来实现的。
3 结论本文基于CESM-LME试验就15世纪中叶两次连续火山喷发对青藏高原和北极地区水热组合的年代际影响进行了初步研究,得到结论如下:
(1) 在15世纪中叶连续的火山喷发的影响下,青藏高原和北极地区的温度出现年代际尺度的下降,其中,青藏高原夏季平均降温0.14~0.29℃,北极夏季平均降温0.13~0.21℃,这可能是海洋、海冰等组分对火山喷发长时间尺度的响应所造成的。
(2) 在火山强迫下,青藏高原夏季降水、北极地区的夏季和冬季降水出现年代际尺度的减少,其中,青藏高原夏季降水减少0.5 % ~2.2 %,北极夏季降水0.4 % ~2.0 %,与温度变化联系的大气湿度减少、持水能力减弱和夏季风减弱可能是主要原因。
(3) 在火山喷发这一共同外强迫下,青藏高原和北极地区的水热组合趋于正相关,同时两地区之间的温度(降水)趋于正相关,两地区的联系可能因此得到增强。
(4) 15世纪中叶,火山强迫是青藏高原和北极气候年代际变化的主导因素,而火山活动的间接作用可能通过导致北极涛动转为正位相,进而引起大西洋经圈翻转环流在年代际尺度上的加强,来调控两地区冬季气候对火山强迫的响应。
连续的火山喷发在年代际尺度上影响了北极地区和青藏高原的水热状况,并且影响到两地区的遥相关关系。后续工作需要通过加强模式和重建资料的结合,来进一步探讨两地区温度和降水变化的机理,以期为深入理解历史气候变化的物理机制提供参考。
致谢: 感谢兰州大学史良博士研究生对本文提出的建设性意见;感谢审稿专家和编辑部杨美芳老师对本文提出的宝贵修改意见。
| [1] |
Neukom R, Barboza L A, Erb M P, et al. Consistent multidecadal variability in global temperature reconstructions and simulations over the Common Era[J]. Nature Geoscience, 2019, 12(8): 643-649. DOI:10.1038/s41561-019-0400-0 |
| [2] |
Gao C C, Robock A, Self S, et al. The 1452 or 1453 A.D. Kuwae eruption signal derived from multiple ice core records: Greatest volcanic sulfate event of the past 700 years[J]. Journal of Geophysical Research, 2006, 111(D12). DOI:10.1029/2005jd006710 |
| [3] |
Gao C C, Robock A, Ammann C. Volcanic forcing of climate over the past 1500 years: An improved ice core-based index for climate models[J]. Journal of Geophysical Research: Atmospheres, 2008, 113(D23). DOI:10.1029/2008jd010239 |
| [4] |
Cole-Dai J, Ferris D G, Lanciki A L, et al. Two likely stratospheric volcanic eruptions in the 1450s C.E. found in a bipolar, subannually dated 800 year ice core record[J]. Journal of Geophysical Research: Atmospheres, 2013, 118(14): 7459-7466. DOI:10.1002/jgrd.50587 |
| [5] |
Sigl M, Winstrup M, McConnell J R, et al. Timing and climate forcing of volcanic eruptions for the past 2, 500 years[J]. Nature, 2015, 523(7562): 543-549. DOI:10.1038/nature14565 |
| [6] |
Salzer M W, Hughes M K. Bristlecone pine tree rings and volcanic eruptions over the last 5000 yr[J]. Quaternary Research, 2017, 67(1): 57-68. |
| [7] |
Esper J, Büntgen U, Hartl-Meier C, et al. Northern Hemisphere temperature anomalies during the 1450s period of ambiguous volcanic forcing[J]. Bulletin of Volcanology, 2017, 79(6). DOI:10.1007/s00445-017-1125-9 |
| [8] |
Schurer A P, Tett S F B, Hegerl G C. Small influence of solar variability on climate over the past millennium[J]. Nature Geoscience, 2014, 7(2): 104-108. DOI:10.1038/ngeo2040 |
| [9] |
McGregor H V, Evans M N, Goosse H, et al. Robust global ocean cooling trend for the pre-industrial Common Era[J]. Nature Geoscience, 2015, 8(9): 671-677. DOI:10.1038/ngeo2510 |
| [10] |
万凌峰, 刘健, 高超超, 等. 全新世火山喷发对温度变化趋势影响的模拟研究[J]. 第四纪研究, 2020, 40(6): 1597-1610. Wan Lingfeng, Liu Jian, Gao Chaochao, et al. Study about influence of the Holocene volcanic eruptions on temperature variation trend by simulation[J]. Quaternary Sciences, 2020, 40(6): 1597-1610. |
| [11] |
Robock A. Volcanic eruptions and climate[J]. Reviews of Geophysics, 2000, 38(2): 191-219. DOI:10.1029/1998RG000054 |
| [12] |
Iles C E, Hegerl G C. The global precipitation response to volcanic eruptions in the CMIP5 models[J]. Environmental Research Letters, 2014, 9(10). DOI:10.1088/1748-9326/9/10/104012 |
| [13] |
Zuo M, Zhou T J, Man W M. Hydroclimate responses over global monsoon regions following volcanic eruptions at different latitudes[J]. Journal of Climate, 2019, 32(14): 4367-4385. DOI:10.1175/JCLI-D-18-0707.1 |
| [14] |
Church J A, White N J, Arblaster J M. Significant decadal-scale impact of volcanic eruptions on sea level and ocean heat content[J]. Nature, 2005, 438(7064): 74-77. DOI:10.1038/nature04237 |
| [15] |
Stenchikov G, Delworth T L, Ramaswamy V, et al. Volcanic signals in oceans[J]. Journal of Geophysical Research: Atmospheres, 2009, 114(D16). DOI:10.1029/2008jd011673 |
| [16] |
PAGES2k-Consortium. Continental-scale temperature variability during the past two millennia[J]. Nature Geoscience, 2013, 6(5): 339-346. DOI:10.1038/ngeo1797 |
| [17] |
Wu G X, Zhang Y S. Tibetan Plateau forcing and the timing of the monsoon onset over South Asia and the South China Sea[J]. Monthly Weather Review, 1998, 126(4): 913-927. DOI:10.1175/1520-0493(1998)126<0913:TPFATT>2.0.CO;2 |
| [18] |
Wang B, Bao Q, Hoskins B, et al. Tibetan Plateau warming and precipitation changes in East Asia[J]. Geophysical Research Letters, 2008, 35(14). DOI:10.1029/2008GL034330 |
| [19] |
Serreze M C, Barry R G. Processes and impacts of Arctic amplification: A research synthesis[J]. Global and Planetary Change, 2011, 77(1-2): 85-96. DOI:10.1016/j.gloplacha.2011.03.004 |
| [20] |
姚檀栋, 杨梅学, 康兴成. 从古里雅冰芯与祁连山树轮记录看过2000年气候变化[J]. 第四纪研究, 2001, 21(6): 514-519. Yao Tandong, Yang Meixue, Kang Xingcheng. Comparative study of the climate changes in the past 2000 years by using ice core and tree records[J]. Quaternary Sciences, 2001, 21(6): 514-519. DOI:10.3321/j.issn:1001-7410.2001.06.007 |
| [21] |
Liu Y, An Z S, Linderholm H W, et al. Annual temperatures during the last 2485 years in the mid-eastern Tibetan Plateau inferred from tree rings[J]. Science in China (Series D): Earth Sciences, 2009, 52(3): 348-359. DOI:10.1007/s11430-009-0025-z |
| [22] |
Yang B, Qin C, Wang J L, et al. A 3500-year tree-ring record of annual precipitation on the northeastern Tibetan Plateau[J]. Proceedings of the National Academy of Sciences of the United States of America, 2014, 111(8): 2903-2908. DOI:10.1073/pnas.1319238111 |
| [23] |
Wang J L, Yang B, Ljungqvist F C. A millennial summer temperature reconstruction for the eastern Tibetan Plateau from tree-ring width[J]. Journal of Climate, 2015, 28(13): 5289-5304. DOI:10.1175/JCLI-D-14-00738.1 |
| [24] |
Duan J P, Li L, Ma Z G, et al. Summer cooling driven by large volcanic eruptions over the Tibetan Plateau[J]. Journal of Climate, 2018, 31(24): 9869-9879. DOI:10.1175/JCLI-D-17-0664.1 |
| [25] |
Shi F, Yang B, Ljungqvist F C, et al. Multi-proxy reconstruction of Arctic summer temperatures over the past 1400 years[J]. Climate Research, 2012, 54(2): 113-128. DOI:10.3354/cr01112 |
| [26] |
Zhong Y, Miller G H, Otto-Bliesner B L, et al. Centennial-scale climate change from decadally-paced explosive volcanism: A coupled sea ice-ocean mechanism[J]. Climate Dynamics, 2011, 37(11-12): 2373-2387. DOI:10.1007/s00382-010-0967-z |
| [27] |
Miller G H, Geirsdóttir Á, Zhong Y F, et al. Abrupt onset of the Little Ice Age triggered by volcanism and sustained by sea-ice/ocean feedbacks[J]. Geophysical Research Letters, 2012, 39(2). DOI:10.1029/2011GL050168 |
| [28] |
Slawinska J, Robock A. Impact of volcanic eruptions on decadal to centennial fluctuations of Arctic sea ice extent during the last millennium and on initiation of the Little Ice Age[J]. Journal of Climate, 2018, 31(6): 2145-2167. DOI:10.1175/JCLI-D-16-0498.1 |
| [29] |
Lü J M, Ju J H, Kim S J, et al. Arctic Oscillation and the autumn/winter snow depth over the Tibetan Plateau[J]. Journal of Geophysical Research, 2008, 113(D14). DOI:10.1029/2007jd009567 |
| [30] |
Zhang Y, Zou T, Xue Y K. An Arctic-Tibetan connection on subseasonal to seasonal time scale[J]. Geophysical Research Letters, 2019, 46(5): 2790-2799. DOI:10.1029/2018GL081476 |
| [31] |
覃郑婕, 侯书贵, 王叶堂, 等. 青藏高原冬季积雪时空变化特征及其与北极涛动的关系[J]. 地理研究, 2017, 36(4): 743-754. Qin Zhengjie, Hou Shugui, Wang Yetang, et al. Spatio-temporal variability of winter snow cover over the Tibetan Plateau and its relation to Arctic Oscillation[J]. Geographical Research, 2017, 36(4): 743-754. |
| [32] |
Chen Y H, Duan A M, Li D L. Connection between winter Arctic sea ice and west Tibetan Plateau snow depth through the NAO[J]. International Journal of Climatology, 2020, 41(2): 846-861. |
| [33] |
Otto-Bliesner B L, Brady E C, Fasullo J, et al. Climate variability and change since 850 CE: An ensemble approach with the Community Earth System Model[J]. Bulletin of the American Meteorological Society, 2016, 97(5): 735-754. DOI:10.1175/BAMS-D-14-00233.1 |
| [34] |
Hurrell J W, Holland M M, Gent P R, et al. The Community Earth System Model: A framework for collaborative research[J]. Bulletin of the American Meteorological Society, 2013, 94(9): 1339-1360. DOI:10.1175/BAMS-D-12-00121.1 |
| [35] |
符淙斌, 王强. 气候突变的定义和检测方法[J]. 大气科学, 1992, 16(4): 482-493. Fu Chongbin, Wang Qiang. The definition and detection of the abrupt climatic change[J]. Chinese Journal of Atmospheric Sciences, 1992, 16(4): 482-493. DOI:10.3878/j.issn.1006-9895.1992.04.11 |
| [36] |
Russell D R. Development of a time-domain, variable-period surface-wave magnitude measurement procedure for application at regional and teleseismic distances, Part Ⅰ: Theory[J]. Bulletin of the Seismological Society of America, 2006, 96(2): 665-677. DOI:10.1785/0120050055 |
| [37] |
Duchon C E. Lanczos filtering in one and two dimensions[J]. Journal of Applied Meteorology, 1979, 18(8): 1016-1022. DOI:10.1175/1520-0450(1979)018<1016:LFIOAT>2.0.CO;2 |
| [38] |
Bronnimann S, Franke J, Nussbaumer S U, et al. Last phase of the Little Ice Age forced by volcanic eruptions[J]. Nature Geoscience, 2019, 12(8): 650-656. DOI:10.1038/s41561-019-0402-y |
| [39] |
Ding Y N, Carton J A, Chepurin G A, et al. Ocean response to volcanic eruptions in Coupled Model Intercomparison Project 5 simulations[J]. Journal of Geophysical Research: Oceans, 2014, 119(9): 5622-5637. DOI:10.1002/2013JC009780 |
| [40] |
Bittner M, Timmreck C, Schmidt H, et al. The impact of wave-mean flow interaction on the Northern Hemisphere polar vortex after tropical volcanic eruptions[J]. Journal of Geophysical Research: Atmospheres, 2016, 121(10): 5281-5297. DOI:10.1002/2015JD024603 |
| [41] |
Gong D Y, Wang S W, Zhu J H. East Asian winter monsoon and Arctic Oscillation[J]. Geophysical Research Letters, 2001, 28(10): 2073-2076. DOI:10.1029/2000GL012311 |
| [42] |
He S P, Gao Y Q, Li F, et al. Impact of Arctic Oscillation on the East Asian climate: A review[J]. Earth Science Reviews, 2017, 164: 48-62. DOI:10.1016/j.earscirev.2016.10.014 |
| [43] |
Robock A, Mao J P. Winter warming from large volcanic eruptions[J]. Geophysical Research Letters, 1992, 19(24): 2405-2408. DOI:10.1029/92GL02627 |
| [44] |
Stenchikov G, Robock A, Ramaswamy V, et al. Arctic Oscillation response to the 1991 Mount Pinatubo eruption: Effects of volcanic aerosols and ozone depletion[J]. Journal of Geophysical Research, 2002, 107(D24). DOI:10.1029/2002jd002090 |
| [45] |
Zambri B, LeGrande A N, Robock A, et al. Northern Hemisphere winter warming and summer monsoon reduction after volcanic eruptions over the last millennium[J]. Journal of Geophysical Research: Atmospheres, 2017, 122(15): 7971-7989. DOI:10.1002/2017JD026728 |
| [46] |
Sun C, Li J P, Jin F F. A delayed oscillator model for the quasi-periodic multidecadal variability of the NAO[J]. Climate Dynamics, 2015, 45(7): 2083-2099. |
| [47] |
Trenberth K E, Shea D J. Relationships between precipitation and surface temperature[J]. Geophysical Research Letters, 2005, 32(14). DOI:10.1029/2005GL022760 |
| [48] |
田立德, 姚檀栋, 余武生, 等. 青藏高原水汽输送与冰芯中稳定同位素记录[J]. 第四纪研究, 2006, 26(2): 145-152. Tian Lide, Yao Tandong, Yu Wusheng, et al. Stable isotopes of precipitation and ice core on the Tibetan Plateau and moisture transports[J]. Quaternary Sciences, 2006, 26(2): 145-152. DOI:10.3321/j.issn:1001-7410.2006.02.001 |
| [49] |
Liu F, Chai J, Wang B, et al. Global monsoon precipitation responses to large volcanic eruptions[J]. Scientific Reports, 2016, 6. DOI:10.1038/srep24331 |
| [50] |
Man W M, Zhou T J, Jungclaus J H. Effects of large volcanic eruptions on global summer climate and East Asian monsoon changes during the last millennium: Analysis of MPI-ESM simulations[J]. Journal of Climate, 2014, 27(19): 7394-7409. DOI:10.1175/JCLI-D-13-00739.1 |
| [51] |
Higgins M E, Cassano J J. Impacts of reduced sea ice on winter Arctic atmospheric circulation, precipitation, and temperature[J]. Journal of Geophysical Research, 2009, 114(D16). DOI:10.1029/2009jd011884 |
| [52] |
Yuan C X, Tozuka T, Yamagata T. IOD influence on the early winter Tibetan Plateau snow cover: Diagnostic analyses and an AGCM simulation[J]. Climate Dynamics, 2012, 39(7-8): 1643-1660. DOI:10.1007/s00382-011-1204-0 |
| [53] |
Zhang Y, Zhou W, Chow E C H, et al. Delayed impacts of the IOD: Cross-seasonal relationships between the IOD, Tibetan Plateau snow, and summer precipitation over the Yangtze-Huaihe River region[J]. Climate Dynamics, 2019, 53(7-8): 4077-4093. DOI:10.1007/s00382-019-04774-5 |
| [54] |
Maher N, McGregor S, England M H, et al. Effects of volcanism on tropical variability[J]. Geophysical Research Letters, 2015, 42(14): 6024-6033. DOI:10.1002/2015GL064751 |
| [55] |
Su F, Duan X L, Chen D L, et al. Evaluation of the global climate models in the CMIP5 over the Tibetan Plateau[J]. Journal of Climate, 2013, 26(10): 3187-3208. DOI:10.1175/JCLI-D-12-00321.1 |
| [56] |
Swingedouw D, Mignot J, Ortega P, et al. Impact of explosive volcanic eruptions on the main climate variability modes[J]. Global and Planetary Change, 2017, 150: 24-45. DOI:10.1016/j.gloplacha.2017.01.006 |
| [57] |
Chylek P, Folland C K, Lesins G, et al. Arctic air temperature change amplification and the Atlantic Multidecadal Oscillation[J]. Geophysical Research Letters, 2009, 36(14). DOI:10.1029/2009gl038777 |
| [58] |
Wang J L, Yang B, Ljungqvist F C, et al. The relationship between the Atlantic Multidecadal Oscillation and temperature variability in China during the last millennium[J]. Journal of Quaternary Science, 2013, 28(7): 653-658. DOI:10.1002/jqs.2658 |
2 Key Laboratory of Cenozoic Geology and Environment, Institute of Geology and Geophysics, Chinese Academy of Sciences, Beijing 100029;
3 Center for Excellence in Life and Paleoenvironment, CAS, Beijing 100044;
4 College of Earth and Planetary Sciences, University of Chinese Academy of Sciences, Beijing 100049;
5 State Key Laboratory of Numerical Modeling for Atmospheric Sciences and Geophysical Fluid Dynamics, Institute of Atmospheric Physics, Chinese Academy of Sciences, Beijing 100029;
6 State Key Laboratory of Earth Surface Processes and Resource Ecology, Beijing Normal University, Beijing 100875)
Abstract
Volcanic eruption is the most important natural forcing driving climate change over the past millennium. The decadal-scale impact of volcanic eruptions on the regional climate is still unclear prior to instrumental observations, partly due to the inconsistency between model data and reconstruction. The multi-model ensemble mean of the global mean surface temperature(GMST) of Coupled Model Intercomparison Project phase 5(CMIP5) and GMST reconstructed by Past Global Changes(PAGES) 2k consortium are distinctly consistent in decadal variability during mid-fifteenth century, which provides the time windows to reveal the influences of the natural factors on climate change and avoids the mismatch between model data and proxy reconstruction. Based on the Community Earth System Model Last Millennium Ensemble(CESM-LME), we explore the decadal variations of temperature, precipitation and hydro-thermal combination in the Tibetan Plateau and Arctic after the two volcanic eruptions during mid-fifteenth century. Firstly, we select four ensemble members that are highly correlated with the proxy reconstruction from PAGES2k GMST project. Secondly, to evaluate the decadal-scale climate impact of these two volcanic eruptions over mid-fifteenth century, we select two 30-years periods(1422~1451 A.D. and 1445~1474 A.D) that two tropical volcanic eruption were predicted to occur over the later period and none occurred over the previous period. In addition, there isn't abrupt change for the other forcings over the periods.Results show the mean area-averaged summer temperature of the Tibetan Plateau(Arctic) is reduced by approximately 0.14~0.29℃(0.13~0.21℃) relative to the previous period during 1445~1474 A.D., which is comparable to the single-forcing(volcanic forcing) ensemble members. This indicates that the Tibetan Plateau and Arctic experienced decadal-scale reduction in temperature and precipitation, and the conditions of hydro-thermal combination became drier and colder.The mechanism analysis shows that the volcanic forcing is a dominant factor to drive the summer temperature over the decadal-scale in the Tibetan Plateau and Arctic during mid-fifteenth century, and the volcanic forcing indirectly modulates the winter temperature and precipitation in the two regions through the Arctic Oscillation (AO) and Atlantic Meridional Overturning Circulation(AMOC). The results imply that the potential volcanic forcing should been considered in prediction of decadal climate change over the Tibetan Plateau and Arctic. 2021, Vol.41

