2 National Institute of Oceanography and Applied Geophysics, Borgo Grotta Gigante 42/C, 34010 Sgonico, TS, Italy;
3 青岛海洋科学与技术试点国家实验室, 同位素与地质年代测定平台, 山东 青岛 266200)
末次冰期时大气二氧化碳分压(pCO2atm)比工业革命低80~100 ppmv[1]。现有研究普遍认为, 冰期较低的二氧化碳(CO2)水平需要增加深层水团与大气的隔离度, 例如通过增加海洋成层化[2~5], 使大气CO2以呼吸碳(respired carbon)、有机碳与碳酸盐的形式储存在大洋深部[2]。
南大洋被认为是全球重要的“碳汇”区和世界大洋流通环节中中层水与深层水的来源之一, 通过影响全球pCO2atm和全球大洋环流对全球气候变化产生重要影响, 亦是全球气候变化的敏感区。例如Sigman和Boyle[2]、François等[6]的研究推断南大洋在调节大气CO2方面起着至关重要的作用, 因为南大洋环流的变化可能调节了深海和大气之间的CO2交换。Anderson等[7]的研究显示, 末次冰消期南大洋的3个扇区(大西洋、印度洋和太平洋扇区)均呈现出生物硅埋藏速率增加、冰消期上升流增强与大气CO2上升同时发生, 并由此得出, 大气CO2浓度上升与南大洋深层水的通风增强有关。“通风假说”认为, 冰期时储存在大洋深部的碳, 在冰消期南大洋深部流通性增强的条件下, 经深层水上涌将CO2释放到大气中, 造成大气pCO2的升高, 从而影响全球气候变化[8~11]。东南太平洋中层水的记录表明[12], 在冰消期, 其溶解氧浓度降低, 这可能与南大洋低溶解氧水体的上涌有关, 上涌水团通过南极中层水(Antarctic Intermediate Water, 简称AAIW)将低溶解氧水体向北输送至太平洋。另外, Siani等[13]的研究发现, 冰消期时海洋表层碳储库年龄比全新世大, 并且其增大的时期与南大洋垂向混合的时间相关, 表明南大洋上涌事件与冰期大气CO2上升之间存在强相关。以上这些研究都为南大洋深层水在冰消期上涌的假说提供了有力的证据。
大洋通风变化和气候变化之间存在同步联系[14]。有研究认为冰消期南大洋深层水上涌的强度取决于南半球西风带(Southern Hemisphere Westerly Winds Belt, 简称SWW)的强度和位置的变化, 这可能是末次冰消期海洋CO2释放的主要途径[2, 5, 8~9, 15~19]。还有研究认为是冰消期时北大西洋深层水(North Atlantic Deep Water, 简称NADW)生成情况的改变影响了南大洋深部流通性进而影响大气pCO2[20~23]。最新研究发现, 南大洋罗斯海似乎可以通过其自身底层水的向北扩张与向极后撤进一步影响南大洋深部流通状况[24]。近年来国际大洋发现计划(IODP)374航次和我国南极科学考察都不约而同地将罗斯海作为未来南大洋考察的重点海域, 然而来自罗斯海的沉积记录仍较为匮乏。因此, 进一步深入分析和研究南极罗斯海古海洋记录, 可为讨论深层水流通性对大气pCO2的影响提供重要参考。
本文基于南极极锋(Antarctic Polar Front, 简称APF)以南罗斯海陆坡和海盆区3根插管样岩芯沉积物的生物硅含量和浮游有孔虫碳同位素比值(Nps-δ13C)等资料, 重建了末次冰消期南大洋深层水上涌的沉积记录, 进而分析该海区对冰消期大气CO2浓度上升的贡献及其对气候变化的响应。
1 研究区概况罗斯海(72°~85°S, 158°W~170°E) 位于南大洋太平洋扇区, 是南大洋的第二大边缘海, 位于阿代尔角(Cape Adare)和科尔贝克角(Cape Colbeck)之间的一个三角状海域, 180°经线穿过其中西部[25], 是南极底层水(Antarctic Bottom Water, 简称AABW)的主要生成地[26~27]。区域内的罗斯冰架(Ross Ice Shelf, 简称RIS)是世界上最大的冰架, 主要由东南极冰盖(East Antarctic Ice Sheet, 简称EAIS)供给其西部, 主要由西南极冰盖(West Antarctic Ice Sheet, 简称WAIS)供给其中部和东部[28~29]。罗斯海陆架上分布着过去冰流(Ice Stream)产生的一系列东北-西南向的海槽[30], 呈现海槽与浅滩相间分布的特点(图 1a)。
|
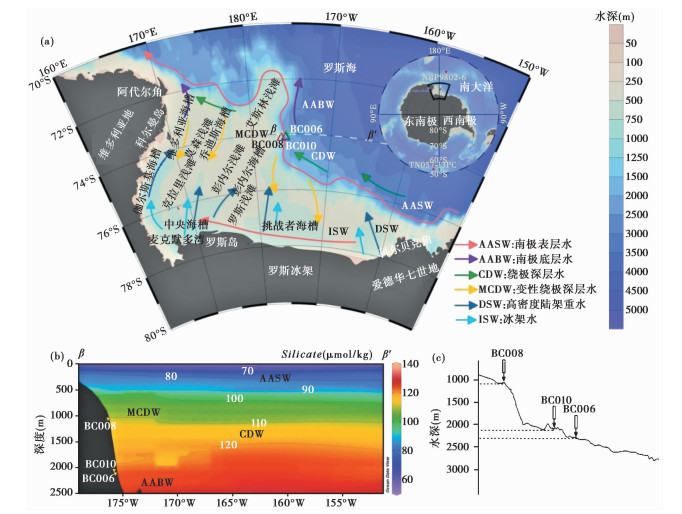
图 1 南极罗斯海BC008、BC010和BC006岩芯的取样位置以及区域洋流和74°S断面硅酸盐分布 (a)罗斯海区域环流情况[29~30], β-β′为74°S断面;(b)β断面的硅酸盐分布剖面图;(c)3个岩芯垂向分布及水深 Fig. 1 Sampling location of the cores BC008, BC010 and BC006 in the Ross Sea, Antarctica, oceanic circulations and silicate distribution of 74°S cross section. (a)Circulations in the Ross Sea[29~30], β-β′ is 74°S cross section; (b)Profile of silicate distribution in section β; (c)Vertical distribution of three cores and water depth |
罗斯海海域内的洋流系统和水团主要有:绕极深层水(Circumpolar Deep Water, 简称CDW)、变性绕极深层水(Modified Circumpolar Deep Water, 简称MCDW)、南极表层水(Antarctic Surface Water, 简称AASW)、高密度陆架重水(Dense Shelf Water, 简称DSW)、冰架水(Ice Shelf Water, 简称ISW)和AABW。
绕极深层水(CDW)较为温暖, 携带丰富营养物质, 在罗斯海地区上涌, 进一步加速了海冰的融化, 与其他水团混合后转变成变性绕极深层水(MCDW)流入罗斯海陆架[31~32]。由于MCDW较为温暖, 盐度较低[33], 对陆架上的冰和生物生产力会有很大影响。南极表层水(AASW)主要由陆架上产生的盐度较低的冰融水和富含营养物质的CDW上涌水团组成, 是罗斯海变化较大的水团[34], 位于水体表层, 低盐、密度较小。高密度陆架重水(DSW)是海冰形成时产生的卤水, 具有低温、高盐、高密度的特点。因其密度较大可沿陆坡下沉, 由于科氏力的影响左偏汇入AABW[35]。DSW的形成过程受罗斯冰架进退的影响[36]。冰架水(ISW)的温度、盐度和密度相对较低, 由冰川消融产生, 位于DSW之上, AASW之下[37], 沿西北方向流动, 在陆架坡折带同其他水团混合汇入AABW[33]。AABW是低温、高盐、高氧的水团, 由AASW、ISW和DSW混合后形成于陆架边缘至邻近海盆底层[38](图 1)。
2 样品与方法 2.1 样品采集本文研究所使用样品为2017年1~3月意大利第32次南极科学考察OGS-Explora号航次获取的3个高质量插管沉积物岩芯(BC008、BC010和BC006), 其采样点位于罗斯海陆坡及邻近海盆区(图 1), 站位信息如表 1所示。其中, BC008岩芯水深1063m, 总长度27cm;BC010岩芯水深2055m, 总长度44cm;BC006岩芯水深2120m, 总长度54cm。另外还有3个参考站位NBP9802-6、TN057-13PC和V19-30(见表 1)。
| 表 1 南极罗斯海陆坡研究站位及参考站位信息表 Table 1 Information table of research stations on the slope of the Ross Sea, Antarctica and reference stations |
沉积物粒度变化特征显示3根岩芯的岩性主要为砂质粉砂和粉砂质砂。如图 2所示, 根据3根岩芯的颜色、岩性特征及生物组分特征, 可将沉积物岩芯分为8层, 其中BC008包含前4层, BC010包含前7层, BC006包含8层, 具体分层描述见表 2。

|
图 2 罗斯海3个岩芯的岩性特征对比 Fig. 2 Lithologic characteristic of three cores of the Ross Sea |
| 表 2 罗斯海3个岩芯层位描述表 Table 2 The lithologic description of three cores of the Ross Sea |
根据研究目标, 将岩芯沉积物样按照1cm间隔取样, 分别进行了浮游有孔虫氧碳同位素和生物硅含量分析, 同时挑选沉积物中适合的测年样品进行加速器质谱仪放射性碳(accelerator mass spectrometer radiocarbon, 简称AMS14C)方法测年。
2.2.1 有孔虫氧、碳同位素测试由于水深较深的BC010与BC006岩芯沉积物中缺乏有孔虫等钙质生物壳体, 无法满足该项测试需求, 故仅对BC008岩芯27个样品进行浮游有孔虫Neogloboquadrina pachyderma(左旋, Nps)的氧、碳同位素测试。每个样品选取25~30枚壳体, 挑选的有孔虫壳体干净完整, 粒径范围约为200~250μm。从样品中选取符合要求的有孔虫壳体, 在显微镜下用解剖针将其破碎, 用浓度高于99.7 % 的酒精置于频率为40Hz的超声波中震荡清洗3次, 每次持续时间5~10 s。将洗涤好后的有孔虫壳体放置在60℃的烘箱中干燥5 h, 随后将样品转移至Finnigan自动碳酸钙制样装置中(Kiel Ⅲ型), 与原磷酸在70℃高温下发生反应, 收集反应生成的CO2气体, 将其转移至Finnigan MAT 252型稳定同位素质谱仪中, 对氧、碳同位素值进行测试。测试精度参照中国国家标准(GBW04405)和标准(NBS19), 并以PDB(Pee Dee Belemnite)标样进行误差标定。该测试在同济大学海洋地质国家重点实验室完成。
2.2.2 生物硅测试取研磨至200目的沉积物0.05g, 加入5 % 的氢氧化钠(NaOH)溶液后置于85℃的烘箱中加热反应6 h, 离心取上清液, 移取1ml样品原液至50ml的容量瓶中, 加入2ml显色剂, 然后加入去离子水至50ml标线, 混匀待测。使用棱光-721分光光度计, 将波长调至380 nm, 用1cm比色皿比色, 记录吸光值Ai, 共测试样品125个, 其中包括BC008岩芯27个、BC010岩芯44个、BC006岩芯54个。绘制溶解二氧化硅(SiO2)含量随时间变化曲线, 外推截距计算生物硅含量。该测试在自然资源部第一海洋研究所海洋地质与成矿作用重点实验室完成。
2.2.3 AMS14C测年共完成包括3个浮游有孔虫(Nps)和16个总有机碳样品的年代测试(表 3)。3个浮游有孔虫测年均在BC008岩芯, 其中1~2cm和7~8cm层位的浮游有孔虫AMS14C测试在美国BETA实验室完成。BC008岩芯26~27cm层位的有孔虫AMS14C测试和其余16个有机碳AMS14C测试均在青岛海洋科学与技术试点国家实验室同位素与地质年代测试平台完成。
| 表 3 BC008、BC010和BC006岩芯的AMS14C测年结果及校正年龄 Table 3 AMS 14C dating results and calibrated ages of cores BC008, BC010 and BC006 in the Ross Sea |
罗斯海沉积物中生源钙含量很少, 在本文研究的3个岩芯中, 仅在水深最浅(1063m)的BC008岩芯存在足够的有孔虫壳体用于年代测定。所以3个岩芯的AMS14C测年工作是基于有孔虫和有机碳两种材料进行的(表 3), 共计得到19个测试结果, 包括BC008岩芯中7~8cm和26~27cm层位两种材料的AMS14C测年和BC010岩芯10~11cm和30~31cm层位的重复样测试。BC010岩芯10~11cm和30~31cm层位的重复样测试结果显示分别存在±960a和±500a误差, 误差范围 < 1000a。
BC008岩芯的3个有孔虫AMS14C测年层位分别为1~2cm层、7~8cm层和26~27cm层, 且通过7~8cm和26~27cm层位的不同材料测年结果得到两种材料的年龄差值分别为1887a和3261a, 取二者平均值2574a作为BC008岩芯的有机碳校正年龄, 对22~23cm层位有机碳测年结果进行老碳年龄校正。碳储库校正年龄根据Domack等[41]的研究选择830±40a, 采用Calib.7.0.2软件和Marine 13校正曲线[42]校正后, 通过内插和外推计算得到BC008岩芯的年龄框架。经与该岩芯浮游有孔虫氧同位素记录和南极塔洛斯冰芯(Talos Dome Ice Core)[43]对比, 验证了该年龄模式是较为可靠的。
BC006岩芯的有机碳校正年龄是按照相邻层位(1.5~5.5cm)的沉积速率外推至0cm而得到的年龄, 为2268a。BC010岩芯的有机碳校正年龄是通过地层层序对比获得, BC010岩芯20~21cm的深褐色层位对应于BC006岩芯12~13cm的深褐色层位(图 2), 对应年龄差值为8371a, 作为BC010岩芯的有机碳校正年龄。最后剔除掉4个可能受到老碳效应影响而呈现出倒转的年龄控制点, 3个岩芯总共得到11个有效地层年代控制点(表 3)。
结合沉积物的颜色旋回, 通过线性内插及外推, 得到BC008岩芯顶部年龄为6.0kaB.P., 底部年龄为14.8kaB.P.;BC010岩芯顶部年龄为0kaB.P., 底部年龄为15.5kaB.P.;BC006岩芯顶部年龄为0kaB.P., 底部年龄为22.3kaB.P.。
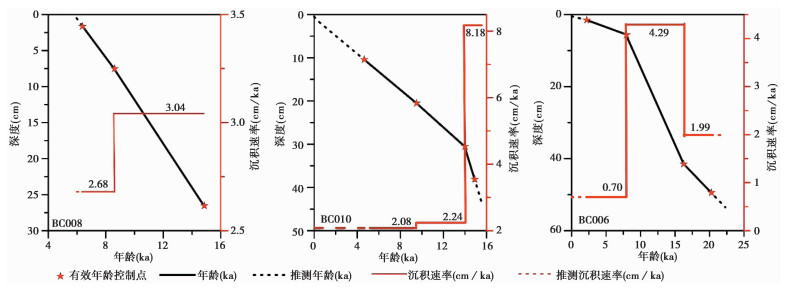
3个岩芯各阶段的沉积速率(图 3)不一。BC008岩芯的年龄范围为14.8~6.0kaB.P., 平均沉积速率约为3.0cm/ka;BC010岩芯整体平均沉积速率约为2.8cm/ka, 15.5~14.0kaB.P. 时期沉积速率较高, 约为8.2 cm/ka, 14.0~4.7 ka B.P. 时期约为2.2 cm/ka, 4.7kaB.P. 以来约为2.1cm/ka;BC006岩芯整体平均沉积速率约为2.4cm/ka, 22.3~16.3kaB.P. 时期沉积速率约为2.0cm/ka, 16.3~7.9kaB.P. 时期较高, 约为4.3cm/ka, 7.9kaB.P. 以来较低, 约为0.7cm/ka。
|
图 3 3个岩芯的年龄模式与沉积速率 Fig. 3 Age models and sedimentation rates of three cores in the Ross Sea |
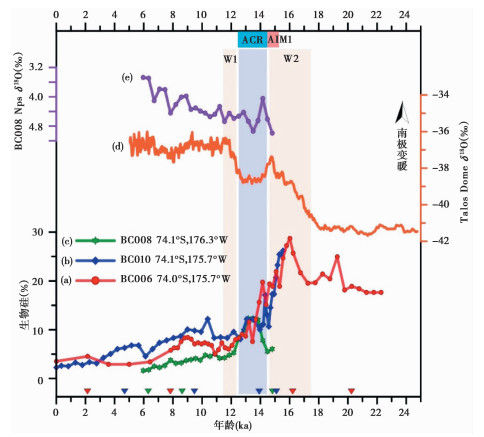
BC008岩芯浮游有孔虫Nps的氧同位素比值δ18O在3.5 ‰ ~5.0 ‰之间变化(表 4), 约在14.5~12.5 kaB.P. 时期, Nps-δ18O偏重, 与Talos Dome-δ18O变化[43]均指示南极冷反转(Antarctic Cold Reversal, 简称ACR)时期气候变冷;在12.5kaB.P. 以来, Nps-δ18O逐渐偏轻, 暗示研究海域次表层水和大气温度持续升高的趋势(图 4d和4e)。碳同位素比值Nps-δ13C在0.05 ‰ ~0.82 ‰之间变化, 均值为0.39 ‰ (表 4), 整体变化趋势与氧同位素比值δ18O的变化趋势相反, 在ACR时期偏轻, 达到极小值, 而后逐渐偏重(图 5b)。
| 表 4 3个岩芯分析指标的统计特征 Table 4 Analysis index characteristics of three cores in the Ross Sea |
|
图 4 3个岩芯的生物硅含量与BC008岩芯的浮游有孔虫氧同位素和Talas Dome冰芯氧同位素变化 (a~c)3个岩芯的生物硅含量;(d)Talos Dome冰芯的氧同位素比值δ18O[43];(e)BC008岩芯浮游有孔虫的Nps-δ18O倒三角形代表各岩芯的年龄控制点(其中绿色、蓝色、红色三角分别代表BC008、BC010和BC006岩芯的年龄控制点);蓝色阴影区域代表南极冷反转(Antarctic Cold Reversal, 简称ACR)时期, 浅粉色阴影区域W1和W2代表末次冰消期南大洋的两个温暖时期[13];ACR:南极冷反转;AIM1:南极同位素最大值事件1 Fig. 4 Variations of biogenic silica and oxygen isotope of three cores.(a~c)Biogenic silicon content; (d)δ18O in Talos Dome ice core[43]; (e)Nps-δ18O of planktonic foraminifera in core BC008. The inverted triangles represent the age control points of each core(green, blue and red triangles respectively represent the age control points of core BC008, BC010 and BC006); The blue shaded area represents the Antarctic cold reversal(ACR)period and the light pink shaded areas W1 and W2 represent the two warming periods of the Southern Ocean during the last deglaciation respectively[13]; ACR: Antarctic Cold Reversal; AIM1:Antarctica Isotope Maximum 1 |
|
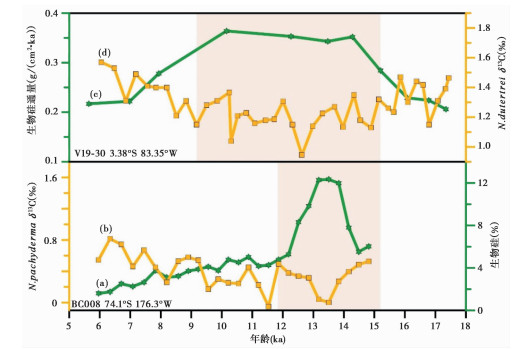
图 5 BC008岩芯与东赤道太平洋V19-30岩芯[39~40]的生物硅与有孔虫碳同位素(δ13C)的联系BC008岩芯生物硅含量(a)与有孔虫碳同位素(b)变化;V19-30岩芯生物硅通量[40](c)与有孔虫碳同位素[39] (d)变化;浅粉色阴影区域代表生物硅的高值 Fig. 5 Correlation between biological silicon and foraminiferal carbon isotopes(δ13C)of core BC008 and core V19-30[39~40] in the eastern Equatorial Pacific. Variation of biological silicon content (a) and foraminiferal carbon isotopes (b) of core BC008; Variation of biological silicon flux[40] (c) and foraminiferal carbon isotopes[39] (d) of core V19-30. The light pink shaded areas represent the high values of biological silicon |
由表 4可知, 罗斯海BC008、BC010和BC006岩芯沉积物中生物硅含量的变化范围分别为:BC008岩芯1.60 % ~12.34 %, 平均5.35 %;BC010岩芯2.26 % ~26.20 %, 平均10.21 %;BC006岩芯2.91 % ~28.72 %, 平均12.68 %。
3根岩芯沉积物生物硅含量的垂向变化趋势大致相似(图 4a、4b和4c):末次冰盛期(Last Glacial Maximum, 简称LGM)(23.0~18.5kaB.P.)生物硅含量呈增加趋势, 冰消期(18.5~12.0kaB.P.)含量较高, 并于16kaB.P. 时达到极大值, 其中ACR时期出现短暂停滞, 全新世以来, 生物硅含量持续下降, 低于10 %, 且较为稳定。
4 讨论 4.1 冰消期生物硅和碳同位素记录的深层水上涌增强南大洋初级生产力(硅藻等)对于溶解硅酸盐的消耗及其循环途径是有效固碳的首要前提[44]。硅藻生活在富营养区, 利用溶解的硅酸盐形成硅质生物壳体, 沉降并保存在海洋沉积物中[45]。尽管铁可能会限制单个硅藻细胞的生理状态和生长速率[46], 但是生物硅的生产率最终受到溶解硅酸盐的供应限制[47~48]。南大洋富营养的深层水团上涌增加了硅酸盐供应, 进而可能会促进APF以南的硅藻等硅质生物生产力, 以及沉积物中的生物硅埋藏[7]。由于现代高纬度南大洋的表层水体中硅酸盐缺乏, 可以利用生物硅的输出作为指示富硅深层水向表层上涌的指标[7, 49~50]。
一方面, 南大洋的生物硅保存效率与全球平均水平(2 % ~6 %)没有显著差异[47~48, 51];另一方面, 生物硅含量的变化与初级生产力的变化相吻合[45]。由此认为, 沉积物中生物硅含量的变化代表了生产力的变化而不是保存效率[45]。此外, 有研究通过砂组分含量评估陆源影响, 认为冰消期南大洋生物硅含量的变化可以忽略陆源以及风尘的影响[45]。
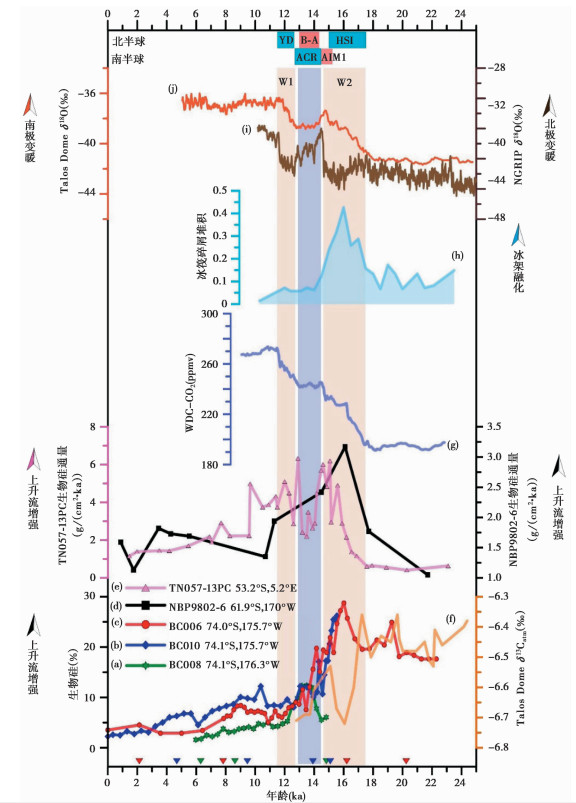
Anderson等[7]的研究发现, 冰消期时南大洋的3个扇面(大西洋、印度洋和太平洋扇面)的生物硅均明显增加。如图 6a~6e所示, 本研究中3根岩芯(BC008、BC010和BC006)生物硅含量值的变化, 整体与同在南大洋太平洋扇区的NBP9802-6岩芯生物硅通量的变化趋势一致[7], 呈现出在17.5kaB.P. 左右迅速增加, 并在约16.0kaB.P. 时达到极大值, 随后逐渐下降至约11.0kaB.P.。其中, ACR时期(14.5~12.5kaB.P.)的变化出现短暂停滞, 但ACR之后, 本研究3根岩芯生物硅含量并没有如大西洋扇区TN057-13PC岩芯记录的生物硅通量那样出现大幅度回升[7], 这可能是因为本研究中的3根岩芯均位于60°S以南的高纬度区, 以及其特殊的地形特征, 使得本研究区在ACR之后未捕捉到深层水上涌信号。冰消早期(约19.5~18.5kaB.P.), BC006岩芯的记录呈现出一次短暂的生物硅峰值, 说明本研究区在该时期也出现过一次上升流事件。这次短暂的上升流事件与Siani等[13]通过碳同位素记录确定的一次南大洋底层水上涌时间(18.5~18.0kaB.P.)相近, 0.5~1.0ka的时间偏差可能由年龄的不准确性所导致。
|
图 6 冰消期南大洋深层水上涌与其他气候指标变化之间的对比关系 (a~c)3个岩芯的生物硅含量变化;南大洋太平洋扇区NBP9802-6(d)和TN057-13PC (e)岩芯生物硅通量变化[7];(f)Talos Dome冰芯记录的大气碳同位素(δ13Catmo.)比值[52];(g)西南极冰芯(West Antarctic Ice Sheet Divide ice core, 简称WDC)记录的CO2浓度[53];(h)北大西洋冰山消融指数[54];(i)北格陵兰冰芯项目(North Greenland Ice Core Project, 简称NGRIP)冰芯[55]和(j)Talos Dome冰芯[43]记录的氧同位素(δ18O)变化倒三角形代表各岩芯的年龄控制点(其中绿色、蓝色、红色三角分别代表BC008、BC010和BC006岩芯的年龄控制点);蓝色阴影区域代表南极冷反转(ACR)时期, 浅粉色阴影区域W1和W2代表末次冰消期南大洋的两个温暖时期[13];ACR:南极冷反转;AIM1:南极同位素最大值事件1;YD:新仙女木事件;B-A:波令-阿勒罗德冰阶;HS1:海因里希冰阶1期 Fig. 6 The relationship between the upwelling of deep water in the Southern Ocean and the changes of other climatic indicators during the deglaciation period. (a~c)Biological silicon content changes of three cores; Biological silicon flux changes of core NBP9802-6 (d)and core TN057-13PC (e) in the Pacific sector of the Southern Ocean[7]; (f)Atmospheric carbon isotope (δ13Catmo.) ratios recorded by Talos Dome ice core[52]; (g)CO2 records of West Antarctic Ice Sheet Divide ice core(WDC)[53]; (h)Iceberg discharge indices from the North Atlantic [54]; Oxygen isotope(δ18O)changes recorded in North Greenland Ice Core Project(NGRIP)ice core (i)[55] and Talos Dome (j)[43]. The inverted triangles represent the age control points of each core(green, blue and red triangles respectively represent the age control points of core BC008, BC010 and BC006). The blue shaded area represents the Antarctic cold reversal(ACR)period, and the light pink shaded areas W1 and W2 represent the two warming periods of the Southern Ocean during the last deglaciation[13]; ACR: Antarctic Cold Reversal; AIM1:Antarctica Isotope Maximum 1; YD: Younger Dryas; B-A: Bølling-Allerød; HS1:Heinrich Stadial 1 |
冰消期沉积物中生物硅含量的这种变化很可能是表层水溶解硅供应增多导致, 与深层水团的上涌密切相关[7]。上涌的水团将深层水的化学信号(营养盐、碳同位素等)通过CDW带至APF以南的海洋表层, 一部分上涌的水团继续向南移动并逐渐失去浮力, 最终沿着南极海岸形成AABW[7]。本研究中74°S断面的硅酸盐分布呈现出由深海向表层递减的趋势(图 1b), 支持上述观点。与此同时, 如图 5a和5b所示, 伴随着深层水上涌强度的增大, BC008岩芯浮游有孔虫Nps-δ13C呈现出偏轻趋势, 与生物硅增加时期较为吻合, 表明上升水团在形成过程中也将深层水体的化学特征信号(如营养物质的浓度、溶解无机碳的δ13C等)携带至表层水体[7], 进一步验证了冰消期深层水上涌增强的观点。这与东赤道太平洋表层水的化学特征较为吻合[7, 39~40](图 5c和5d), 这或可指示末次冰消期, 南大洋富含营养物质的深层水上涌, 并进入亚南极模态水(Subantarctic Mode Water, 简称SAMW)的生成区域这一过程[56]。综上认为, 冰消期时罗斯海海域深层水的上涌增强, 在约16kaB.P. 时上涌最为剧烈。
4.2 冰消期南大洋深层水上涌的触发机制及其与大气CO2升高的联系触发南大洋深层水上涌的机制可能并不是单一机制, 且可能各阶段的触发机制会有不同。结合南大洋5根岩芯的生物硅变化(图 6a~6e)和两极冰芯的δ18O变化[43, 55](图 6i和6j)我们发现, 末次冰消期南大洋深层水上涌增强主要发生在南极的两个温暖时期W1 (12.5~11.5kaB.P.)和W2 (17.5~15.0kaB.P.), 而此时北极为寒冷期, 分别对应新仙女木时期(Younger Dryas, 简称YD)和海因里希冰阶1期(Heinrich-Stadial 1, 简称HS1)。由此猜测, 驱动冰消期南大洋深层水上涌的主要触发机制可能为两极跷跷板(bipolar-seesaw)[57]--南北两极热量分布不均。
冰消期早期, 全球性升温[24, 58~61], 由于北半球比南半球有更多陆地, 南北半球在升温的速度上会有差异。北半球温度波动较大[62], 升温较迅速, 由此导致北太平洋因大量冰融水的迅速注入而变冷, 而此时南大洋由于升温过程较为缓慢, 南极冰架融化速度较慢, 并不会像北太平洋那样因冰融水的注入产生很大的影响, 因此, 就出现了南北两极高纬度地区较大的温度差异(北冷南热), 进而导致热带辐合带(Intertropical Convergence Zone, 简称ITCZ)平均位置南移与南半球经向海水表层温度(Sea Surface Temperature, 简称SST)梯度减小[63], 使得赤道-南极之间的SST分布更均匀。南极气压相对减小也使得SWW位置开始向南移动[5], 可进一步导致南极温度迅速升高[5], 这使得南大洋的海冰覆盖面积减少, 海-气交换增强, 进而驱动南大洋深层水上涌[10, 24], 通风增强, 释放出被“封存”许久的大量CO2, 使得冰消期大气CO2浓度上升。该推测还需更多研究验证。
此外, 图 6h显示, 南大洋约16kaB.P. 时深层水上涌最剧烈, 对应北大西洋冰筏碎屑(Ice-Rafted debris, 简称IRD)极大值[54], 此时东南极冰芯Talos Dome中记录的大气δ13Catm也呈现极小值[52](图 6f)。可能由于北极冰架撤退, 冰山消融, 大量淡水注入导致大西洋经向翻转流(Atlantic Meridional Overturning Circulation, 简称AMOC)生成停滞[64], 这一过程可能使得南半球变暖, 导致南极冰架撤退, 促进CO2释放[65]。此外, 末次冰消期有两次大气CO2明显上升时期(HS1和YD)[66], 西南极冰芯(West Antarctic Ice Sheet Divide ice core, 简称WDC)记录的大气CO2浓度[53](图 6g)在HS1和YD两个时期也呈现出迅速上升趋势, 而本研究中罗斯海海域的生物硅和浮游有孔虫Nps-δ13C的沉积记录仅表明该海域在HS1时期深层水上涌增强, 对第1次大气CO2迅速上升起到一定的促进作用, 但对第2次大气CO2迅速上升没有明显记录, 表明YD时期大气CO2迅速上升是由南大洋其他海域或者其他地区的变化过程驱动, 这与Shuttleworth等[67]在亚南极大西洋海域与太平洋海域的研究结论较为吻合。
5 结论本研究通过对罗斯海陆坡和海盆区3个插管沉积物岩芯的生物硅含量及浮游有孔虫Nps碳同位素组成分析, 进一步证实了冰消期南大洋深层水上涌的假说及其与冰消期大气CO2上升的关系, 得到以下结论:
(1) 生物硅含量在末次冰消期较高, 且在约16kaB.P. 达到极大值, 指示冰消期时罗斯海海域深层水的上涌增强, 在约16kaB.P. 时最为剧烈。
(2) 南大洋深层水上涌增强, 增强了末次冰消期南大洋的垂向流通性, 将冰期埋藏在南大洋深层的CO2释放到大气中, 使大气CO2浓度上升。
(3) 南大洋通风增强伴随着浮游有孔虫Nps碳同位素比值的负偏, 指示南大洋上涌的水团将溶解的硅酸盐带至海洋表层的同时, 也将其他化学信号如碳同位素等通过CDW带至APF以南的海洋表层, 进一步验证了南大洋深层水上涌的假说。
(4) 末次冰消期, 南大洋深层水上涌增强的主要触发机制可能为两极跷跷板效应, 南北两极热量分布不均, 导致AMOC强度和SWW位置及强度的变化, 进而驱动南大洋深层水上涌。
(5) 罗斯海海域的生物硅和浮游有孔虫碳同位素的沉积记录仅表明该海域对末次冰消期第1次(HS1)大气CO2迅速上升起到一定的促进作用, 该海域对YD时期大气CO2迅速上升的驱动不明显。
致谢: 感谢意大利第32次南极科学考察航次全体工作人员为取得高质量岩芯的辛勤付出。感谢各位审稿专家和编辑部老师们提出的建设性修改意见。
| [1] |
Petit J R, Jouzel J, Raynaud D, et al. Climate and atmospheric history of the past 420, 000 years from the Vostok ice core, Antarctica[J]. Nature, 1999, 399(6735): 429-436. DOI:10.1038/20859 |
| [2] |
Sigman D M, Boyle E A. Glacial/interglacial variations in atmospheric carbon dioxide[J]. Nature, 2000, 407(6806): 859-869. DOI:10.1038/35038000 |
| [3] |
Peter Køhler, Fischer H, Munhoven G, et al. Quantitative interpretation of atmospheric carbon records over the last glacial termination[J]. Global Biogeochemical Cycles, 2005, 19(4): GB4020. DOI:10.1029/2004GB002345 |
| [4] |
Peacock S, Lane E, Restrepo J M. A possible sequence of events for the generalized glacial-interglacial cycle[J]. Global Biogeochemical Cycles, 2006, 20(2): GB2010. DOI:10.1029/2005GB002448 |
| [5] |
Toggweiler J R, Russell J L, Carson S R. Midlatitude westerlies, atmospheric CO2, and climate change during the ice ages[J]. Paleoceanography, 2006, 21(2): PA2005. DOI:10.1029/2005PA001154 |
| [6] |
Fran! ois R, Altabet M A, Yu E F, et al. Contribution of Southern Ocean surface-water stratification to low atmospheric CO2 concentrations during the last glacial period[J]. Nature, 1997, 389(6654): 929-935. DOI:10.1038/40073 |
| [7] |
Anderson R F, Ali S, Bradtmiller L I, et al. Wind-driven upwelling in the Southern Ocean and the deglacial rise in atmospheric CO2[J]. Science, 2009, 323(5920): 1443-1448. DOI:10.1126/science.1167441 |
| [8] |
Skinner L C, Fallon S, Waelbroeck C, et al. Ventilation of the deep Southern Ocean and deglacial CO2 rise[J]. Science, 2010, 328(5982): 1147-1151. DOI:10.1126/science.1183627 |
| [9] |
Hodgson D A, Sime L C. Palaeoclimate: Southern westerlies and CO2[J]. Nature Geoscience, 2010, 3(10): 666-667. DOI:10.1038/ngeo970 |
| [10] |
Anderson R F, Carr M E. Uncorking the Southern Ocean's vintage CO2[J]. Science, 2010, 328(5982): 1117-1118. DOI:10.1126/science.1190765 |
| [11] |
Fischer H, Schmitt J, Dieter L, et al. The role of Southern Ocean processes in orbital and millennial CO2 variations-A synthesis[J]. Quaternary Science Reviews, 2010, 29(1): 193-205. |
| [12] |
Muratli J M, Chase Z, Mix A C, et al. Increased glacial-age ventilation of the Chilean margin by Antarctic intermediate water[J]. Nature Geoscience, 2010, 3(1): 23-26. DOI:10.1038/ngeo715 |
| [13] |
Siani G, Michel E, De Pol-Holz R, et al. Carbon isotope records reveal precise timing of enhanced Southern Ocean upwelling during the last deglaciation[J]. Nature Communications, 2013, 4(4): 2758. |
| [14] |
杨岭, 周卫健, 程鹏. 末次冰消期太平洋地区大洋通风研究及展望[J]. 第四纪研究, 2020, 40(3): 712-725. Yang Ling, Zhou Weijian, Cheng Peng. Research and prospect of ventilation in the last deglaciation in the Pacific Ocean[J]. Quaternary Sciences, 2020, 40(3): 712-725. |
| [15] |
Marchitto T M, Lehman S J, Ortiz J D, et al. Marine radiocarbon evidence for the mechanism of deglacial atmospheric CO2 rise[J]. Science, 2007, 316(5830): 1456-1459. DOI:10.1126/science.1138679 |
| [16] |
Galbraith E D, Jaccard S L, Pedersen T F, et al. Carbon dioxide release from the North Pacific abyss during the last deglaciation[J]. Nature, 2007, 449(7164): 890-893. DOI:10.1038/nature06227 |
| [17] |
De Pol-Holz R, Keigwin L, Southon J, et al. No signature of abyssal carbon in intermediate waters off Chile during deglaciation[J]. Nature Geoscience, 2010, 3(3): 192-195. DOI:10.1038/ngeo745 |
| [18] |
Stott L, Southon J, Timmermann A, et al. Radiocarbon age anomaly at intermediate water depth in the Pacific Ocean during the last deglaciation[J]. Paleoceanography, 2009, 24(2): PA2223. DOI:10.1029/2008PA001690 |
| [19] |
Rose K A, Sikes E L, Guilderson T P, et al. Upper-ocean-to-atmosphere radiocarbon offsets imply fast deglacial carbon dioxide release[J]. Nature, 2010, 466(7310): 1093-1097. DOI:10.1038/nature09288 |
| [20] |
Sarmiento J L, Toggweiler J R. A new model for the role of the oceans in determining atmospheric pCO2[J]. Nature, 1984, 308(5960): 621-624. DOI:10.1038/308621a0 |
| [21] |
Siegenthaler U, Wenk T. Rapid atmospheric CO2 variations and ocean circulation[J]. Nature, 1984, 308(5960): 624-626. DOI:10.1038/308624a0 |
| [22] |
Monnin E, Indermühle A, Dllenbach A, et al. Atmospheric CO2 concentrations over the Last Glacial Termination[J]. Science, 2001, 291(5501): 112-114. DOI:10.1126/science.291.5501.112 |
| [23] |
Brix H, Rüdiger G. North Atlantic deep water and Antarctic bottom water: Their interaction and influence on the variability of the global ocean circulation[J]. Journal of Geophysical Research: Oceans, 2003, 108(C2): 3022. |
| [24] |
李铁刚, 王家凯. 末次冰消期以来南大洋深部流通性与大气pCO2的关系及其控制机制[J]. 海洋科学进展, 2016, 36(2): 159-170. Li Tiegang, Wang Jiakai. The relationship between deep ocean circulation and atmospheric pCO2 and its control mechanism since the last deglaciation[J]. Progress in Marine Science, 2016, 36(2): 159-170. |
| [25] |
滕聿央, 王汝建. 南极罗斯海表层沉积物中的放射虫组合分布及与其他硅质生物关系和环境生态意义[J]. 微体古生物学报, 2019, 36(4): 73-94. Teng Yuyang, Wang Rujian. Distribution of radiolarian assemblages in surface sediments of the Ross Sea, Antarctica and their relationship with other siliceous organisms and their environmental and ecological significance[J]. Journal of Microbody Paleontology, 2019, 36(4): 73-94. |
| [26] |
Whitworth T, Orsi A H. Antarctic bottom water production and export by tides in the Ross Sea[J]. Geophysical Research Letters, 2006, 331(12): 285-293. |
| [27] |
Budillon G, Castagno P, Aliani S, et al. Thermohaline variability and Antarctic bottom water formation at the Ross Sea shelf break[J]. Deep-Sea Research Part Ⅰ: Oceanographic Research Papers, 2011, 58(10): 1002-1018. DOI:10.1016/j.dsr.2011.07.002 |
| [28] |
Anderson J B, Shipp S S, Lowe A L, et al. The Antarctic ice sheet during the Last Glacial Maximum and its subsequent retreat history: A review[J]. Quaternary Science Reviews, 2002, 21(1): 49-70. |
| [29] |
宋乐慧, 韩喜彬, 李家彪, 等. 罗斯海西部末次冰盛期以来沉积环境重建: 有机碳与生物标志化合物分析[J]. 海洋学报(中文版), 2019, 41(9): 52-64. Song Lehui, Han Xibin, Li Jiabiao, et al. Reconstruction of sedimentary environment since the Last Glacial Maximum in western Ross Sea: Analysis of organic carbon and biomarkers[J]. Acta Oceanologica Sinica, 2019, 41(9): 52-64. DOI:10.3969/j.issn.0253-4193.2019.09.005 |
| [30] |
赵仁杰, 陈志华, 刘合林, 等. 15 ka以来罗斯海陆架岩芯沉积学记录及古海洋学意义[J]. 海洋学报(中文版), 2017, 39(5): 78-88. Zhao Renjie, Chen Zhihua, Liu Helin, et al. Sedimentary records and paleoceanographic significance of the Ross Sea shelf core since 15 ka[J]. Acta Oceanologica Sinica, 2017, 39(5): 78-88. DOI:10.3969/j.issn.0253-4193.2017.05.008 |
| [31] |
Dinniman M S, Klinck J M, Smith W O. A model study of circumpolar deep water on the West Antarctic Peninsular and Ross Sea continental shelves[J]. Deep-Sea Research Part Ⅱ: Topical Studies in Oceanography, 2011, 58(13): 1508-1523. |
| [32] |
Yokoyama Y, Anderson J B, Yamane M, et al. Widespread collapse of the Ross Ice Shelf during the Late Holocene[J]. Proceedings of the National Academy of Sciences of the United States of America, 2016, 113(9): 2354-2359. DOI:10.1073/pnas.1516908113 |
| [33] |
Picco P, Bergamasco A, Demicheli L, et al. Large-scale circulation features in the central and western Ross Sea (Antarctica)[M]//Faranda F M, Guglielmo L, Lanora A eds. Ross Sea Ecology. New York: Springer, 2000: 95-105. doi: 10.1007/978-3-642-59607-0_8.
|
| [34] |
Cincinelli A, Martellini T, Bittoni L, et al. Natural and anthropogenic hydrocarbons in the water column of the Ross Sea (Antarctica)[J]. Journal of Marine Systems, 2008, 73(1): 208-220. |
| [35] |
Basak C, Pahnke K, Frank M, et al. Neodymium isotopic characterization of Ross Sea bottom water and its advection through the southern South Pacific[J]. Earth and Planetary Science Letters, 2015, 419: 211-221. DOI:10.1016/J.EPSL.2015.03.011 |
| [36] |
Tamura T, Ohshima K I, Nihashi S. Mapping of sea ice productio for Antarctic coastal polynyas[J]. Geophysical Research Letters, 2008, 35(7): 284-298. |
| [37] |
Foldvik A, Gammelsrod T. Notes on Southern Ocean hydrography, sea-ice and bottom water formation[J]. Palaeogeography, Palaeoclimatology, Palaeoecology, 1988, 67(1): 3-17. |
| [38] |
Gordon A L, Zambianchi E, Orsi A, et al. Energetic plumes over the western Ross Sea continental slope[J]. Geophysical Research Letters, 2004, 30(21): 133-147. |
| [39] |
Shackleton N J, Hall M A, Line J, et al. Carbon isotope data in core V19-30 confirm reduced carbon dioxide concentration in the ice age atmosphere[J]. Nature, 1983, 24(306): 319-322. DOI:10.1038/306319a0 |
| [40] |
Bradtmiller L I. Diatom productivity in the equatorial Pacific Ocean from the last glacial period to the present: A test of the silicic acid leakage hypothesis[J]. Paleoceanography, 2006, 21(4): PA4201. DOI:10.1029/2006PA001282,200 |
| [41] |
Domack E, Leventer A, Dunbar R, et al. Chronology of the Palmer Deep site, Antarctic Peninsula: A Holocene palaeoenvironmental reference for the circum-Antarctic[J]. The Holocene, 2001, 11(1): 1-9. DOI:10.1191/095968301673881493 |
| [42] |
Reimer P J, Bard E, Bayliss A, et al. IntCal13 and marine13 radiocarbon age calibration curves 0-50, 000 years cal BP[J]. Radiocarbon, 2013, 55(4): 1869-1887. DOI:10.1017/S0033822200048864 |
| [43] |
Veres D, Bazin L, Landais A, et al. The Antarctic ice core chronology(AICC2012): An optimized multi-parameter and multi-site dating approach for the last 120 thousand years[J]. Climate of the Past, 2013, 9(4): 1733-1748. DOI:10.5194/cp-9-1733-2013 |
| [44] |
Ragueneau O, Tréguer P, Leynaert A, et al. A review of the Si cycle in the modern ocean: Recent progress and missing gaps in the application of biogenic opal as a paleoproductivity proxy[J]. Global and Planetary Change, 2000, 26(4): 317-365. DOI:10.1016/S0921-8181(00)00052-7 |
| [45] |
Tang Z, Shi X, Zhang X, et al. Deglacial biogenic opal peaks revealing enhanced Southern Ocean upwelling during the last 513 ka[J]. Quaternary International, 2016, 425: 1-8. DOI:10.1016/J.QUAINT.2016.09.020 |
| [46] |
Boyd P W, Watson A J, Law C S, et al. A mesoscale phytoplankton bloom in the Polar Southern Ocean stimulated by iron fertilization[J]. Nature, 2000, 407(6805): 695-702. DOI:10.1038/35037500 |
| [47] |
Pondaven P, Ragueneau O, Tréguer P, et al. Resolving the 'opal paradox' in the Southern Ocean[J]. Nature, 2000, 405(6783): 168-172. DOI:10.1038/35012046 |
| [48] |
Nelson D M, Anderson R F, Barber R T, et al. Vertical budgets for organic carbon and biogenic silica in the Pacific sector of the Southern Ocean, 1996-1998[J]. Deep-Sea Research Part Ⅱ, 2002, 49(9-10): 1645-1674. DOI:10.1016/S0967-0645(02)00005-X |
| [49] |
Gnanadesikan A, Toggweiler J R. Constraints placed by silicon cycling on vertical exchange in general circulation models[J]. Geophysical Research Letters, 1999, 26(13): 1865-1868. DOI:10.1029/1999GL900379 |
| [50] |
Meckler A N, Sigman D M, Gibson K A, et al. Deglacial pulses of deep-ocean silicate into the subtropical North Atlantic Ocean[J]. Nature, 2013, 495(7442): 495-498. DOI:10.1038/nature12006 |
| [51] |
Demaster D J. The accumulation and cycling of biogenic silica in the Southern Ocean: Revisiting the marine silica budget[J]. Deep-Sea Research Part Ⅱ: Topical Studies in Oceanography, 2002, 49(16): 3155-3167. DOI:10.1016/S0967-0645(02)00076-0 |
| [52] |
Jochen S, Robert S, Joachim E, et al. Carbon isotope constraints on the deglacial CO2 rise from ice cores[J]. Science, 2012, 336(6082): 711-714. DOI:10.1126/science.1217161 |
| [53] |
Buizert C, Adrian B, Ahn J, et al. Precise interpolar phasing of abrupt climate change during the Last Ice Age[J]. Nature, 2015, 520(7549): 661-665. DOI:10.1038/nature14401 |
| [54] |
Stern J V, Lisiecki L E. North Atlantic circulation and reservoir age changes over the past 41, 000 years[J]. Geophysical Research Letters, 2013, 40(14): 3693-3697. DOI:10.1002/grl.50679 |
| [55] |
North Greenland Ice Core Project NGRIP Members. High-resolution record of Northern Hemisphere climate extending into the last interglacial period[J]. Nature, 2004, 431: 147-151. DOI:10.1038/nature02805 |
| [56] |
Kalansky J, Rosenthal Y, Herbert T, et al. Southern Ocean contributions to the Eastern Equatorial Pacific heat content during the Holocene[J]. Earth and Planetary Science Letters, 2015, 424: 158-167. DOI:10.1016/j.epsl.2015.05.013 |
| [57] |
Stocker T F, Johnsen, S J. A minimum thermodynamic model for the bipolar seesaw[J]. Paleoceanography, 2003, 18(4): 1087. |
| [58] |
陈禹飞, 乔淑卿, 石学法, 等. 末次冰消期以来泰国湾沉积物物源变迁的元素地球化学证据[J]. 第四纪研究, 2020, 40(3): 726-738. Chen Yufei, Qiao Shuqing, Shi Xuefa, et al. Geochemical evidence for the sediment provenance evolution in the Gulf of Thailand since the last deglacial[J]. Quaternary Sciences, 2020, 40(3): 726-738. |
| [59] |
马乐, 肖海燕, 张鑫, 等. 福建仙云洞石笋记录的19.0-17.6 ka B. P. 期间东亚夏季风增强事件[J]. 第四纪研究, 2020, 40(4): 926-935. Ma Le, Xiao Haiyan, Zhang Xin, et al. An exceptionally strengthened East Asian summer monsoon event between 19.0 ka B. P. and 17.6 ka B. P. recorded in a stalagmite from Xianyun Cave, Fujian Province, Southeastern China[J]. Quaternary Sciences, 2020, 40(4): 926-935. |
| [60] |
肖霞云, 沈吉, 谭金凤. 末次冰消期滇西地区气候突变事件: 湖泊孢粉记录[J]. 第四纪研究, 2019, 39(4): 964-974. Xiao Xiayun, Shen Ji, Tan Jinfeng. Climatic abrupt events during the last deglaciation in the western Yunnan Province revealed by pollen records[J]. Quaternary Sciences, 2019, 39(4): 964-974. |
| [61] |
孙晓双, 张灿, 柴轶凡, 等. 云南高海拔湖泊对末次冰消期气候突变的响应[J]. 第四纪研究, 2019, 39(4): 975-984. Sun Xiaoshuang, Zhang Can, Chai Yifan, et al. High-altitude lake sediments in response to abrupt climatic events during the last deglaciation in Southwestern China[J]. Quaternary Sciences, 2019, 39(4): 975-984. |
| [62] |
Wang Z, Zhang X, Guan Z, et al. An atmospheric origin of the multi-decadal bipolar seesaw[J]. Scientific Reports, 2015, 5(1): 8909. DOI:10.1038/srep08909 |
| [63] |
Chiang J C H. The tropics in paleoclimate[J]. Annual Review of Earth and Planetary Sciences, 2009, 37(1): 263-297. DOI:10.1146/annurev.earth.031208.100217 |
| [64] |
Zhang X, Lohmann G, Knorr G, et al. Different ocean states and transient characteristics in Last Glacial Maximum simulations and implications for deglaciation[J]. Climate of the Past, 2013, 9(5): 2319-2333. DOI:10.5194/cp-9-2319-2013 |
| [65] |
Keeling R F, Stephens B B. Antarctic sea ice and the control of Pleistocene climate instability[J]. Paleoceanography, 2001, 16(1): 112-131. DOI:10.1029/2000PA000529 |
| [66] |
Bereiter B, Eggleston S, Schmitt J, et al. Revision of the EPICA Dome C CO2 record from 800 to 600 kyr before present[J]. Geophysical Research Letters, 2015, 42(2): 542-549. DOI:10.1002/2014GL061957 |
| [67] |
Shuttleworth R, Bostock H C, Chalk T B, et al. Early deglacial CO2 release from the Sub-Antarctic Atlantic and Pacific oceans[J]. Earth and Planetary Science Letters, 2020, 554: 116649. DOI:10.1016/J.EPSL.2020.116649 |
2 National Institute of Oceanography and Applied Geophysics, Borgo Grotta Gigante 42/C, 34010 Sgonico, TS, Italy;
3 Platform for Isotope and Geological Dating, Pilot National Laboratory for Marine Science and Technology, Qingdao 266200, Shandong)
Abstract
The Southern Ocean, also known as the Antarctic Ocean, is an enormous body of water. It plays an important role in the global carbon cycle and climate change because the ventilation of deep Southern Ocean is tightly linked to glacial-interglacial variations in atmospheric carbon dioxide(CO2). Being the second largest marginal sea of the Southern Ocean and one source of global ocean deep water, the Ross Sea is an ideal area for deep ocean ventilation and paleoceanography studies. In this study, three sedimentary cores BC008(74.13°S, 176.34°W; water depth 1063 m; length 27 cm), BC010(74.10°S, 175.77°W; water depth 2055 m; length 44 cm) and BC006(74.04°S, 175.67°W; water depth 2120 m; length 54 cm) retrieved from the slope and adjacent basin of the Ross Sea. These cores were mainly composed of sandy silt and silty sand and were selected for biogenic silica content and foraminifera isotope ratio analysis. The sedimentary record is dated using accelerator mass spectrometer radiocarbon(AMS 14C) methods on acid insoluble organic matter and foraminiferal calcite. The ages of BC008, BC010 and BC006 cores range from 6.0 ka B. P. to 14.8 ka B. P., from 0 to 15.5 ka B. P and from 0 to 22.3 ka B. P, respectively. The biogenic silica contents in the sediment are relatively high during the last deglaciation with the maximum value at about 16 ka B. P. indicate that the upwelling of deep water in the Ross Sea increased during this period and reach the most intense at about 16 ka B. P. The similar pattern on planktonic foraminifera Nps-δ13C changes during the last deglaciation indicate that the upwelling water masses in the Southern Ocean transmit not only dissolved silicate, but also some chemical signals such as carbon isotope to the surface water. In addition, the upward trend of deep water upwelling during the last deglaciation is consistent with the sharp increase of atmospheric CO2 concentration after the last deglaciation, which further verifies the hypothesis of deep water upwelling in the Southern Ocean and its contribution to the increase of atmospheric CO2 concentration. Moreover, the possible triggering mechanisms of deep water upwelling in the Southern Ocean during the last deglaciation are further discussed. The main trigger mechanisms may be the uneven distribution of heat between the north and the south poles, which resulting in changes in the location and intensity of the Southern Hemisphere Westerly Winds belt(SWW) and the strength of Atlantic Meridional Overturning Circulation(AMOC), thus driving the upwelling of deep water in the Southern Ocean. The sediment records of biogenic silica and carbon isotope ratio of planktonic foraminifera in the Ross Sea imply that the second rapid increase in atmospheric CO2(during YD) is driven by processes operating elsewhere in the Southern Ocean, or another region. 2021, Vol.41

