2 南京大学地理与海洋科学学院, 江苏省气候变化协同创新中心, 江苏 南京 210023)
东亚夏季风是全球季风环流系统的重要组成部分,在全球的水、热循环中占据重要位置。在东亚夏季风、印度季风和西风环流的综合影响下,过去地质时期东亚气候的长期演变存在较大的复杂性[1~2]。在轨道参数、温室气体及冰盖的驱动下,近两万年以来的全球气候经历了干冷的末次冰盛期(Last Glacial Maximum,简称LGM,约18~22 ka)和暖湿的全新世适宜期(Holocene Optimum,简称HO,约6~10 ka)等特征阶段[3~5]。东亚夏季风和西风环流共同控制下的东亚夏季风区北部(Northern East Asian Summer Monsoon,简称NEASM)气候较为干旱,环境对气候变化敏感[6],而东亚夏季风主控下的夏季风区南部(Southern East Asian Summer Monsoon,简称SEASM)气候湿润,环境对气候变化敏感度较低[7]。东亚夏季风区南、北部这种不同气候态,导致其在全球变化背景下的气候变化可能存在显著的区域差异。
地质记录及古气候模拟是揭示古气候演变特征及机制的主要手段[8~10]。地质记录的研究主要是依据代用指标反演过去的气候变化,并利用转换函数方法定量化重建过去的气候要素演变。基于各种地质环境指标——古土壤、古植被、湖泊沉积物、石笋氧同位素δ18O和黄土磁化率等[11~13],对东亚地区的古气候进行了重建,但相关的定量古降水、古温度等重建工作很少[14~15],并且定量化重建的结果之间存在较大差异。气候模式利用轨道参数以及地质资料所揭示的温室气体浓度、冰盖和海陆边界等作为边界条件驱动,可以对古气候演变过程进行近似再现,即古气候模拟[5, 16~17]。古气候模拟是建立在对气候变化的外强迫宏观机制和内在动力学微观机理合理认识的基础上,其对古气候演变的再现能力也得到了大量记录的验证。值得注意的一点是,古气候模拟存在误差,其仅是对古气候变化的近似再现。因此,只有将地质记录和古气候模拟相结合,才能有效提高对古气候演变特征以及机制的认识,进而更为深入的认识气候系统的演变规律,并为未来气候变化的预测提供参考。
TraCE- 21ka模拟(Transient Climate Evolution simulation over last 21000 years)是全球第一个使用复杂模式对过去21 ka全球气候的瞬变演变所开展的模拟工作[5, 18~19]。该模拟对冰期-间冰期的气候转换、Heinrich 1冷事件(H1)、Bølling-Allerød暖事件(BA)、新仙女木事件(Younger Dryas,简称YD)等一系列气候事件以及东亚季风的演变具有合理的再现能力[18, 20],为进一步研究东亚季风长时间尺度下的演变特征及机制提供了除记录之外的一个独立数据集。
本文从TraCE-21ka模拟对现代东亚气候空间格局模拟能力的评估和对东亚古夏季风时间演变的再现能力出发,通过模拟和地质记录在LGM和HO两个特征阶段对东亚夏季风区南部和北部两区域的分析与对比,揭示其异同,并探讨模拟和地质记录比对中差异的可能原因,进一步认识模拟的误差及地质记录的适用性,同时为未来古气候模拟的改进提供依据和参考。
1 研究资料 1.1 模拟资料模拟数据为TraCE-21ka全强迫的降水、地面温度和850 hPa风场,其空间分辨率为T31 (3.75°×3.75°)[21~22],时间上取10年平均的两万年以来的数据结果进行分析(http://www.cgd.ucar.edu/ccr/TraCE/)。
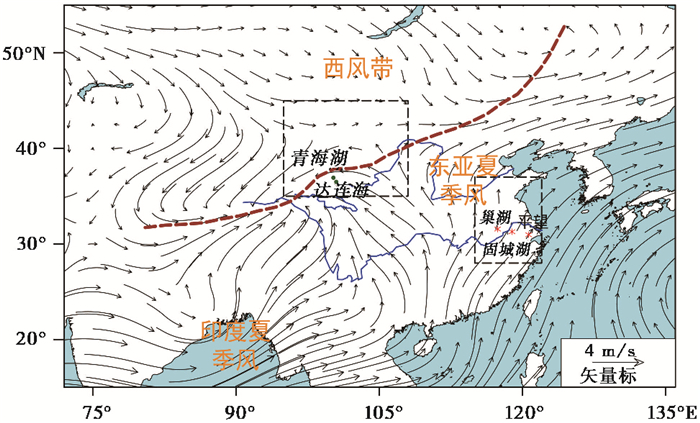
1.2 地质记录目前定量重建数据集较少,尤其是LGM时期。在与TraCE-21ka模拟详细的序列对比时,使用SEASM(28°~37°N,115°~122°E)区域内的巢湖(1)、固城湖(2)和苏州市吴江区平望镇(3)这3个长江中下游点位[23]和NEASM(35°~45°N,95°~108°E)区域内的青海湖(4)和达连海(5)两个青藏高原东北部的点位[24](图 1),以孢粉为基础的定量重建全新世以来的年降水、温度数据,以及NEASM区域内的青海湖(6)湖泊沉积物定量重建全新世以来夏季温度数据[25]。EASM北边界以及青藏高原区域见图 1标示[26];6个点位的详细地质信息来源于文献[25, 27~32](见表 1)。

|
图 1 基于NCEP再分析资料1979~2018年的夏季(6月、7月、8月)平均850 hPa风场 黑框分别指示代表SEASM和NEASM,棕色虚线表示现在EASM北边界[26];右下角为参考风标 Fig. 1 Summer(June-July-August/JJA)mean 850 hPa streamline based on NCEP Reanalysis 2 during 1979~2018. The black boxes indicate SEASM and NEASM, respectively. The brown dotted line indicates modern limit of EASM[26], and the lower right corner is a reference vector |
| 表 1 相关地质记录信息 Table 1 Relevant paleoclimate records information |
其他对比资料来源:Yan和Petit-Maire[33]对古气候记录重建结果进行集合而绘制的LGM以来季风边缘区的走向线;俞凯峰等[34]、Lu等[35]和Zhu等[36]整理出的LGM以来特征时段降水、温度的趋势及变幅。
1.3 观测数据使用Global Precipitation Climatology Centre(GPCC)从1901年开始的月平均降水数据,空间分辨率(1°×1°)(https://www.esrl.noaa.gov/psd/data/gridded/data.gpcc.html)[37]以及National Centers for Environmental Prediction(NCEP)与Department of Energy(DOE)合作的NCEP-DOE Reanalysis 2从1979年开始的月平均近地表温度和850 hPa风场数据,空间分辨率为(2.5°×2.5°)[38](https://www.esrl.noaa.gov/psd/data/gridded/data.ncep.reanalysis2.html)。
2 研究区域特征本文研究区域为东亚夏季风区,划分为夏季风区南部和北部。以夏季风主导的东亚夏季风系统有显著的时空差异。东亚夏季风(EASM)盛行偏南风,最早在5月中旬的南海地区爆发,从海洋带来大量水汽到季风区南部,经过两次北进和3次停滞,最后于7月下旬到达最北的干旱半干旱过渡区(图 1),然后于8月中旬迅速南撤到华南地区。夏季风降水呈从东南到西北内陆逐渐减少的带状分布,季风雨带随夏季风的季节进程逐次向北推进。4月、5月雨带在15°N南海地区(南海季风爆发),5月下旬和6月中旬雨带北进到江淮流域(江淮梅雨)及日本南部等广泛地区,到了7月继续北移至中国北部地区45°N附近,直至8月中下旬季风降雨迅速南撤至华南地区。此外,在夏季风区北部的西北干旱地带,受极地冰盖以及西伯利亚冷高压控制的高纬度气候变化可能会通过西风带的传输对东亚夏季风系统产生影响[39~40]。
通过对GPCC和NCEP的1979~2013年的现代观测数据分析,分别获取SEASM与NEASM区域平均降水和温度的相关信息。SEASM年累积降水1200 mm,夏季(6月、7月、8月)累积降水500 mm;年平均温度15 ℃,夏季平均温度24~25 ℃。NEASM年累积降水200 mm,夏季累积降水100 mm;年平均温度17 ℃,夏季平均温度30 ℃。季风降水主要集中在夏季,NEASM降水年较差大于SEASM。
3 结果与讨论 3.1 气候模式模拟能力评估气候模式能否从空间格局上合理模拟出现代东亚气候特征是评估其模拟好坏的一个标准,只有合理模拟年和季节性降水、温度的气候态,才可以认为其模拟可信度高[41~42]。因此本文首先将TraCE-21ka模拟现在时期(0 ka)的年及夏季降水、温度的气候态与基于GPCC与NCEP的现代观测的结果对比分析,评估TraCE-21ka模拟其对现代东亚气候空间格局的模拟能力。图 2所示,观测的降水大值区在华南,呈从东南向西北内陆递减的带状分布(图 2a和2b),而模拟的降水由于分辨率较粗大值区相比较观测范围广,且在青藏高原东侧存在一个大值中心(图 2c和2d)。观测和模拟的温度呈南部高北部低的特征,模拟的温度相比较观测在空间格局一致但普遍偏冷约3~6 ℃,且在青藏高原上存在一个低值中心。因此,TraCE-21ka模拟对现代东亚气候有较好的模拟能力,而模拟在青藏高原周边地区出现的虚假中心可能来源于TraCE-21ka模拟的瞬变敏感性较低,在粗分辨率模拟的前提下,对青藏高原高大地形的平滑效应导致各气候要素模拟误差从LGM时期开始随积分不断累积[43~45]。

|
图 2 基于GPCC和NCEP的现代观测(1979~2013年)年(a)与夏季(b)累积降水(填色)以及平均气温(等值线),基于TraCE-21ka模拟的现在时期(0 ka)年(c)与夏季(d)累积降水(填色)以及平均气温(等值线) Fig. 2 Modern annual(ANN) (a)and summer(JJA) (b)accumulated precipitation(colour filling)and mean temperature(contour line)based on GPCC and NCEP during 1979~2013, current(0 ka)ANN (c) and JJA (d) accumulated precipitation(colour filling) and mean temperature(contour line)based on TraCE-21ka simulation |
为了进一步评估模式模拟东亚地区气候要素空间格局的能力是否存在区域差异,基于图 2结果计算了整个东亚以及SEASM、NEASM的TraCE-21ka模拟相对于观测气候态的空间相关系数。因为各种数据分辨率不同,将模拟和观测资料统一插值到1°×1°的空间分辨率上。插值处理后3个地区空间格点数分别为:整个东亚(Full)有4500个空间格点,SEASM有63个空间格点,NEASM有130个空间格点。如表 2所示,整个东亚空间相关性较高,TANN相关系数0.93,TJJA相关系数0.87,而降水相关性较温度偏低,PANN相关系数0.76,PJJA相关系数0.64,可能是受模拟在青藏高原东侧虚假降水中心的影响。无论是降水还是温度,SEASM都要比NEASM相关性高,较特殊是NEASM的TJJA相关系数0.27。这种NEASM显著的空间分布差异可能来源于粗分辨率模拟下靠近青藏高原的边缘地区地形的平滑效应,使得其在削弱海拔高度下的夏季温度差异尤其明显[43~44]。
| 表 2 基于TraCE-21ka模拟的现在时期(0 ka)与基于GPCC和NCEP的现代观测(1979~2013年)在整个东亚(Full)以及SEASM、NEASM的空间相关系数 Table 2 Spatial correlation coefficient of East Asia(Full), SEASM and NEASM between the current period (0 ka) of TraCE- 21ka simulation and GPCC/NCEP during 1979~2013 |
综合而言,TraCE- 21ka模拟对现代东亚气候大尺度空间分布格局模拟可信度相对较高,对温度的模拟性能尤其优越。然而由于分辨率的不足以及SEASM、NEASM区域样本数目较少可能存在单一格点偏差被放大,对局地而言SEASM要优于NEASM,且相对于温度,降水的模拟性能要好。
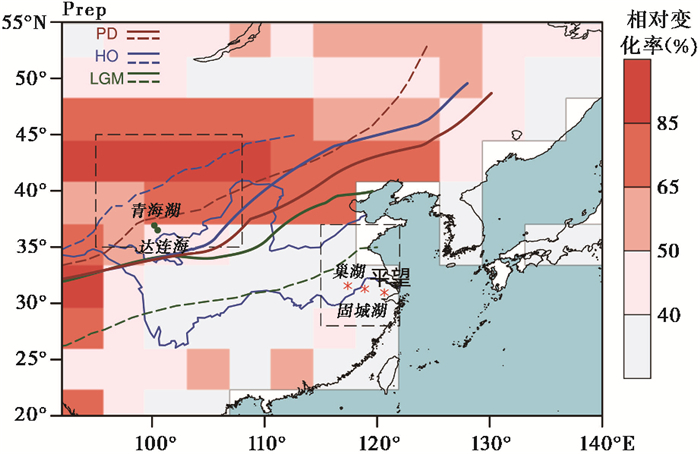
季风演变主要表现为季风风场和降水的变化,东亚古夏季风强度最好的指标是季风区的偏南风和中国北方区的降水[18, 46]。相对于现代时期,东亚地区在HO时期季风区面积增大,季风增强以及季风降水增加;LGM时期季风区面积减少,季风减弱以及季风降水减少[41]。季风降水被认为是控制沙漠和沙地边界线变化最重要的因素[6, 47],干旱-半干旱边界线位置可以体现季风的强弱,继而其在过去的移动位置变化能反映古夏季风的演变[48]。气候模式如若通过这种方式合理再现东亚古夏季风的时间演变,可以认为其模拟可信度高(图 3)。

|
图 3 两万年以来东亚夏季风的气候演变 图 3中填色是基于TraCE-21ka模拟的夏季降水相对变化((最大值-最小值)/0 ka气候态),实线是基于TraCE-21ka模拟的季风边缘线的南北摆动(夏季径向风速V850为0),虚线是Yan和Petit-Maire[33]绘制的干旱-半干旱区边界线;字体颜色与实虚线颜色一一对应“PD”、“HO”和“LGM”分别表示现在(0 ka)、全新世暖期(6~10 ka)和末次冰盛期(18~22 ka) Fig. 3 Climate change of East Asian summer monsoon during the past 20 000 years. The relative variation of summer precipitation based on TraCE- 21ka simulation is indicated by a color fill, the north-south oscillation of EASM boundary line(VJJA, 850=0)based on TraCE-21ka simulation is indicated by three solid lines, the arid and semi-arid boundary line drawn by Yan and Petit-Maire[33]is indicated by three dotted line."PD", "HO" and "LGM" symbolize three periods, here font colors corresponds to these solid/dotted line colors |
Yan和Petit-Maire[33]基于古气候记录重建结果绘制了LGM、HO和现在时期的干旱-半干旱边界线,即季风边缘区(图 3中虚线)。边界线呈西南-东北走向,在现阶段位置是从长江和黄河源头经内蒙地区直至东北平原,在HO时期整条线向北推进至蒙古国和中国内蒙交界地区,而在LGM时期向南撤经长江中游直至山东和江苏交界处,表明东亚季风区范围先向北扩展再向南收缩[48~49]。本文将TraCE-21ka模拟的夏季径向风速V850为0的这条线定义为季风边缘线(图 3中实线),在现阶段位置是从长江源头经河套地区中部直至东北平原,在HO时期向北推进至河套地区北部,而在LGM时期向南撤经西安直至山东地区。结果表明,TraCE- 21 ka模拟再现的季风边缘线北进南退的走向与Yan和Petit-Maire[33]记录相一致,即在HO时期季风增强,季风边缘线北移,在LGM时期季风减弱,季风边缘线南撤。其能够再现古夏季风的演变,但摆动幅度较Yan和Petit-Maire[33]记录偏小,尤其是由于较粗的空间分辨率下青藏高原高海拔地区几乎无摆动。TraCE-21ka模拟结果表明在季风边缘过渡带上季风降水相对变化幅度最大(图 3中填色),东亚季风的北推南撤影响季风降雨带的范围,相比较中国南部,在北部季风边缘线的南北摆动下的环境和气候间的正反馈作用被放大。夏季风主控北部降水,北部降水可能是研究东亚古夏季风强度最佳指标。
3.2 TraCE-21ka模拟和定量重建结果对比模拟结果和地质记录重建比对主要有3个方面:量值、趋势和变幅。本文通过对比分析模拟和重建在LGM和HO两个特征阶段对东亚夏季风区南部和北部两区域的古温度及古降水量的趋势和变幅(和现在气候态的差值/现在气候态)来认识东亚古气候变化是否存在区域差异,并揭示模拟和重建的异同。
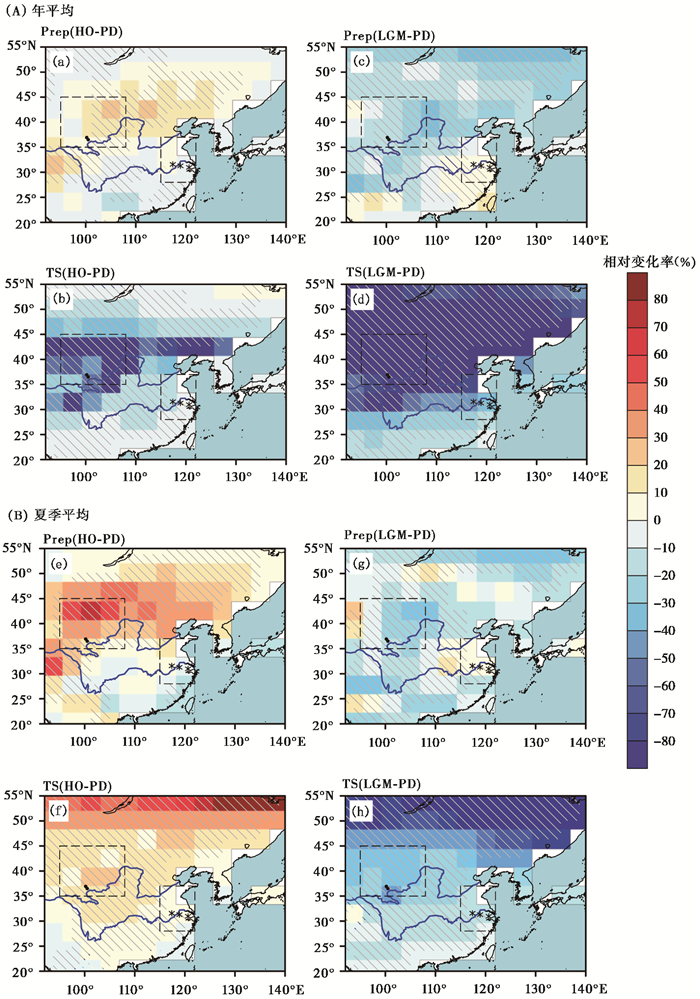
大量地质记录表明HO气候较现在参考时期(0 ka)偏暖湿[50],LGM偏干冷[48]。由图 4基于TraCE-21ka模拟年平均和夏季平均结果所示,研究关键区通过了95 %置信度的检验,表明该模拟在统计意义上显著。相对于参考时期(0 ka),在HO时期年平均降水增多温度降低,气候冷湿(图 4a和4b);LGM时期年平均降水减少温度降低,气候干冷(图 4c和4d)。在HO时期夏季平均降水增多温度升高,气候暖湿(图 4e和4f);LGM时期夏季平均降水减少温度降低,气候偏干冷(图 4g和4h)。TraCE-21ka模拟夏季平均结果以及除HO时期年均温外(图 4b)的年平均结果与目前大量地质记录结果一致[4, 48, 50~51],表现为暖湿的HO时期和干冷的LGM时期。模拟结果显示HO时期年均温较现在低,其他模拟也存在这种全新世较现在冬季温度低及年均温低的现象[52~54],这可能是除太阳辐射外[55],植被反馈的季节性等因素的影响[56]。

|
图 4 基于TraCE-21ka模拟年平均(A)和夏季平均(B)结果在HO时期相对于PD时期的降水(a,e)、温度(b,f)变化以及LGM时期相对于PD时期的降水(c,g)、温度(d,h)变化 灰色斜线为95 %置信度的差值显著性检验 Fig. 4 Climate changes in ANN(A) and JJA(B) mean precipitation(a, e)and temperature(b, f)of HO relative to PD and in ANN and JJA mean precipitation(c, g)and temperature(d, h)of LGM relative to PD based on the TraCE- 21ka simulation. The gray slash is an 95 % confidence estimate of difference statistical significance |
通过对研究区域已有地质定量重建在LGM和HO两个特征阶段的变幅收集整理[34~36],给出模拟与重建在SEASM和NEASM的降水和温度大致变化幅度(表 3)。需要提及的是,模拟结果主要基于夏季降水和温度,而地质记录定量重建的大多是年降水和温度,重建的夏季降水和温度数据集较少[41]。季风降水是由局地夏季降水主导的[41],因此地质记录重建可能反映的是季节性气候条件,并非年均的气候状态[57]。如表 3所示,NEASM在HO时期,模拟的降水增加30 %~100 %,重建的降水增加10 %~120 %;模拟的温度增加20 %~30 %,重建的温度增加20 %~130 %。在LGM时期,模拟的降水降低10 %~30 %,重建的降水降低50 %;模拟的温度降低20 %~50 %,重建的温度降低60 %~200 %左右。SEASM在HO时期,模拟的降水增加0~20 %,重建的降水增加20 %~30 %;模拟的温度增加0~10 %,重建的温度增加5 %~15 %。在LGM时期,模拟的降水降低0~20 %,温度降低10 %~30 %左右。无论是模拟还是重建NEASM变化幅度都较SEASM显著。但模拟的变化幅度较重建普遍偏小,模拟结果可能低估了气候变化幅度。
| 表 3 基于TraCE-21ka和定量重建结果在SEASM和NEASM的HO时期和LGM时期相对于PD时期的降水、温度变化幅度(↑表示上升、↓表示下降、*表示无) Table 3 Compare the ratios of precipitation and temperature changes in the HO and LGM relative to PD of SEASM and NEASM based on TraCE-21ka simulation and quantitative reconstruction(↑ rise, ↓ decrease, *none) |
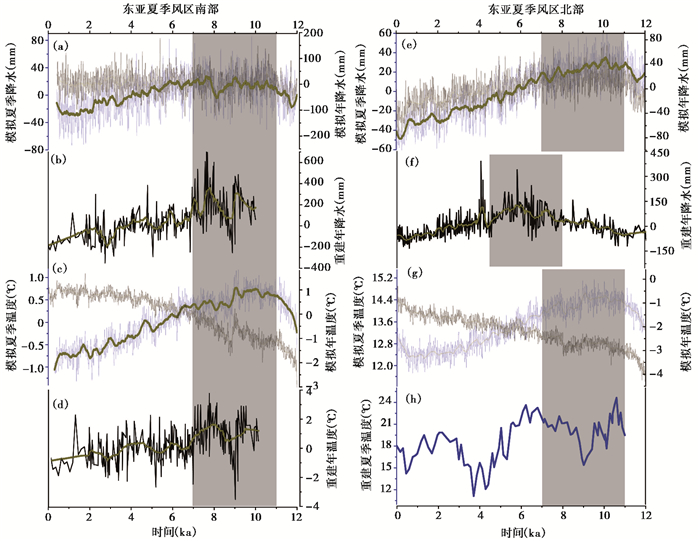
目前由于代用指标指向意义的局限性、模拟可信度等问题存在,一些研究颇具争议,比如模拟和重建结果在全新世阶段是否存在显著区域差异的相关研究尚在探讨[57~60]以及关系和机制的研究[61~63]等。本文选取在长江中下游和青藏高原东北部的几个点位在全新世期间的定量重建结果[23~25]与TraCE-21ka模拟结果比较分析(图 5)。由于有些定量数据是减去整个全新世平均值再处理后的结果,我们将TraCE-21ka模拟做同样处理。模拟和重建年均温表现出反向变化,即自早全新世以来模拟年均温逐渐升高而重建年均温逐渐降低(图 5c和5d黑线)。在太阳辐射没有直接净贡献情况下,由不断上升的温室气体和强烈的冰盖融化主控下全新世年均温理应变暖[64],这种差异可能与重建季节偏差有关[59, 65]。如前文所述,地质记录反映的是季节性气候条件[57]。在一定温度阈值下植被生长[66],重建取决于生长季的植被孢粉量[67]。植被夏季旺盛冬季稀疏,因而记录重建年均结果具有季节性,可能更多代表夏季气候变化。

|
图 5 基于TraCE-21ka模拟和定量重建的全新世以来夏季风区南北部降水温度序列 (a)和(c)模拟夏季风区南部夏季(蓝色)及年(黑色)累积降水和平均温度,(b)和(d)长江中下游巢湖、固城湖、平望镇3个点位孢粉重建年累积降水和平均温度,(e)和(g)模拟夏季风区北部夏季及年累积降水和平均温度,(f)青藏高原东北部青海湖、达连海两个点位孢粉重建年累积降水,(h)青海湖沉积物重建夏季平均温度;(a)~(f)都减去全新世的平均值 Fig. 5 Different precipitation and temperature patterns between SEASM and NEASM based on TraCE- 21ka simulation and quantitative reconstruction during the Holocene. (a)and (c) are the JJA(blue line)and ANN(black line)accumulated precipitation and mean temperature based on the TraCE- 21ka simulation in the SEASM, (b)and (d) are the ANN accumulated precipitation and mean temperature based on the pollen quantitative reconstruction at three spots in the middle and lower reaches of the Yangtze River, (e)and (g) are the JJA and ANN accumulated precipitation and mean temperature based on the TraCE- 21ka simulation in the NEASM, (f)is the ANN accumulated precipitation based on the pollen quantitative reconstruction at two spots in the northeastern part of the Qinghai-Tibet Plateau, (h)is the JJA mean temperature based on the sediment quantitative reconstruction at Qinghai Lake, and (a)~(f) minus the mean of whole Holocene |
在这里我们基于模拟夏季与重建结果对比,SEASM的温度及降水在整个全新世期间模拟和重建的结果一致性较高,温度及降水同步变化,呈全新世早期(7~11 ka)高而后逐渐下降的趋势(图 5a~5d)。在全新世早期模拟的温度及降水振幅小,温度呈显著下降趋势而降水趋势不明显,重建的温度及降水振幅较大,呈下降趋势但不显著。全新世晚期相比于早期,模拟的降水和温度显著下降,重建的降水和温度振幅减小。相比于SEASM结果的较高一致性NEASM结果要复杂,其温度在整个全新世期间模拟和重建的结果一致性较高,但重建和模拟降水在晚全新世一致而早全新世不一致变化。模拟的降水及温度和重建的温度在早全新世高而后逐渐下降,而重建的降水在中全新世(4~8 ka)高(图 5e~5h)。模拟的降水和温度在整个全新世期间振幅小,呈显著的下降趋势。重建的降水在全新世中期振幅较大,在早晚期振幅减小。模拟较重建降水和温度变化幅度偏小,温度偏冷。
相比重建南部降水在早全新世高而北部在中全新世高和南、北部温度都在早全新世高背景下的全新世最适宜期显著不同步,模拟降水与温度基本同步且在季风区南、北差异性较小,季风降水最强出现在早全新世,是为全新世持续减弱夏季风演变的结果。
这种模拟和重建结果间的不同可能来源于以下几个方面:从地质记录重建方面来看,植被反映的是季节性气候条件[57],并且各类指标指向意义不明确[68],地表过程对气候演变敏感度的区域性差异使得各代用指标的区域适用性有所不同[69~70]。且有些指标对降水敏感、有些对温度敏感[7],用转换函数空间换取时间可能并不适合所有区域,而适合高度敏感区的某些指标[15, 70~71]。同时,全新世期间强烈的人类活动对植被的影响可能是一个潜在因素[14, 72~73]。从模拟方面来看,模拟误差分为离散误差、参数化方案等内部系统误差和外强迫响应的气候敏感误差等不确定因素[42, 74]。由于东亚环流地形复杂,对于分辨率较粗的单位网格面积接近400×400 km的TraCE-21ka模拟全球气候模式来说,其对东亚气候空间形态以及季风边缘区模拟能力有限,造成和地质记录对比时的系统性气候偏移[43]。
4 结论与讨论本文基于现代观测数据及古气候记录重建结果,从TraCE-21ka模拟对现代东亚气候空间格局模拟能力和对东亚古夏季风演变的再现能力出发。在此基础上,将LGM和HO两个特征阶段的东亚季风区南部和北部两区域对比,分析其异同,并得到如下主要结论。
(1) 从东亚整体来看,TraCE- 21ka模拟对现代东亚气候有合理的模拟能力,其能够较好的模拟东亚大尺度降水和温度的空间分布格局,模拟和观测的年、夏季累积降水的空间相关系数分别为0.76、0.64,平均温度的空间相关系数分别为0.93、0.87。从东亚夏季风区南北局部来看,SEASM模拟与观测的相关性总体要比NEASM的高。SEASM模拟和观测的年、夏季累积降水的空间相关系数分别为0.90、0.81,平均温度的空间相关系数分别为0.96、0.96。NEASM模拟和观测的年、夏季累积降水的空间相关系数分别为0.88、0.84,平均温度的空间相关系数分别为0.62、0.27。这种NEASM显著的空间分布差异,可能是由于粗分辨率模拟下高大地形的平滑效应,在青藏高原地区出现的虚假中心导致误差较大。
(2) 对过去21 ka东亚夏季风演变,TraCE- 21ka模拟能够再现出东亚夏季风在轨道尺度上的北推南撤的进程以及季风边缘过渡带上夏季降水相对变化幅度最大的特征,北部降水是为研究东亚古夏季风强度最佳指标。但相比较地质记录重建结果,TraCE- 21ka模拟的摆动幅度偏小。地质重建表明季风北边缘线在LGM时期能南撤经长江中游直至山东、江苏交界处,在HO时期能北推至蒙古国和中国内蒙交界地。而TraCE-21ka模拟表明在LGM时期仅南撤经西安直至山东地区,在HO时期仅北推进至河套地区北部,且在粗的空间分辨率下青藏高原高海拔地区几乎无摆动。
(3) TraCE-21ka模拟结果和地质记录重建比对。从趋势上来看,TraCE-21ka模拟夏季结果以及除HO时期年均温外的年平均结果与地质记录一致,表现为HO较现在偏暖湿,LGM偏干冷的气候特征。模拟结果显示的HO时期年均温较现在低,许多其他模拟也有类似现象,这可能是除太阳辐射外植被反馈的季节性变化影响。从变幅上来看,模拟和重建的NEASM变化幅度都较SEASM显著。模拟和重建的NEASM变化幅度在HO时期降水分别增加30 %~100 %、10 %~120 %,温度分别增加20 %~30 %、20 %~130 %,在LGM时期降水分别降低10 %~30 %、50 %,温度分别降低20 %~50 %、60 %~200 %。模拟和重建的SEASM变化幅度在HO时期降水分别增加0 %~20 %、20 %~30 %,温度分别增加0 %~10 %、5 %~15 %,在LGM时期模拟降水降低0 %~20 %,温度降低10 %~30 %。可见模拟的变化幅度较重建普遍偏小,模拟结果可能低估了气候的真实变化幅度。
(4) TraCE-21ka模拟结果和地质记录定量重建全新世以来的序列比对。模拟和重建年均温表现出反相变化,即模拟全新世以来逐渐增温而重建全新世以来逐渐降温。这种差异可能与重建季节偏差有关,记录重建大多是年降水和温度,但年均结果具有季节性,可能更多代表夏季气候变化。因此本文基于TraCE-21ka模拟夏季结果和记录重建对比指出,东亚夏季风的演变存在区域差异。无论是重建还是模拟结果方面,相对于SEASM,NEASM变化幅度较显著。SEASM的温度及降水和NEASM的温度在整个全新世期间模拟和重建的结果一致性较高,但NEASM的模拟和重建降水在晚全新世一致而早全新世不一致。重建的降水变化不同步,降水在夏季风区南、北差异显著,南部降水在早全新世高而北部在中全新世高。而相比于重建,模拟的温度及降水基本同步变化且在夏季风区南、北差异较小,季风降水最强出现在早全新世是为全新世持续减弱夏季风演变的结果。
最后需指出的是,古气候定量化重建结果与古气候模拟之间存在一定差异。在温度上,HO时期重建年均结果显示升温;模拟年均结果显示降温,夏季结果显示升温。在降水上,夏季风区北方全新世早中期重建结果显示增加而模拟结果显示减少。对于这种重建和模拟间的不同,可能来源于植被季节性偏差,孢粉等生物气候指标反映的是季节性气候条件。同时地表过程对气候演变敏感度的区域性差异使得在不同地区各代用指标的适用性有所不同,用转换函数空间换取时间可能并不适合所有区域的各类指标。也可能是由于TraCE-21ka模拟这种全球气候模式分辨率较粗对东亚气候空间形态的模拟尤其是地形复杂的季风边缘区模拟能力有限,导致和地质记录作对比时存在系统性偏移。模式改进和减小重建结果的不确定性是未来东亚古季风气候变化研究亟须解决的问题。
致谢: 感谢审稿人和编辑部杨美芳老师给出的意见和建议,感谢陆福志同学提供的地质重建数据,在此谨致谢忱。
| [1] |
陈隆勋. 东亚季风环流系统的结构及其中期变动[J]. 海洋学报, 1984, 6(6): 744-758. Chen Longxun. The structure of the East Asian monsoon circulation system and its medium-term changes[J]. Acta Oceanologica Sinica, 1984, 6(6): 744-758. |
| [2] |
汪品先. 全球季风的地质演变[J]. 科学通报, 2009, 54(5): 535-556. Wang Pingxian. Global monsoon in a geological perspective[J]. Chinese Science Bulletin, 2009, 54(7): 1113-1136. |
| [3] |
Marcott S A, Shakun J D, Clark P U, et al. A reconstruction of regional and global temperature for the past 11, 300 years[J]. Science, 2013, 339(6124): 1198-1201. DOI:10.1126/science.1228026 |
| [4] |
Bartlein P J, Harrison S P, Brewer S, et al. Pollen-based continental climate reconstructions at 6 and 21 ka:A global synthesis[J]. Climate Dynamics, 2011, 37(3): 775-802. |
| [5] |
Liu Z, Otto-Bliesner B L, He F, et al. Transient simulation of last deglaciation with a new mechanism for Bølling-Allerød warming[J]. Science, 2009, 325(5938): 310-314. DOI:10.1126/science.1171041 |
| [6] |
陈发虎, 张家武, 程波, 等. 青海共和盆地达连海晚第四纪高湖面与末次冰消期以来的环境变化[J]. 第四纪研究, 2012, 32(1): 122-131. Chen Fahu, Zhang Jiawu, Cheng Bo, et al. Late Quaternary high lake levels and environmental changes since last deglacial in Dalianhai, Gonghe Basin in Qinghai Province[J]. Quaternary Sciences, 2012, 32(1): 122-131. DOI:10.3969/j.issn.1001-7410.2012.01.13 |
| [7] |
An Z, Porter S C, Kutzbach J E, et al. Asynchronous Holocene Optimum of the East Asian monsoon[J]. Quaternary Science Reviews, 2000, 19(8): 743-762. DOI:10.1016/S0277-3791(99)00031-1 |
| [8] |
Lorenz S J, Kim J H, Rimbu N, et al. Orbitally driven insolation forcing on Holocene climate trends:Evidence from alkenone data and climate modeling[J]. Paleoceanography, 2006, 21. DOI:10.1029/2005PA001152 |
| [9] |
Li Jianyong, Ilvonen L, Xu Qinghai, et al. East Asian summer monsoon precipitation variations in China over the last 9500 years:A comparison of pollen-based reconstructions and model simulations[J]. The Holocene, 2016, 26(4): 592-602. DOI:10.1177/0959683615612564 |
| [10] |
焦腾腾, 李佳瑞, 陈婕, 等. 全新世北大西洋海面温度变化趋势:观测-模拟对比研究[J]. 第四纪研究, 2016, 36(3): 747-757. Jiao Tengteng, Li Jiarui, Chen Jie, et al. Changing trends of sea surface temperatures in the North Atlantic during the Holocene:A study of model-data comparison[J]. Quaternary Sciences, 2016, 36(3): 747-757. |
| [11] |
郭超, 马玉贞, 胡彩莉, 等. 中国内陆区湖泊沉积所反映的全新世干湿变化[J]. 地理科学进展, 2014, 33(6): 786-798. Guo Chao, Ma Yuzhen, Hu Caili, et al. Holocene humidity changes in inland China inferred from lake sediments[J]. Progress in Geography, 2014, 33(6): 786-798. |
| [12] |
吕厚远, 韩家懋, 吴乃琴, 等. 中国现代土壤磁化率分析及其古气候意义[J]. 中国科学(B辑), 1994, 24(12): 1290-1297. Lü Houyuan, Han Jiamao, Wu Naiqin, et al. Analysis of magnetic susceptibility of modern Chinese soil and its paleoclimatic significance[J]. Science in China(Series B), 1994, 24(12): 1290-1297. |
| [13] |
Wang P, Clemens S, Beaufort L, et al. Evolution and variability of the Asian monsoon system:State of the art and outstanding issues[J]. Quaternary Science Reviews, 2005, 24(5): 595-629. |
| [14] |
郑卓, 张潇, 满美玲, 等. 中国及邻区利用孢粉进行古气候定量重建的回顾与数据集成[J]. 第四纪研究, 2016, 36(3): 503-519. Zheng Zhuo, Zhang Xiao, Man Meiling, et al. Review and data integration of pollen-based quantitative paleoclimate reconstruction studies in China and adjacent areas[J]. Quaternary Sciences, 2016, 36(3): 503-519. |
| [15] |
秦锋, 赵艳. 基于孢粉组合定量重建古气候的方法在中国的运用及思考[J]. 第四纪研究, 2013, 33(6): 1054-1068. Qin Feng, Zhao Yan. Methods of quantitative climate reconstruction based on palynological data and their applications in China[J]. Quaternary Sciences, 2013, 33(6): 1054-1068. DOI:10.3969/j.issn.1001-7410.2013.06.02 |
| [16] |
Kutzbach J E. Monsoon climate of the Early Holocene:Climate experiment with the Earth's orbital parameters for 9000 years ago[J]. Science, 1981, 214(4516): 59-61. DOI:10.1126/science.214.4516.59 |
| [17] |
姜大膀, 田芝平. 末次冰盛期和全新世中期东亚地区水汽输送的模拟研究[J]. 第四纪研究, 2017, 37(5): 999-1008. Jiang Dabang, Tian Zhiping. Last Glacial Maximum and mid-Holocene water vapor transport over East Asia:A modeling study[J]. Quaternary Sciences, 2017, 37(5): 999-1008. |
| [18] |
Liu Z, Wen X, Brady E C, et al. Chinese cave records and the East Asian summer monsoon[J]. Quaternary Science Reviews, 2014, 83(1): 115-128. |
| [19] |
He F, Shakun J D, Clark P U, et al. Northern hemisphere forcing of southern hemisphere climate during the last deglaciation[J]. Nature, 2013, 494(7435): 81-85. DOI:10.1038/nature11822 |
| [20] |
Wen X, Liu Z, Wang S, et al. Correlation and anti-correlation of the East Asian summer and winter monsoons during the last 21, 000 years[J]. Nature Communications, 2016, 7: 11999. DOI:10.1038/ncomms11999 |
| [21] |
Collins W D, Bitz C M, Blackmon M L, et al. The community climate system model version 3(CCSM3)[J]. Journal of Climate, 2006, 17(11): 2357-2376. |
| [22] |
Gettelman A, Morrison H, Ghan S J. A new two-moment bulk stratiform cloud microphysics scheme in the community atmosphere model, Version 3(CAM3). Part Ⅱ:Single-column and global results[J]. Journal of Climate, 2008, 21(15): 3660-3679. DOI:10.1175/2008JCLI2116.1 |
| [23] |
Li J, Dodson J, Yan H, et al. Quantitative Holocene climatic reconstructions for the lower Yangtze region of China[J]. Climate Dynamics, 2018, 50(3-4): 1101-1113. DOI:10.1007/s00382-017-3664-3 |
| [24] |
Li J, Dodson J, Yan H, et al. Quantitative precipitation estimates for the northeastern Qinghai-Tibetan Plateau over the last 18, 000 years[J]. Journal of Geophysical Research:Atmospheres, 2017, 122(10): 5132-5143. DOI:10.1002/2016JD026333 |
| [25] |
Hou J, Huang Y, Zhao J, et al. Large Holocene summer temperature oscillations and impact on the peopling of the northeastern Tibetan Plateau[J]. Geophysical Research Letters, 2016, 43(3): 1323-1330. DOI:10.1002/2015GL067317 |
| [26] |
Chen F, Xu Q, Chen J, et al. East Asian summer monsoon precipitation variability since the last deglaciation[J]. Scientific Reports, 2015, 5: 11186. DOI:10.1038/srep11186 |
| [27] |
Chen W, Wang W M, Dai X R. Holocene vegetation history with implications of human impact in the Lake Chaohu area, Anhui Province, East China[J]. Vegetation History and Archaeobotany, 2009, 18(2): 137-146. DOI:10.1007/s00334-008-0173-7 |
| [28] |
羊向东, 王苏民, 童国榜. 江苏固城湖区一万多年来的孢粉植物群及古季风气候变迁[J]. 植物学报, 1996, 38(7): 576-581. Yang Xiangdong, Wang Sumin, Tong Guobang. Character of a nology and changes of monsoon climate over the last 10000 years in Gucheng Lake, Jiangsu Province[J]. Acta Botanica Sinica, 1996, 38(7): 576-581. |
| [29] |
Innes J B, Zong Y, Wang Z, et al. Climatic and palaeoecological changes during the mid-to Late Holocene transition in Eastern China:High-resolution pollen and non-pollen palynomorph analysis at Pingwang, Yangtze coastal lowlands[J]. Quaternary Science Reviews, 2014, 99(9): 164-175. |
| [30] |
Shen J, Liu X, Wang S, et al. Palaeoclimatic changes in the Qinghai Lake area during the last 18, 000 years[J]. Quaternary International, 2005, 136(1): 131-140. DOI:10.1016/j.quaint.2004.11.014 |
| [31] |
Cheng B, Chen F, Zhang J. Palaeovegetational and palaeoenvironmental changes since the last deglacial in Gonghe Basin, northeast Tibetan Plateau[J]. Journal of Geographical Sciences, 2013, 23(1): 136-146. DOI:10.1007/s11442-013-0999-5 |
| [32] |
Wang Zheng, Liu Weiguo. Calibration of the U37k' index of long-chain alkenones with the in-situ water temperature in Lake Qinghai in the Tibetan Plateau[J]. Chinese Science Bulletin, 2013, 58(7): 803-808. DOI:10.1007/s11434-012-5527-y |
| [33] |
Yan Z, Petit-Maire N. The last 140 ka in the Afro-Asian arid/semi-arid transitional zone[J]. Palaeogeography, Palaeoclimatology, Palaeoecology, 1994, 110(3-4): 217-233. DOI:10.1016/0031-0182(94)90085-X |
| [34] |
俞凯峰, 鹿化煜, Frank Lehmkuhl, 等. 末次盛冰期和全新世大暖期中国北方沙地古气候定量重建初探[J]. 第四纪研究, 2013, 33(2): 293-302. Yu Kaifeng, Lu Huayu, Frank Lehmkuhl, et al. A preliminary quantitative paleoclimate reconstruction of the dune fields of Northern China during the Last Glacial Maximum and Holocene Optimum[J]. Quaternary Sciences, 2013, 33(2): 293-302. DOI:10.3969/j.issn.1001-7410.2013.02.11 |
| [35] |
Lu F, Ma C, Zhu C, et al. Variability of East Asian summer monsoon precipitation during the Holocene and possible forcing mechanisms[J]. Climate Dynamics, 2018(1): 1-21. DOI:10.1007/s00382-018-4175-6 |
| [36] |
Zhu Cheng, Chen Xing, Zhang Guangsheng, et al. Spore-pollen-climate factor transfer function and paleoenvironment reconstruction in Dajiuhu, Shennongjia, Central China[J]. Chinese Science Bulletin, 2008, 53(Suppl.): 42-49. |
| [37] |
Rudolf B, Hauschild H, Rueth W, et al. Terrestrial precipitation analysis:Operational method and required density of point measurements[J]. Nato Asi Series(Series Ⅰ:Global Environmental Change), 1994, 26(10): 173-186. |
| [38] |
Kanamitsu M, Ebisuzaki W, Woollen J, et al. NCEP-DOE AMIP-Ⅱ Reanalysis(R-2)[J]. Bulletin of the American Meteorological Society, 2002, 83(11): 1631-1643. DOI:10.1175/BAMS-83-11-1631 |
| [39] |
屈文军, 张小曳, 王丹, 等. 西风带研究的重要意义[J]. 海洋地质与第四纪地质, 2004, 24(1): 125-132. Qu Wenjun, Zhang Xiaoye, Wang Dan, et al. The important significance of westerly wind study[J]. Marine Geology & Quaternary Geology, 2004, 24(1): 125-132. |
| [40] |
张仲石, 燕青, 张冉, 等. 第四纪北半球冰盖发育与东亚气候的遥相关[J]. 第四纪研究, 2017, 37(5): 1009-1016. Zhang Zhongshi, Yan Qing, Zhang Ran, et al. Teleconnection between Northern Hemisphere ice sheets and East Asian climate during Quaternary[J]. Quaternary Sciences, 2017, 37(5): 1009-1016. |
| [41] |
田芝平, 姜大膀. 全新世中期和末次冰盛期中国季风区面积和季风降水变化[J]. 科学通报, 2015, 60(4): 400-410. Tian Zhiping, Jiang Dabang. Mid-Holocene and Last Glacial Maximum changes in monsoon area and precipitation over China[J]. Chinese Science Bulletin, 2015, 60(4): 400-410. |
| [42] |
郑伟鹏, 俞永强. 一个耦合气候系统模式模拟的中全新世时期亚洲季风系统变化[J]. 第四纪研究, 2009, 29(6): 1135-1145. Zheng Weipeng, Yu Yongqiang. The Asian monsoon system of the mid-Holocene simulated by a coupled GCM[J]. Quaternary Sciences, 2009, 29(6): 1135-1145. |
| [43] |
田芝平, 姜大膀, 张冉, 等. CCSM4.0的长期积分试验及其对东亚和中国气候模拟的评估[J]. 大气科学, 2012, 36(3): 619-632. Tian Zhiping, Jiang Dabang, Zhang Ran, et al. Long-term climate simulation of CCSM4.0 and evaluation of its performance over East Asia and China[J]. Chinese Journal of Atmospheric Science, 2012, 36(3): 619-632. |
| [44] |
高学杰, 徐影, 赵宗慈, 等. 数值模式不同分辨率和地形对东亚降水模拟影响的试验[J]. 大气科学, 2006, 30(2): 185-192. Gao Xuejie, Xu Ying, Zhao Zongci, et al. Impacts of horizontal resolution and topography on the numerical simulation of East Asian precipitation[J]. Chinese Journal of Atmospheric Sciences, 2006, 30(2): 185-192. DOI:10.3878/j.issn.1006-9895.2006.02.01 |
| [45] |
Xu Y, Gao X, Giorgi F. Upgrades to the reliability ensemble averaging method for producing probabilistic climate-change projections[J]. Climate Research, 2010, 41(1): 61-81. |
| [46] |
Liu J, Chen J, Zhang X, et al. Holocene East Asian summer monsoon records in Northern China and their inconsistency with Chinese stalagmite δ18 O records[J]. Earth-Science Reviews, 2015, 148: 194-208. DOI:10.1016/j.earscirev.2015.06.004 |
| [47] |
董光荣, 靳鹤龄, 陈惠忠. 末次间冰期以来沙漠-黄土边界带移动与气候变化[J]. 第四纪研究, 1997(2): 158-167. Dong Guangrong, Jin Heling, Chen Huizhong. Desert-loess boundary belt shift and climate change since the last interglacial period[J]. Quaternary Sciences, 1997(2): 158-167. DOI:10.3321/j.issn:1001-7410.1997.02.008 |
| [48] |
Lu H, Yi S, Liu Z, et al. Variation of East Asian monsoon precipitation during the past 21 k.y.and potential CO2 forcing[J]. Geology, 2013, 41(9): 1023-1026. DOI:10.1130/G34488.1 |
| [49] |
Lu H, Yi S, Xu Z, et al. Chinese deserts and sand fields in Last Glacial Maximum and Holocene Optimum[J]. Chinese Science Bulletin, 2013, 58(23): 2775-2783. DOI:10.1007/s11434-013-5919-7 |
| [50] |
施雅风, 孔昭宸, 王苏民, 等. 中国全新世大暖期鼎盛阶段的气候与环境[J]. 中国科学(B辑), 1993, 23(8): 865-873. Shi Yafeng, Kong Zhaochen, Wang Sumin, et al. Climate and environment at the peak of the Holocene warm period in China[J]. Science in China(Series B), 1993, 23(8): 865-873. |
| [51] |
段阜涛, 安成邦, 赵永涛, 等. 新疆湖泊岩心记录的末次间冰期以来气候变化初步研究[J]. 第四纪研究, 2018, 38(5): 1156-1165. Duan Futao, An Chengbang, Zhao Yongtao, et al. A preliminary study on the climate change since the last interglaciation based on lake sediments from Xinjiang, Northwest China[J]. Quaternary Sciences, 2018, 38(5): 1156-1165. |
| [52] |
王志远, 靳立亚, 俞飞, 等. 中东亚中全新世气候与植被反馈作用:PMIP2多模式结果分析[J]. 第四纪研究, 2011, 31(1): 36-47. Wang Zhiyuan, Jin Liya, Yu Fei, et al. The impact of vegetation feedback on mid-Holocene climate in Central and East Asia:Results of 6 coupled simulations from the paleoclimate modeling intercomparison project(PMIP)[J]. Quaternary Sciences, 2011, 31(1): 36-47. DOI:10.3969/j.issn.1001-7410.2011.01.06 |
| [53] |
陈星, 于革, 刘健. 东亚中全新世的气候模拟及其温度变化机制探讨[J]. 中国科学(D辑), 2002, 32(4): 335-345. Chen Xing, Yu Ge, Liu Jian. Climate simulation and temperature change mechanism of the Middle Holocene in East Asia[J]. Science in China(Series D), 2002, 32(4): 335-345. |
| [54] |
郑益群, 于革, 薛滨, 等. 6 ka B. P.东亚区域气候模拟及其变化机制探讨[J]. 第四纪研究, 2004, 24(1): 28-38. Zheng Yiqun, Yu Ge, Xue Bin, et al. Simulations of East Asian climate at 6 ka B. P.[J]. Quaternary Sciences, 2004, 24(1): 28-38. DOI:10.3321/j.issn:1001-7410.2004.01.004 |
| [55] |
Jin L, Schneider B, Park W, et al. The spatial-temporal patterns of Asian summer monsoon precipitation in response to Holocene insolation change:A model-data synthesis[J]. Quaternary Science Reviews, 2014, 85(10): 47-62. |
| [56] |
Foley J A, Kutzbach J E, Coe M T, et al. Feedbacks between climate and boreal forests during the Holocene epoch[J]. Nature, 1994, 371(6492): 52-54. DOI:10.1038/371052a0 |
| [57] |
吴海斌, 李琴, 于严严, 等. 全新世中期中国气候格局定量重建[J]. 第四纪研究, 2017, 37(5): 982-998. Wu Haibin, Li Qin, Yu Yanyan, et al. Quantitative climate reconstruction in China during the mid-Holocene[J]. Quaternary Sciences, 2017, 37(5): 982-998. |
| [58] |
吴鹏飞, 刘征宇, 程军, 等. 中全新世以来东亚夏季降水时空演变不一致性的模拟研究[J]. 第四纪研究, 2013, 33(6): 1138-1147. Wu Pengfei, Liu Zhengyu, Cheng Jun, et al. A simulation study on spatio-temporal asynchronism of East Asian summer's precipitation variation since the mid-Holocene[J]. Quaternary Sciences, 2013, 33(6): 1138-1147. DOI:10.3969/j.issn.1001-7410.2013.06.10 |
| [59] |
Liu Z, Zhu J, Rosenthal Y, et al. The Holocene temperature conundrum[J]. Proceedings of the National Academy of Sciences of the United States of America, 2014, 111(34): E3501-E3505. DOI:10.1073/pnas.1407229111 |
| [60] |
Jiang D, Lang X, Tian Z, et al. Considerable model-data mismatch in temperature over China during the mid-Holocene:Results of PMIP simulations[J]. Journal of Climate, 2012, 25(12): 4135-4153. DOI:10.1175/JCLI-D-11-00231.1 |
| [61] |
张肖剑, 靳立亚. 全新世南亚高压南北移动及其与亚洲夏季风降水的关系[J]. 第四纪研究, 2018, 38(5): 1244-1254. Zhang Xiaojian, Jin Liya. Meridional migration of the South Asian High and its association with Asian summer monsoon precipitation during the Holocene[J]. Quaternary Sciences, 2018, 38(5): 1244-1254. |
| [62] |
张志平, 黄伟, 陈建徽, 等. 全新世东亚夏季风演化的多尺度周期变化及其可能机制探讨[J]. 第四纪研究, 2017, 37(3): 498-509. Zhang Zhiping, Huang Wei, Chen Jianhui, et al. Multi-time scale analysis of East Asian summer monsoon and its possible mechanism during Holocene[J]. Quaternary Sciences, 2017, 37(3): 498-509. |
| [63] |
燕青, 张仲石, 张冉, 等. 过去千年北大西洋热带气旋生成潜势的模拟研究:基于PMIP3气候模式[J]. 第四纪研究, 2017, 37(5): 1141-1150. Yan Qing, Zhang Zhongshi, Zhang Ran, et al. Simulation of tropical cyclone genesis potential over the North Atlantic in the last millennium based on PMIP3 models[J]. Quaternary Sciences, 2017, 37(5): 1141-1150. |
| [64] |
Mix A C. Running hot and cold in the eastern equatorial Pacific[J]. Quaternary Science Reviews, 2006, 25(11): 1147-1149. |
| [65] |
Leduc G, Schneider R, Kim J H, et al. Holocene and Eemian Sea surface temperature trends as revealed by alkenone and Mg/Ca paleothermometry[J]. Quaternary Science Reviews, 2010, 29(7): 989-1004. |
| [66] |
赵艳, 刘耀亮, 郭正堂, 等. 全新世气候渐变导致中亚地区植被突变[J]. 中国科学:地球科学, 2017, 47(8): 927-938. Zhao Yan, Liu Yaoliang, Guo Zhengtang, et al. Abrupt vegetation shifts caused by gradual climate changes in Central Asia during the Holocene[J]. Science China:Earth Sciences, 2017, 47(8): 927-938. |
| [67] |
侯光良, 鄂崇毅, 肖景义, 等. 重建古气温的环境证据-方法差异性分析[J]. 地球学报, 2011, 32(4): 455-462. Hou Guangliang, E Chongyi, Xiao Jingyi, et al. The sensitivity analysis of reconstructing ancient temperatures by different circumstantial evidence and methods[J]. Acta Geoscientica Sinica, 2011, 32(4): 455-462. DOI:10.3975/cagsb.2011.04.09 |
| [68] |
Cheng H, Sinha A, Wang X, et al. The global paleomonsoon as seen through speleothem records from Asia and the Americas[J]. Climate Dynamics, 2012, 39(5): 1045-1062. DOI:10.1007/s00382-012-1363-7 |
| [69] |
李珍, 王开发, 王永吉, 等. 红树林孢粉-气候因子转换函数恢复古环境的可行性初探[J]. 海洋科学进展, 2002, 20(3): 73-78. Li Zhen, Wang Kaifa, Wang Yongji, et al. A preliminary study on the feasibility for reconstructing paleoenvironment using the mangrove spore-pollen-climate factor transfer function[J]. Advance in Marine Science, 2002, 20(3): 73-78. DOI:10.3969/j.issn.1671-6647.2002.03.011 |
| [70] |
李琴.末次盛冰期以来中国植被时空演化及其对东亚季风的指示[D].北京: 中国科学院大学博士论文, 2014: 1-138. Li Qin. The Temporal and Spatial Evolution of Vegetation in China since the Last Glacial Maximum and the Implication for the East Asian Summer Monsoon[D]. Beijing: The PhD Thesis of University of Chinese Academy of Science, 2014: 1-138. http://www.wanfangdata.com.cn/details/detail.do?_type=degree&id=Y2962571 |
| [71] |
陈星, 朱诚, 马春梅, 等. 气候转换函数中孢粉因子的气候敏感性分析[J]. 科学通报, 2008, 53(S1): 45-51. Chen Xing, Zhu Cheng, Ma Chunmei, et al. Climate sensitivity analysis of spore-pollen-climate factor transfer function[J]. Chenese Science Bulletin, 2008, 53(S1): 45-51. |
| [72] |
Li J, Zhao Y, Xu Q, et al. Human influence as a potential source of bias in pollen-based quantitative climate reconstructions[J]. Quaternary Science Reviews, 2014, 99(99): 112-121. |
| [73] |
贾飞飞, 鲁瑞洁, 高尚玉. 毛乌素沙漠东南缘湖沼相沉积物粒度特征记录的12.2 cal.ka B. P.以来的区域环境变化[J]. 第四纪研究, 2018, 38(5): 1211-1220. Jia Feifei, Lu Ruijie, Gao Shangyu. Environmental changes recorded from grain-size characteristics of the lacustrine-peat sediments from southeastern margin of Mu Us Desert since 12.2 cal.ka B. P.[J]. Quaternary Sciences, 2018, 38(5): 1211-1220. |
| [74] |
梁潇云, 姜大膀. 我国对末次冰期冰盛期东亚区域气候模拟的研究[J]. 气候变化研究进展, 2007, 3(3): 138-143. Liang Xiaoyun, Jiang Dabang. Advances in East Asian paleoclimate modelling for the Last Glacial Maximum by China[J]. Advances in Climate Change Research, 2007, 3(3): 138-143. DOI:10.3969/j.issn.1673-1719.2007.03.003 |
2 School of Geography and Ocean Science, Jiangsu Provincial Collaborative Innovation Center of Climate Change, Nanjing University, Nanjing 210023, Jiangsu)
Abstract
East Asian Summer Monsoon(EASM) is an integral part of the global climate system, its associated precipitation and temperature is important to maintain a living environment in populous East Asia. Paleoclimate change documented in numerous geological and biological records of East Asia widely attribute to the evolution of EASM. In addition, transient climate model can properly simulate the characteristics and seasonal cycle of Asian monsoon system. So the comparative analysis of deposition records and paleoclimate simulation can effectively reveal the mechanism of climate and environment change over the last 21 ka. However, the relevant studies on the East Asian summer monsoon region is still insufficient. For example, it is unclear whether there are significant regional differences between the pollen-based reconstruction and transient climate simulation, especially for the Holocene.In this paper, the key Asian summer monsoon region we analyzed are the Southern East Asian Summer Monsoon(SEASM:28°~37°N, 115°~122°E) and Northern East Asian Summer Monsoon(NEASM:35°~45°N, 95°~108° E). Based on the results of modern observations of Global Precipitation Climatology Centre(GPCC) and National Centers for Environmental Prediction(NCEP), firstly we evaluated the capability of TraCE-21ka simulation to reproduce the climatic characteristics of modern East Asia. Furthermore, we collect relevant pollen-based reconstruction of precipitation and temperature of SEASM including Chaohu, Gu Chenghu and Ping Wang, pollen-based reconstruction of precipitation of NEASM including Qinghai and Da Lianhai, deposition-based reconstruction of temperature of NEASM including Qinghai. So that, we can effectively reveal the characteristics and possible mechanisms of the climate change between SEASM and NEASM based on reconstruction and simulation over the past 21 ka.The results show that TraCE-21ka simulation and quantitative reconstruction are relatively consistent. Compared with modern precipitation and temperature, they both indicate that the Last Glacial Maximum(LGM, 18~22 ka) was dryer and colder, and the Holocene Optimum(HO, 6~10 ka) was warmer and wetter. For the variability analysis, they both indicate that the variation range of NEASM is greater than SEASM. Expressed as, the precipitation of NEASM respectively increased by 30%~100% and 10%~120% in the HO, and the temperature of NEASM respectively increased by 20%~30% and 20%~130% in the HO; the precipitation of NEASM respectively decreased by 10%~30% and 50% in the LGM, and the temperature of NEASM respectively decreased by 20%~50% and 60%~200% in the LGM. The precipitation of SEASM respectively increased by 0%~20% and 20%~30% in the HO, and the temperature of SEASM respectively increased by 0%~10% and 5%~15% in the HO; the reconstructed precipitation of SEASM decreased by 0%~20% and the temperature decreased by 10%~30% in the LGM. So the variability of simulation is generally smaller than that of reconstruction, and the simulation may underestimate the true change of paleoclimate. At the same time, both the simulation and reconstruction show that temperature and precipitation of SEASM and the temperature of NEASM are highly consistent throughout the Holocene, but precipitation of NEASM is consistent in the Late Holocene and inconsistent in the Early Holocene. According to reconstruction of significant asynchronously precipitation evolution between SEASM and NEASM, shown as highly precipitation of Early Holocene SEASM and highly precipitation of Middle Holocene NEASM, here the simulated precipitation differences between SEASM and NEASM is relatively smaller, and it is the dominance of insolation on the continuously weakening of Holocene summer monsoon. In addition, the differences between reconstruction and simulation may be due to two reasons. From the perspective of reconstruction, the differences may be due to the regional sensitivity of surface processes to climate change. From the perspective of simulation, it may be that the spatial resolution of TraCE-21ka simulation is too low and there is systematic climate migration which can not correspond exactly to the reconstruction. 2019, Vol.39

