 2018, Vol.38


植物多样性(plant diversity或floristic diversity)作为全球生物多样性的重要组成部分,在生态系统功能的维持和生态环境的可持续发展中发挥着关键作用[1~3]。现代植物多样性研究在气候变化与人类活动对植物多样性的影响、植物保护与多样性恢复策略等方面开展了大量工作[4]。在古生态学领域,对过去植物多样性变化历史的研究[5~16],一方面可以帮助我们从更长的时间尺度来理解现今植物多样性格局[11~12],另一方面可为未来气候情景下植物多样性变化的模拟提供重要的自然“本底”与相似型[13]。因此,国内外越来越多的古生态学者聚焦于从植物化石记录中去寻找古植物多样性变化及其驱动机制的线索。
相对于受到鉴定统计量、记录连续性与复杂来源等诸多因素限制的大植物化石(plant macrofossil)与生物标志物(biomarker)等指标[14~15],基于化石孢粉组合的孢粉多样性(pollen diversity)记录具有时间尺度长、序列连续、具备统计学意义与较高分辨率等优势,因而在古植物多样性研究中得到了广泛的应用[5~10, 16~17]。借鉴现代生物多样性的测度方法,孢粉多样性分析利用了不同的指标来定量评估和重建古植物多样性,其中常见的指标有孢粉种类数(counted pollen taxon number;又称孢粉种类丰富度,pollen taxon richness或pollen-assemblage richness;简称S)[18]、均匀度指数(evenness,简称E)[19]、综合指数如Simpson指数(D)[20]和Shannon-Wiener指数(H)[11],以及近年来逐渐得到发展的孢粉丰富度指数(palynological richness,简称E(Tn))等[8, 12, 16~17, 21]。
基于不同的孢粉多样性指标与方法,国内外古生态学者开展了孢粉与植物多样性的现代过程研究,重建了不同时间尺度古植物多样性变化历史及其与气候变化、人类活动的关系[5~10, 16~17, 22]。例如,Weng等[22]利用孢粉种类数和Shannon-Wiener多样性指数建立了哥伦比亚安第斯山地区不同植被垂直带典型类型孢粉多样性与丰度(abundance)的关系,发现孢粉多样性能够反映不同植被带的植物多样性,并由此重建了当地过去43万年来的植物多样性、植被带迁移与气候变化的历史,发现化石孢粉多样性的增加揭示了温暖气候条件下具有更高植物多样性的低海拔植被带向上部山地的迁移,而气候变冷时段孢粉多样性的降低则指示了具有较低植物多样性的稀疏草地植被向下迁移。瑞典南部全新世湖泊沉积序列的孢粉丰富度与植物多样性记录[16]则揭示了当地植物多样性的峰值区间对应于距今6000年至距今1000年考古证据记录的人类活动频繁的时段(如森林砍伐、定居扩展与原始农业发展),而近200年来多样性的显著降低反映了当地农耕地的发展。这一研究结果验证了在景观尺度与千、百年时间尺度上生物多样性的“中度干扰假说”(intermediate disturbance hypothesis)。
近年来,中国孢粉学者逐渐将孢粉多样性重建方法引入国内的古植被与古气候研究中[7, 9~10, 23]。张芸等[23]利用Simpson指数重建了我国新疆天山北坡5个泥炭与河湖相砂互层剖面记录的中晚全新世的植物多样性变化历史,发现森林草原过渡带的多样性高于草甸和荒漠带,在气候湿润时段植物多样性也较高;Xiao等[7]利用Simpson指数和Shannon-Wiener多样性指数分析了云南鹤庆古湖深钻2.78 Ma来植物多样性的变化,发现当地古植物多样性受到了周围山地垂直植被带组成与气候变化的控制,古植物多样性的增加得益于山体构造抬升后发育的垂直植被带与暖湿的季风气候条件;基于黄土高原7个风成堆积物剖面的孢粉分析结果,Zhao和Ding[9]利用其孢粉种类数和Simpson多样性指数的变化重建了末次盛冰期以来黄土高原植物多样性的上升趋势,认为气候转暖可以促进研究区植物多样性的发展。
本文简要介绍目前古植物多样性重建常用的孢粉多样性指标和计算方法,结合研究案例分析了孢粉多样性的现代过程检验及古植物多样性的重建方法,并对古植物多样性重建工作中存在的问题进行讨论与展望。
1 孢粉多样性指标孢粉多样性可以藉由不同的生物多样性测度方法与指标来定量表达[5, 17, 24]。目前常用的计算软件有基于R语言的软件包Vegan 2.4-6(https://cran.r-project.org/web/packages/vegan/index.html)、PAST 3软件[25]和EstimateS 9.1软件[26]等。下面简要介绍几种古植物多样性重建中常用的孢粉多样性指数及其计算方法。
(1) 孢粉种类数与孢粉丰富度指数
孢粉种类数即是观察到的孢粉类型的数量[18, 21]。在实验分析过程中,孢粉种类数多受到样品间不同的孢粉统计量(count size)与鉴定精度的影响[17]。
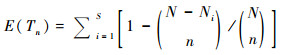
孢粉丰富度指数(E(Tn))是在给定的统计量前提下、经由稀疏化分析(rarefaction technique)[24, 27]得到的孢粉类型估计数量(estimated taxa number)[21]。由于孢粉种类数受到统计量的影响,且二者没有确定的函数关系;通常当孢粉统计量的逐渐增大时,出现稀有种类的可能性也越大[28~29]。孢粉丰富度指数则保证了各样品间的标准统计量,可以有效地消除统计量差异带来的误差,挖掘潜在的种类信息,从而更准确地提取丰富度信息[8],使得不同类型样品之间丰富度的比较更为合理。因此,孢粉丰富度指数在不同时空尺度植物多样性重建研究中得到了广泛应用[5, 8~10, 16, 21]。其计算公式如下:
|
(1) |
其中,n为稀疏化分析标准化的孢粉统计量,N为孢粉组合中实际统计量,Ni孢粉组合中第i个孢粉类型的个体数目,S为孢粉种类数。
值得注意的是,稀疏化方法是从孢粉组合中随机抽取一定数量的孢粉个体,统计其代表的孢粉类型数量,并将这些孢粉类型数量累积,直至达到设定的标准统计量。孢粉丰富度指数实际上是基于期望值进行多次阶乘运算获得的无偏估计量,在过程中可能损失部分均匀度的信息[21];受到孢粉埋藏过程等诸多客观因素的影响,孢粉丰富度指数仍然存在低估的情况。因此,在前期化石孢粉鉴定与统计过程中,应尽量保证各个样品孢粉组合达到较一致的统计量,提高稀疏化分析的精度[30];同时,运用稀疏化方法处理孢粉多样性,需要满足两点假设[31]:一是每个样品中观察到的孢粉需要达到统计上的足够数量,并能够代表该样品中潜在的孢粉组合(underlying pollen assemblage),该孢粉组合能够在统计学意义上代表采样点获得所有孢粉类群[5, 32];二是用于对比分析的孢粉谱是连续的序列,鉴定分类标准具有可比性,且来自于相似的沉积环境[33]。
(2) 均匀度指数
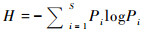
均匀度指数(E)表征了孢粉组合中不同种类丰度分布的均匀程度[19]。均匀度指数范围在0(即孢粉组合中仅有一个种类)和1(即孢粉组合中每个种类具有相同的丰度)之间,其值越低指示孢粉组合各个类型丰度差异越大。在孢粉组合中均匀度对丰富度具有较大的影响,如果优势种类明显,就会降低稀有种类被发现的可能,其均匀度相应较低[34~35]。目前均匀度的测度方法较多[17, 24, 36],例如PAST 3软件采用的均匀度指数为[37]:

|
(2) |
其中,H为Shannon-Wiener指数,S为孢粉种类数(下同)。
(3) Shannon-Wiener指数
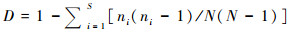
Shannon-Wiener指数(H)是对多样性的信息度量。它是基于孢粉组合中随机抽样个体归属的种类的不定性;当孢粉种类数量越大,则个体的种类归属不定性越大,就表明孢粉组合的多样性越高[11, 30]。其计算公式如下:
|
(3) |
其中,log可以选用2、e和10为底,Pi表示第i个种类个体数ni在全部统计孢粉粒数N中所占比例(Pi=ni/N)(下同)。在具体计算过程中,应使用孢粉统计量数据[11]。
(4) Simpson多样性指数
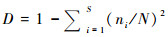
Simpson多样性指数(D)是对多样性的概率度量。该多样性指数受到物种均匀度的影响,当均匀度越高,该指数就越大,相应的生物多样性也就越高[19, 30, 38]。其计算公式如下:
|
(4) |
在孢粉组合统计量N较大的前提下,Simpson多样性指数计算公式可简化为:
|
(5) |
(5) 其他孢粉多样性指标
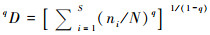
此外,还有几种应用较少的孢粉多样性指数。如有效种类数(effective number of taxa)等同于孢粉组合中具有同等丰度的孢粉类型数量[39]。Hill多样性指数(Hill numbers,简称qD)被定义为平均相对多度的倒数[40]。在Hill多样性指数的计算过程中,可以通过配置优势种和稀有种的权重,调节均匀度与丰富度在多样性评估中的比重,进而实现多种多样性指数的表达[17, 40~42]。Hill多样性指数的计算公式如下:
|
(6) |
其中,q是一非负的常数。当q=0,Hill指数与S相等;当q=1,Hill指数趋近于Shannon-Wiener指数;当q=2,Hill指数与Simpson指数直接相关;当q=5以后,表示优势种权重最高,Hill指数无限趋近于优势种丰度的倒数。
2 孢粉多样性现代过程研究与启示利用孢粉多样性开展古植物多样性重建,主要受到鉴定精度、孢粉统计量、孢粉植被代表性、传播方式与沉积过程对孢粉组合的改造等因素的限制[17, 28, 43~48]。国内外孢粉学者就这些限制因素开展了现代过程研究,检验了不同孢粉多样性指数与现代植物多样性的定量关系,并提出了古植物多样性的一些校正方法[5, 10~11, 35]。
孢粉鉴定分类精度通常达到形态类型、属或是科,与实际植物分类有较大的差异,这有可能造成古植物多样性的低估现象[17]。Weng等[22]分别分析了化石记录中森林、草地植被典型孢粉类群的多样性记录,发现低海拔森林植被带的木本类型花粉多样性与相应花粉丰度呈显著的正相关,而高海拔草原带的草本花粉多样性与相应花粉丰度呈负相关。产生这一现象可能与木本、草本类型花粉的鉴定水平差异有关。在孢粉鉴定工作中,木本植物花粉大多能够鉴定到属一级,而草本植物花粉中仅有少数可以鉴定到属(如菊科蒿属、紫菀属、凤毛菊属等),其大多数只能归并到科(如禾本科、莎草科等)。因而,在草本植物和花粉丰度较大的地区,孢粉多样性可能存在被低估的情况。
孢粉鉴定分类精度与孢粉多样性的代表性问题,可以藉由现代过程来进行定量校正。诸多现代孢粉多样性研究表明,孢粉多样性与植物多样性多成正相关[5, 12, 47, 49]。在植物物种数量较少的草甸等植被分布区,孢粉丰富度与植物丰富度具有较好的对应关系;而在物种多样性较高的草原、热带雨林等植被区域,二者的比例可达到1:2[32, 47]。Odgaard[5]分析了现代孢粉组合与植物多样性的关系,发现在植物多样性越高的样品中,孢粉丰富度指数与植物物种数的偏差越大,由此建立了二者的拟合函数关系;在此基础上校正了化石孢粉多样性序列,认为校正后的孢粉丰富度指数能够更好地反映古植物多样性的变化(图 1)。此外,有学者进一步提出可用R值或REVEALS模型来去除不同孢粉产量的影响,从而校正孢粉多样性与植物多样性的定量关系[5, 11, 35]。

|
图 1 丹麦Draved Forest地区现代植物物种丰富度与孢粉丰富度的拟合曲线(a)及其对Jutland西北部Skånsø湖化石孢粉丰富度指数(标准统计量1000)的校正(b)(修改自Odgaard[5]) Fig. 1 The relationship between floristic richness and palynological richness in Draved Forest (a), and results (b) of transformed palynological richness(aimed at a constant counting sum of 1000)after correcting for lack of taxonomic precision at Skånsø Lake of north-western Jutland, Denmark(modified from Odgaard[5]) |
此外,不同地区植物孢粉的传播方式与景观多样性格局也可能对孢粉多样性的指示意义造成偏差[11, 17]。例如,热带雨林生物多样性较高,林下植被以虫媒植物为主,风媒花粉的传播可能受到较高植被郁闭度的影响[49~50]。孢粉多样性能否反映热带雨林地区的植被多样性?
针对这一问题,Gosling等[50]分别在玻利维亚和加纳进行了孢粉现代过程分析,发现在南美地区热带湿润常绿林、干旱半落叶林和木本草原植被,其孢粉丰富度(以种类数S表征)与孢粉多样性(以Hill指数表征,q =1)分别为86/ 6.8、111/ 21.9和138/ 31.5,其对应的现代植物丰富度与多样性分别为100/ 36.7、80/ 38.7和71/ 39.4;在西非热带湿润常绿林、湿润半落叶林和稀树草原植被,其孢粉丰富度与孢粉多样性分别为144/ 28.3、104/ 4.4和121/ 14.1,其相应的现代植物丰富度与多样性分别为101/ 54.8、87/ 45.5和71/ 34.5。由此可见,孢粉多样性能够捕捉到热带雨林等植被的植物多样性信息。同时,该研究中各种热带植被的孢粉丰富度均明显高于其植物丰富度,究其原因可能是由于孢粉组合包含了经由风力搬运、来自较远源区的花粉类型;另一方面,热带地区孢粉多样性却显著低于植物多样性,其原因可能是孢粉组合中存在丰度占优势的花粉类型,导致孢粉组合均匀度偏低。此外,热带草原的孢粉多样性普遍高于森林,则反映了在具有较高景观多样性(β多样性)与开放度的草原地区,孢粉组合接受了远距离的非地带性镶嵌植被(vegetation mosaic)的贡献[50]。
化石孢粉组合的植物多样性指示意义还可能受到不同沉积过程的影响[43~45]。为了判断湖泊沉积过程对孢粉多样性的影响程度,并遴选有效的孢粉多样性指数,Li[10]利用青藏高原纳木错63个表层沉积物的孢粉组合进行了现代过程检验(图 2)。研究发现,采样点水深或沉积物粒度来代表的沉积过程对表层沉积物孢粉种类数和均匀度的分布有显著影响,水深越大,孢粉种类数越多,而均匀度越低;而孢粉丰富度指数(标准统计量为600)则与水深没有明显的相关性,与Shannon-Wiener指数具有很好的线性拟合关系。这表明经由稀疏化分析建立的孢粉丰富度指数和Shannon-Wiener指数可以有效地排除沉积过程影响,可以应用到纳木错湖相孢粉化石记录中,重建流域尺度植物多样性的长期变化[10]。

|
图 2 青藏高原中部纳木错湖泊表层沉积物各孢粉多样性指数与水深相关分析结果图中R为相关系数,*表示显著相关(p < 0.01)(修改自Li[10]) Fig. 2 Correlation between pollen diversity indices and water depth for surface lake sediments of Nam Co, central Tibetan Plateau. R=correlation coefficient, *is significant correlation(p < 0.01)(modified from Li[10]) |
孢粉多样性现代过程的研究表明孢粉多样性对植物多样性具有显著的指示意义[5, 11~12, 21, 35]。当孢粉统计量较大,或是基于标准统计量进行稀疏化分析处理,可以减少鉴定精度、统计量差异等对孢粉多样性的影响[5, 12, 21];针对研究区域开展的现代过程研究,降低鉴定分类精度、传播方式差异与景观多样性格局的影响,通过不同方法校正孢粉多样性的植被代表性[5, 10~11, 35],明确不同沉积过程对孢粉多样性指标的影响程度[10]。因此,在孢粉多样性现代过程的基础上,古生态学研究可以利用沉积连续、沉积环境相似、孢粉分类标准较统一的化石孢粉序列,来开展古植物多样性历史重建与区域对比[7, 17, 23]。
3 孢粉多样性重建古植物多样性研究与启示国内外学者利用化石孢粉多样性开展了古植物多样性变化及其与气候变化、人类活动关系的研究[5~10, 16~17, 22, 49]。例如,Li[10]对青藏高原中部纳木错湖区现代孢粉多样性指数与沉积过程关系进行检验后(图 2),利用稀疏化方法构建的湖泊沉积物化石孢粉丰富度指数(图 3a)与Shannon-Wiener指数序列,重建出过去8.4 ka以来流域植物多样性经历了逐渐上升的长期变化,并叠加了多次快速变化事件;研究区植物多样性的长期变化,反映了气候持续变冷背景下山地垂直植被带在向低海拔地区迁移的过程中增加了对流域植物多样性与湖泊孢粉多样性的贡献[10](图 3b)。

|
图 3 纳木错化石孢粉种类数、孢粉丰富度E(T600)的稀疏化曲线结果(a)与古植物多样性变化重建结果(b)(修改自Li[10]) Fig. 3 (a)Rarefaction curves of pollen taxa number and palynological richness(aimed at a constant counting number of 600), (b)reconstructed floristic diversity based on pollen diversity indices at Nam Co(modified from Li[10]) |
在人类活动对古植物多样性影响方面,Giesecke等[8]利用湖相沉积序列的化石孢粉丰富度指数等重建了北欧地区全新世植物多样性变化发现(图 4),由于北部研究区冰后期气候与物种迁移的滞后,植物多样性变化微弱;而南部研究区的孢粉丰富度与均匀度在全新世早期与距今6000年至距今1000年期间显著增加,原因是受到了全新世早期气候快速变化驱动与距今6000年左右当地早期农业作物种植活动的贡献。

|
图 4 北欧地区全新世孢粉丰富度E(T500)、植物多样性变化历史(修改自Giesecke等[8])研究点Abbo、Holt和Klot位于北部研究区,Krebs、Tegel和Schwan位于南部研究区 Fig. 4 Records of Holocene floristic richness as indicated by palynological richness in Northearn Europe(aimed at a constant sum of 500). Study sites of Abbo, Holt and Klot were located in the northern area, while those of Krebs, Tegel and Schwan in the southern area(modified from Giesecke et al.[8]) |
有研究尝试利用现代孢粉多样性与植物多样性的数量关系或R值等方法对化石孢粉多样性指数与古植物多样性记录进行校正[5]。例如,Odgaard[5]利用各孢粉类型R值(孢粉丰度与对应母体植物盖度的比值,表征孢粉类型的植被代表性)的经验值及孢粉生产力进行了两套湖相地层化石孢粉多样性数据的校正,发现修订后这两套古植物多样性记录之间的差异显著降低(图 5)。这表明对孢粉多样性的校正有利于更准确地重建古植物多样性变化。

|
图 5 丹麦Store Økssø湖和Navn Sø湖过去6000年孢粉丰富度变化(a)及其校正后涵盖过去3000年的孢粉丰富度变化(b)(修改自Odgaard[5]) Fig. 5 (a)Palynological richness curves for the last 6000 years, and (b) palynological richness after correction for differences in pollen production for the last 3000 years at Store Økssø Lake and Navn Sø Lake, Denmark (modified from Odgaard[5]) |
对过去植物多样性变化及其与气候变化、人类活动等因素相互关系的研究,可以为现今植物多样性格局及其趋势预测建立相似型,为制定植被恢复策略提供历史参考。在诸多古生态研究材料中,化石孢粉组合不仅能够重建植被演替[51~52]与气候变化[53~54],进而追索过去植被生态系统的碳储变化[55]和古人类活动对植被等生态环境的影响[56],也蕴含了植物多样性变化的丰富信息[5, 17, 21]。
目前,通过孢粉资料重建植物多样性的研究工作大多集中于欧洲[17],中国的相关研究较为匮乏。尽管面临着诸多因素的制约[28],国内外古生态学者一直在积极地探索孢粉多样性恢复植物多样性的定量方法与校正方案[17]。利用花粉对古植被多样性的研究终其根本是要与现代生态学相结合,才能从更长的时间尺度为植物多样性的趋势预测和保护决策提供可靠的理论依据。
本文通过对古植物多样性重建中常用孢粉多样性指标和方法的综述,结合现代过程与重建案例分析了各个指标优缺点与校正优化方案的应用等,同时建议在未来研究中要着重注意以下3个问题:
(1) 保证孢粉形态分类标准的一致性与鉴定精度是开展孢粉多样性定量分析与古植物多样性变化区域对比的重要基础。
(2) 如何构建诸如孢粉β多样性[11, 17, 50]与功能多样性(functional diversity)[57~59]等指标,从而建立与现代生态学相结合的孢粉多样性定量方法。这是一个值得深入探索的研究方向。
(3) 需要加强从群落到景观尺度的孢粉多样性现代过程研究,从不同空间尺度孢粉多样性与植物多样性的量化关系、相对花粉产量、花粉源区及其植被代表性、传播与沉积过程等各个方面来有效地降低植物多样性重建结果的不确定性。
致谢: 感谢审稿专家建设性的修改意见。
| [1] |
Ehrlich P R, Wilson E O. Biodiversity studies:Science and policy[J]. Science, 1991, 253(5021): 758-762. DOI:10.1126/science.253.5021.758 |
| [2] |
Pimm S L, Russell G J, Gittleman J L, et al. The future of biodiversity[J]. Science, 1995, 269(5222): 347. DOI:10.1126/science.269.5222.347 |
| [3] |
Thomas C D, Cameron A, Green R E, et al. Extinction risk from climate change[J]. Nature, 2004, 427(6970): 145-148. DOI:10.1038/nature02121 |
| [4] |
Weng E S, Zhou G S. Modeling distribution changes of vegetation in China under future climate change[J]. Environmental Modeling and Assessment, 2006, 11(1): 45-58. DOI:10.1007/s10666-005-9019-1 |
| [5] |
Odgaard B V. Fossil pollen as a record of past biodiversity[J]. Journal of Biogeography, 1999, 26(1): 7-17. DOI:10.1046/j.1365-2699.1999.00280.x |
| [6] |
Lomolino M V. Elevation gradients of species-density:Historical and prospective views[J]. Global Ecology and Biogeography, 2001, 10(1): 3-13. DOI:10.1046/j.1466-822x.2001.00229.x |
| [7] |
Xiao X Y, Shen J, Wang S M, et al. The plant diversity and its relationship with paleoenvironment since 2.78 Ma revealed by pollen records in the Heqing deep drilling core[J]. Chinese Science Bulletin, 2008, 53(23): 3686-3698. DOI:10.1007/s11434-008-0439-6 |
| [8] |
Giesecke T, Wolters S, Jahns S, et al. Exploring Holocene changes in palynological richness in Northern Europe-Did postglacial immigration matter?[J]. PLoS One, 2012, 7(12): e51624. DOI:10.1371/journal.pone.0051624 |
| [9] |
Zhao S J, Ding Z L. Changes in plant diversity on the Chinese Loess Plateau since the Last Glacial Maximum[J]. Chinese Science Bulletin, 2014, 59(31): 4096-4100. DOI:10.1007/s11434-014-0541-x |
| [10] |
Li Quan. Spatial variability and long-term change in pollen diversity in Nam Co catchment (central Tibetan Plateau):Implications for alpine vegetation restoration from a paleoecological perspective[J]. Science China:Earth Sciences, 2018, 61(3): 270-284. DOI:10.1007/s11430-017-9133-0 |
| [11] |
Matthias I, Semmler M S, Giesecke T. Pollen diversity captures landscape structure and diversity[J]. Journal of Ecology, 2015, 103(4): 880-890. DOI:10.1111/1365-2745.12404 |
| [12] |
Felde V A, Peglar S M, Bjune A E, et al. Modern pollen-plant richness and diversity relationships exist along a vegetational gradient in Southern Norway[J]. The Holocene, 2016, 26(2): 163-175. DOI:10.1177/0959683615596843 |
| [13] |
Willis K J, Kleczkowski A, New M, et al. Testing the impact of climate variability on European plant diversity:320000 years of water-energy dynamics and its long-term influence on plant taxonomic richness[J]. Ecology Letters, 2007, 10(8): 673-679. DOI:10.1111/ele.2007.10.issue-8 |
| [14] |
刘鸿雁, 王红亚, 崔海亭. 太白山高山带2000多年以来气候变化与林线的响应[J]. 第四纪研究, 2003, 23(3): 299-308. Liu Hongyan, Wang Hongya, Cui Haiting. Climatic changes and timberline responses over the past 2000 years on the alpine zone of Mt. Taibai[J]. Quaternary Sciences, 2003, 23(3): 299-308. |
| [15] |
Schwark L, Zink K, Lechterbeck J. Reconstruction of postglacial to Early Holocene vegetation history in terrestrial Central Europe via cuticular lipid biomarkers and pollen records from lake sediments[J]. Geology, 2002, 30(5): 463-466. DOI:10.1130/0091-7613(2002)030<0463:ROPTEH>2.0.CO;2 |
| [16] |
Berglund B E, Gaillard M-J, Bjørk L, et al. Long-term changes in floristic diversity in southern Sweden:Palynological richness, vegetation dynamics and land-use[J]. Vegetation History and Archaeobotany, 2008, 17(5): 573-583. DOI:10.1007/s00334-007-0094-x |
| [17] |
Birks H J B, Felde V A, Bjune A E, et al. Does pollen-assemblage richness reflect floristic richness? A review of recent developments and future challenges[J]. Review of Palaeobotany and Palynology, 2016, 228: 1-25. DOI:10.1016/j.revpalbo.2015.12.011 |
| [18] |
Gaston K J. Species richness: Measure and measurement[M]//Gaston K J. Biodiversity-A Biology of Numbers and Differences. Oxford: Blackwell Science Ltd, 1996: 77-113.
|
| [19] |
Harper D A T. Numerical Palaeobiology[M]. New York: John Wiley & Sons, 1999: 1-210.
|
| [20] |
Simpson E H. Measurement of diversity[J]. Nature, 1949, 163(4148): 688. DOI:10.1038/163688a0 |
| [21] |
Birks H J B, Line J M. The use of rarefaction analysis for estimating palynological richness from Quaternary pollen-analytical data[J]. The Holocene, 1992, 2(1): 1-10. DOI:10.1177/095968369200200101 |
| [22] |
Weng C Y, Hooghiemstra H, Duivenvoorden J F. Response of pollen diversity to the climate-driven altitudinal shift of vegetation in the Colombian Andes[J]. Philosophical Transactions of the Royal Society B, 2007, 362(1478): 253-262. DOI:10.1098/rstb.2006.1985 |
| [23] |
张芸, 孔昭宸, 阎顺, 等. 新疆天山北坡地区中晚全新世古生物多样性特征[J]. 植物生态学报, 2005, 29(5): 836-844. Zhang Yun, Kong Zhaochen, Yan Shun, et al. Palaeo-biodiversity at the northern piedmont of Tianshan Mountains in Xinjiang during the Middle to Late Holocene[J]. Acta Phytoecologica Sinica, 2005, 29(5): 836-844. |
| [24] |
Hurlbert S H. The non-concept of species diversity:A critique and alternative parameters[J]. Ecology, 1971, 52(4): 577-586. DOI:10.2307/1934145 |
| [25] |
Hammer Ø, Harper D A T, Ryan P D. Paleontological statistics software package for education and data analysis[J]. Palaeontologia Electronica, 2001, 4(1): 9. |
| [26] |
Colwell R K. Estimate S: Statistical Estimation of Species Richness and Shared Species from Samples, Version 9, User's Guide and Application[EB/OL]. 2013. http://purl.oclc.org/estimates.
|
| [27] |
Simberloff D S. Properties of the rarefaction diversity measurement[J]. American Naturalist, 1972, 106(949): 414-418. DOI:10.1086/282781 |
| [28] |
Weng C Y, Hooghiemstra H, Duivenvoorden J F. Challenges in estimating past plant diversity from fossil pollen data:Statistical assessment, problems, and possible solutions[J]. Diversity and Distributions, 2006, 12(3): 310-318. DOI:10.1111/ddi.2006.12.issue-3 |
| [29] |
Palazzesi L, Barreda V D, Cuitino J I, et al. Fossil pollen records indicate that Patagonian desertification was not solely a consequence of Andean uplift[J]. Nature Communications, 2014, 5: 3558. DOI:10.1038/ncomms4558 |
| [30] |
马克平. 生物群落多样性的测度方法Ⅰ:α多样性的测度方法(上)[J]. 生物多样性, 1994, 2(3): 162-168. Ma Keping. The measurement of community diversity Ⅰ:The measurement of α diversity[J]. Biodiversity Science, 1994, 2(3): 162-168. DOI:10.17520/biods.1994027 |
| [31] |
Birks H J B. Numerical analysis methods[M]//Elias S A, Mock C J. Encyclopedia of Quaternary Sciences. Amsterdam: Elsevier, 2013: 821-830.
|
| [32] |
Odgaard B V. Reconstructing past biodiversity development[M]//Elias S A, Mock C J. Encyclopedia of Quaternary Sciences. Amsterdam: Elsevier, 2013: 816-820.
|
| [33] |
Tipper J C. Rarefaction and rarefiction-The use and abuse of a method in palaeoecology[J]. Paleobiology, 1979, 5(4): 423-434. DOI:10.1017/S0094837300016924 |
| [34] |
Brown A G. Biodiversity and pollen analysis:Modern pollen studies and the recent history of a floodplain woodland in SW Ireland[J]. Journal of Biogeography, 1999, 26(1): 19-32. DOI:10.1046/j.1365-2699.1999.00281.x |
| [35] |
Giesecke T, Ammann B, Brande A. Palynological richness and evenness:Insights from the taxa accumulation curve[J]. Vegetation History and Archaeobotany, 2014, 23(3): 217-228. DOI:10.1007/s00334-014-0435-5 |
| [36] |
Pielou E. The measurement of diversity in different types of biological collections[J]. Journal of Theoretical Biology, 1966, 13: 131-144. DOI:10.1016/0022-5193(66)90013-0 |
| [37] |
Buzas M A, Gibson T G. Species diversity:Benthonic Foraminifera in western north Atlantic[J]. Science, 1969, 163(3862): 72-75. DOI:10.1126/science.163.3862.72 |
| [38] |
Greenberg J H. The measurement of linguistic diversity[J]. Language, 1956, 32(1): 109-115. DOI:10.2307/410659 |
| [39] |
Gotelli N J, Ellison A M. A Primer of Ecological Statistics[M]. Sunderland: Sinauer, 2013: 1-200.
|
| [40] |
Hill M O. Diversity and evenness:A unifying notation and its consequences[J]. Ecology, 1973, 54(2): 427-432. DOI:10.2307/1934352 |
| [41] |
Chao A, Chiu C H, Jost L. Phylogenetic diversity measures based on Hill numbers[J]. Philosophical Transactions of the Royal Society B, 2010, 365(1558): 3599-3609. DOI:10.1098/rstb.2010.0272 |
| [42] |
Chao A, Gotelli N J, Hsieh T C, et al. Rarefaction and extrapolation with Hill numbers:A framework for sampling and estimation in species diversity studies[J]. Ecological Monographs, 2014, 84(1): 45-67. DOI:10.1890/13-0133.1 |
| [43] |
Davis M B, Brubaker L B. Differential sedimentation of pollen grains in lakes[J]. Limnology and Oceanography, 1973, 18(4): 635-646. DOI:10.4319/lo.1973.18.4.0635 |
| [44] |
Sugita S. A model of pollen source area for an entire lake surface[J]. Quaternary Research, 1993, 39(2): 239-244. DOI:10.1006/qres.1993.1027 |
| [45] |
Luly J G. Modern pollen dynamics and surficial sedimentary processes at Lake Tyrrell, semi-arid northwestern Victoria, Australia[J]. Review of Palaeobotany and Palynology, 1997, 97(3): 301-318. |
| [46] |
Odgaard B V. Palaeoecological perspectives on pattern and process in plant diversity and distribution adjustments:A comment on recent developments[J]. Diversity and Distributions, 2001, 7(4): 197-201. DOI:10.1111/ddi.2001.7.issue-4 |
| [47] |
Meltsov V, Poska A, Odgaard B V, et al. Palynological richness and pollen sample evenness in relation to local floristic diversity in Southern Estonia[J]. Review of Palaeobotany and Palynology, 2011, 166(3-4): 344-351. DOI:10.1016/j.revpalbo.2011.06.008 |
| [48] |
Tinner W, Colombaroli D, Heiri O, et al. The past ecology of Abies alba provides new perspectives on future responses of silver fir forests to global warming[J]. Ecological Monographs, 2013, 83(4): 419-439. DOI:10.1890/12-2231.1 |
| [49] |
Flenley J R. Palynoloigcal richness and the tropical rainforest[M]//Bermingham E, Dick C W, Mortitz C. Tropical Rainforests-Past, Present, and Future. Chicago: University of Chicago Press, 2005: 72-77.
|
| [50] |
Gosling W D, Julier A C M, Adu-Bredu S, et al. Pollen-vegetation richness and diversity relationships in the tropics[J]. Vegetation History and Archaeobotany, 2018, 27(2): 411-418. DOI:10.1007/s00334-017-0642-y |
| [51] |
倪健. 孢粉生物群区化与古植被定量重建[J]. 第四纪研究, 2013, 33(6): 1091-1100. Ni Jian. Biomisation and quantitative palaeovegetation reconstruction[J]. Quaternary Sciences, 2013, 33(6): 1091-1100. |
| [52] |
李洁, 许清海, 张生瑞, 等. 相对花粉产量及其在古植被定量重建中的应用[J]. 第四纪研究, 2013, 33(6): 1101-1110. Li Jie, Xu Qinghai, Zhang Shengrui, et al. Relative pollen productivity and its use in quantitative reconstruction of paleovegetation[J]. Quaternary Sciences, 2013, 33(6): 1101-1110. |
| [53] |
郑卓, 张潇, 满美玲, 等. 中国及邻区利用孢粉进行古气候定量重建的回顾与数据集成[J]. 第四纪研究, 2016, 36(3): 503-519. Zheng Zhuo, Zhang Xiao, Man Meiling, et al. Review and data integration of pollen-based quantitative paleoclimate reconstruction studies in China and adjacent areas[J]. Quaternary Sciences, 2016, 36(3): 503-519. |
| [54] |
秦锋, 赵艳. 基于孢粉组合定量重建古气候的方法在中国的运用及思考[J]. 第四纪研究, 2013, 33(6): 1054-1068. Qin Feng, Zhao Yan. Methods of quantitative climate reconstruction based on palynological data and their applications in China[J]. Quaternary Sciences, 2013, 33(6): 1054-1068. |
| [55] |
吴海斌, 郭正堂, 彭长辉. 末次间冰期以来陆地生态系统的碳储量与气候变化[J]. 第四纪研究, 2001, 21(4): 366-376. Wu Haibin, Guo Zhengtang, Peng Changhui. Changes in terrestrial carbon storage with global climate changes since the last interglacial[J]. Quaternary Sciences, 2001, 21(4): 366-376. |
| [56] |
胡雅琴, 曹现勇, 赵志军, 等. 西辽河上游全新世早中期环境变化及其对人类活动的影响[J]. 第四纪研究, 2016, 36(3): 530-541. Hu Yaqin, Cao Xianyong, Zhao Zhijun, et al. The palaeoenvironmental and palaeoclimatic reconstruction and the relation with the human activities during the Early and Middle Holocene in the upper Western Liao River region[J]. Quaternary Sciences, 2016, 36(3): 530-541. |
| [57] |
Collins P M. Drivers of Holocene Land Cover Changes in Europe[D]. Switzerland: The Doctor's Dissertation of École Polytechnique Fédérale de Lausanne, 2013: 81-88. https://www.researchgate.net/publication/283622824_Drivers_of_Holocene_Land_Cover_Change_in_Europe
|
| [58] |
Davis B A S, Collins P M, Kaplan J O. The age and post-glacial development of the modern European vegetation:A plant functional approach based on pollen data[J]. Vegetation History and Archaeobotany, 2015, 24(2): 303-317. DOI:10.1007/s00334-014-0476-9 |
| [59] |
Reitalu T, Gerhold P, Poska A, et al. Novel insights into post-glacial vegetation change:Functional and phylogenetic diversity in pollen records[J]. Journal of Vegetation Science, 2015, 26(5): 911-922. DOI:10.1111/jvs.2015.26.issue-5 |
Abstract
The history of floristic diversity and its relationship with climate change and human activities can serve as important analogues for the contemporary plant diversity, and offer historical references for the recovery of floristic diversity. So far, many paleoecologists have studied the modern process of pollen diversity and reconstructed the long-term variations in floristic diversity based on fossil pollen data. However, these studies are challenged by many biases such as the inadequate accuracy in pollen identification, and the influences from different mechanisms of pollen dispersal, pollen source areas, vegetation representation, and various sedimentation processes. This paper briefly reviews some quantitative indices and methods in pollen diversity analysis, including pollen taxon number, palynological richness, evenness, Simpson index and Shannon-Wiener index. These biases in the analysis of pollen diversity and the reconstruction of paleo-floristic diversity are also discussed here, as well as some possible solutions and calibration methods. We highlighted a need for the promotion of taxonomic accuracy and consistency in pollen counting for the regional correlation of pollen diversity and paleo-floristic diversity. Besides, efforts for the building of β diversity and functional diversity for pollen diversity indices are also encouraged in order to integrate the pollen-based floristic diversity into the category of modern macroecology study. Furthermore, investigations on modern pollen diversity are emphasized for the calibration between pollen diversity and floristic diversity, which can offer us quantitative information to estimate and eliminate the influences from differences in pollen dispersal and sedimentation process, and to promote the reliability of reconstructed paleo-floristic diversity.