2 东华理工大学, 江西 南昌 330013;
3 中国地震灾害防御中心, 北京 100029;
4 中国地震局地震预测研究所, 北京 100036)
位于中国黄土高原黄土区和欧洲黄土区之间的中亚干旱区是世界上主要的黄土分布区之一。中亚黄土对研究亚洲内陆干旱化、亚洲粉尘来源、亚洲季风和西风环流变化以及两者在中亚相互作用历史均具有重要意义[1~2]。中亚干旱区黄土究竟形成于气候暖干的间冰期[3~5]还是气候冷湿的冰期[6~8]目前尚存争论[2]。显然,准确测定黄土的堆积时代是解决这一争论的关键之一。
不少学者已对中亚东北部天山北坡、中南部塔吉克斯坦、西昆仑山北坡等地区的黄土沉积开展了研究工作[2, 9~24]。在中亚南部帕米尔高原不同时代晚第四纪地貌面上广泛分布有厚约1~2 m的黄土沉积,杨小平[5]曾简要报道了帕米尔高原东部塔什库尔干谷地的黄土分布。目前对此区域黄土的研究较少,这些黄土形成于何时?不同地貌面上堆积的黄土是否是同期的?
中亚地区黄土粒径较粗,以粉砂至粘土为主,成壤作用微弱,大多无植被发育,往往缺乏可供14C测年的理想物质。近些年,释光测年技术在精度、年代上限和可用信号上均取得了较大进展[25],已在中国天山北麓[26~27]和伊犁盆地[28~35]为代表的中亚黄土堆积区得到了应用。伊犁盆地黄土石英光释光与14C年代的对比表明,光释光年代超过3万年的黄土样品,14C年代出现系统低估[28, 30, 33, 36],而对于不同释光测年方法的系统比较则揭示,无论是对于天山北麓[27]还是伊犁盆地[35]的黄土,当钾长石红外激发后红外释光年代超过4万年,石英光释光年代也出现了系统低估;这种低估在塔吉克斯坦黄土的石英光释光测年中也被观察到,但可以通过分离出快组分信号而得到抑制[37]。在利用钾长石红外激发后红外释光信号测年时,则需注意热转移信号的干扰[35]。这些结果揭示了释光测年方法应用于中亚地区黄土时的复杂性,需慎重选择合适的测年方法和测量条件。单片剂量再生法(Single-aliquot regenerative-dose protocol,简称SAR)[38]和多片再生剂量法(Multiple-aliquot regenerative-dose protocol,简称MAR)[39~40]是目前石英光释光测年应用最为广泛的测年方法。对于较为年轻(< 4万年)的黄土样品,SAR方法与MAR方法测量结果一致[39, 40]。Li等[41]通过SAR法测量建立了全球通用的石英光释光标准生长曲线(Global Standardised Growth Curve,简称gSGC),可以更快捷地获得样品的释光年龄。石英SAR法及gSGC是否适用于帕米尔黄土光释光测年?
本文选择新疆帕米尔高原瓦恰盆地位于不同地貌面上的两个黄土剖面,通过细颗粒石英蓝光释光测年分别确定黄土的沉积时代及速率,检验了石英光释光信号标准生长曲线(Standardised Growth Curve,简称SGC)与全球石英光释光信号标准生长曲线(gSGC)的适用性,为进一步开展帕米尔高原黄土古环境研究提供年代框架。
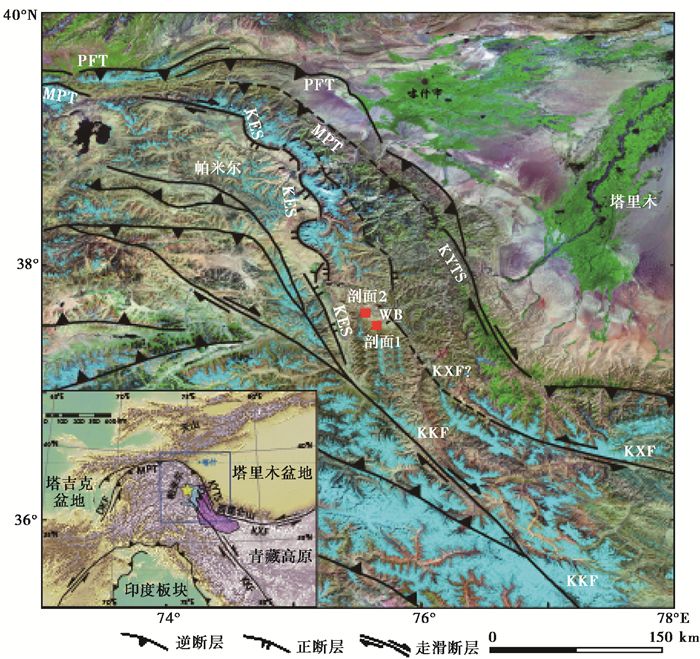
1 研究区域地质背景与样品采集帕米尔高原位于塔里木盆地西南,天山山脉以南,塔吉克盆地以东,总体呈向北凸出的弧形。瓦恰盆地是帕米尔高原东部一近北西向展布、与喀拉喀什断层相关的断陷盆地(图 1),发育北西流向的瓦恰河,从盆地流出汇入塔什库尔干河与叶尔羌河。盆地平均海拔大于3600 m,第四纪冰川作用频繁[42],属高原高寒干旱-半干旱气候。据盆地以西约20 km的塔什库尔干县气象数据统计,在1971~2000年间平均年降水量为68 mm,65 %的降雨在5月至8月,6月和1月的平均最高气温分别为3.7 ℃和-18.6 ℃[43]。
|
图 1 帕米尔高原卫星影像与瓦恰盆地研究剖面位置[44] KES——公格尔拉张系(Kongur Extensional System);KKF——喀喇昆仑断层(Karakoram Fault);KXF——喀拉喀什断层(Karakax Fault);KYTS——喀什-叶城转换带(Kashgar-Yecheng transfer Fault);MPT——主帕米尔断层(Main Pamir Thrust);PFT——帕米尔前缘推覆系(Pamir Frontal Thrust);WB——瓦恰盆地(Waqia Basin) Fig. 1 The satellite image showing the loess sections in Waqia Basin of the Pamir Plateau[44] |
Hedrick等[42]对瓦恰盆地的第四纪地层与地貌演化进行了较详细的研究,将瓦恰盆地中的冰碛地貌与冰碛物由老而新划分为M1至M6共6个冰期并获得了其10Be暴露年龄,其中M1为倒数第二次冰期或更老的冰期堆积,M2为倒数第二次冰期晚期堆积,M3为末次冰期早期可能是深海氧同位素4阶段(MIS 4)堆积,M4是MIS 2可能是末次冰盛期堆积,M5是晚冰期堆积,M6是全新世早期冰碛物;此外,沿瓦恰河由低而高发育了T4、T3、T2、T1共4级河流阶地,Hedrick等[42]采用10Be测年获得各阶地的暴露年龄分别约为70 ka、100 ka、120 ka和580 ka。
在瓦恰盆地南部不同期次地貌面上可见广泛的风成黄土分布,厚0.5~2.0 m不等。在盆地西南瓦恰河西南岸,我们选择两个典型黄土剖面进行了系统的样品采集(见图 1)。
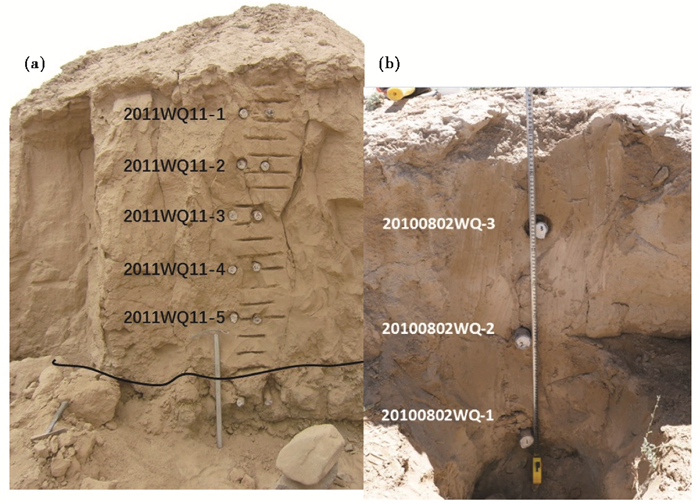
剖面1(37°31′24″N,75°39′59″E;海拔3782 m)位于瓦恰河南岸-北流支沟东岸的冰水堆积台地面上。该台地面海拔高度3770~3783 m,高出现代沟床约80~90 m,地形相对较平坦,其形成时间可能与瓦恰河T2阶地面同期。上覆厚度小于2 m的风成黄土。剖面1露头厚度约2.2 m(图 2a):上部为浅黄棕色粘土质粗粉砂堆积,岩性与颜色均一,疏松多孔,可见明显的垂直节理,根须发育,未见任何水平层理及古土壤发育,是一典型风成黄土堆积,厚约1.8 m;下部为略见层理的含细砾砂土,分选一般,砾石次棱状,属冰水堆积,厚约0.3 m;底部为大小混杂、分选磨圆极差的冰碛物,未见底。在上部约1.8 m的黄土堆积中用不锈钢管密封采集了5个光释光测年样品(采样间距约为30 cm),每个样用自封袋另外采集了约500 g用作环境剂量率测量;5个样品的野外编号见图 2a,对应的实验室编号和采样深度见表 1。
|
图 2 黄土剖面及采样位置图 (a)剖面1露头及样品编号(sample numbers of section 1);(b)剖面2露头及释光样品编号(sample numbers of section 2) Fig. 2 The loess sections and the samples locations |
| 表 1 剖面1和2各样品环境剂量率、等效剂量及年龄* Table 1 The does rates, equivalent doses and ages of the samples in sections 1 and 2 |
剖面2位于剖面1以北26 km的瓦恰河西南岸T3河流阶地面上(37°34′47″N,75°40′01″E;海拔3475 m),T3阶地面拔河高度90~100 m,要比剖面1低约300 m。该剖面上部为浅灰橙色粘土质粉砂(图 2b),岩性均一,偶含细砾,根须发育,块状结构,未见层理,为风成黄土堆积,厚约1.2 m;下部为青灰色中、粗砾河床相砾石堆积,分选、磨圆较好,未见底。在该剖面黄土中用不锈钢管密封采集了3个光释光测年样品(取样间距约为30 cm);其对应的野外编号见图 2b,实验室编号和采样深度见表 1。
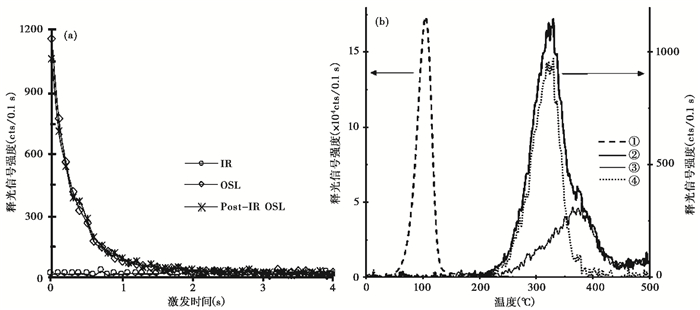
2 光释光测年 2.1 测量方法、样品前处理本批样品在暗室中采用常规细颗粒石英前处理方法[40, 45]。去除钢管样两端曝光部分后,取出约50~100 g置于1000 ml烧杯中,加入少量蒸馏水搅拌,加入双氧水(H2O2)去除样品中的有机质,加入盐酸去除样品中的碳酸盐物质;用蒸馏水洗至中性后利用静水沉降法从中性悬浊液中分离出4~11 μm细颗粒组分;用30 %氟硅酸溶液刻蚀3~12天,去除长石矿物后,再加入盐酸去除氟化物;最后将样品用蒸馏水洗至中性后低温烘干,制成细颗粒石英测片。随机抽取每个样品中的两个测片采用Duller[46]提出的红外蓝光逐出比法及110 ℃热释光(TL)峰法来检验石英样品是否纯净。图 3a和图 3b显示,样品红外释光信号(IRSL)基本为零,石英红外后蓝光释光信号(Post-IR OSL)与蓝光释光信号(OSL)衰减很快,其比值(逐出比)均在0.9~1.1之间,石英110 ℃特征热释光峰峰形完整,表明样品石英纯度已达到释光测量要求。
|
图 3 样品11-310的IRSL,post-IR OSL和OSL衰减曲线(a)与热释光曲线(b) Fig. 3 IRSL, post-IR OSL and OSL decay curve (a) and thermoluminescence curve (b) of sample 11-310 |
将每个样品搅匀后取一部分烘干置于玛瑙研钵中充分研磨至 < 63 μm。剖面1样品取450 g密封装入马林杯放置21 d后,采用经严格标定的GEM70P4-95高纯锗Gamma能谱仪[47]测量24 h,获得样品U、Ra、Th、K核素的比活度(表 1)。剖面2由于样品量较少,取10 g样品采用已标定的Daybreak 583型厚源alpha计数仪[48]测量6 d(探测区直径为42 mm),获得样品α计数率。钾含量在中国科学院地球环境研究所用X荧光光谱分析方法测定,误差小于10 %。本批样品细颗粒石英α系数采用0.045±0.005[49](表 1)。剖面1样品采集时已是干样,剖面2样品采集前曾下过雨,因此实验室实测含水量并不能代表实际含水量。考虑到该地区年降水量较低,我们假定样品含水量为10±5 %。计算环境剂量率时采用了Adamiec和Aitken[50]的转换系数,用采样点纬度及样品埋深计算了宇宙射线的贡献[51]。
3.3 等效剂量测定本文采用石英单片再生法(SAR)[38]测量样品的等效剂量,释光测量在中国地震局地质研究所释光年代学实验室完成。所用丹麦TL/OSL-DA-20C/D测量仪激发光源包括蓝光(波长470±20 nm,最大功率80 mw/cm2)和红外二极管(波长880±40 nm,最大功率148 mw/cm2),测量时激发光强设为最大功率的90 %。机载90Sr/90Y源细颗粒石英剂量率为0.1051 Gy/s,释光信号由前置了1个7 mm厚U-340滤光片的EMIQA9235型光电倍增管(PMT)探测。
从图 3a可见样品已基本无长石信号,post-IR OSL和OSL发光曲线完全重叠;经蓝光激发2 s后测片释光信号基本趋于本底,其光释光信号以快速组分为主(图 3a);图 3b黑虚线①为附加剂量87 Gy后进行260 ℃预热时的热释光曲线,发育典型110 ℃峰;黑实线②为接着加热至500 ℃时的曲线(L1),以325 ℃峰为主;淡实线③为该测片又附加剂量87 Gy进行260 ℃预热后先用机载蓝光激发40 s然后再加热至500 ℃时的曲线(L2),以375 ℃峰为主;点虚线④则为曲线(L1)减去(L2)后的量即被蓝光晒退的信号量,正好对应于325 ℃峰,这表明该样品石英OSL信号主要源于325 ℃热释光信号所对应的陷阱电子。本批样品都具有上述特征,表明适于采用Murray和Wintle[38]的石英单测片再生剂量法(SAR)。在SAR法等效剂量测量步骤结束后,对各测片采用Duller[46]提出的石英纯度检验法检测其释光信号是否受长石影响。
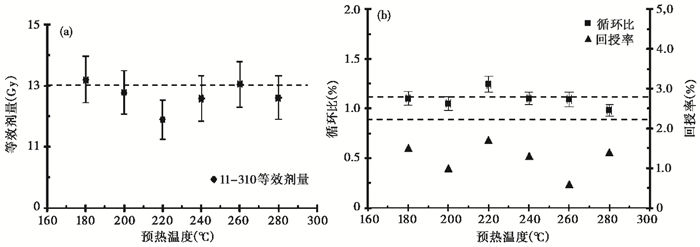
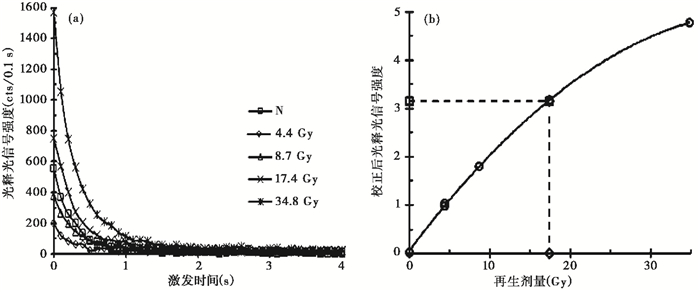
为了确定合适的预热温度,首先选择样品11-310进行了剂量恢复实验(实验室给定剂量:13 Gy,预热温度区间:180~280 ℃,步长20 ℃)。从图 4a和图 4b中可看出,当预热温度为260 ℃时,剂量恢复比在0.9~1.1之间,且回授率均小于2 %。因此本批石英样品测量时的预热温度选用260 ℃,预热时间10 s,实验剂量预热220 ℃,预热时间5s。图 5a和图 5b为此实验条件下11-310样品的释光信号衰减曲线、生长曲线。
|
图 4 样品11-310剂量恢复实验图(a)与循环比、回授率与预热温度关系图(b)虚线代表 10 %的误差范围区间 Fig. 4 Dose recovering tests (a) and the relationship of recycling ratio, recuperation and pre-heat temperature (b) of sample 11-310. The dash line means 10 % errors range |
|
图 5 样品11-310光释光信号衰减曲线(a)与SAR法光释光信号生长曲线(b) Fig. 5 OSL decay curve (a) and SAR protocol growth curve (b) of sample 11-310 |
每个细颗粒石英样品测量6~12个测片,采用Analyst程序计算每个测片的等效剂量。石英光释光信号取前0.4 s,本底采用最后30~40 s的平均值。对于每个样品,去除红外蓝光逐出比值在0.9~1.1之外的测片,采用有效测片等效剂量的算术平均值获得该样品的等效剂量(表 1)。
2.4 样品的光释光年龄根据每个样品测量获得的等效剂量与环境剂量率计算得到两剖面各样品的光释光年龄(表 1和图 6)。图 6显示两个剖面黄土样品的释光年龄序列与地层层序相符,未出现年龄倒置。剖面1黄土样品石英光释光年龄界于4.7~14.3 ka,剖面2黄土样品石英光释光年龄界于5.5~9.3 ka。

|
图 6 黄土剖面1(a)与剖面2(b)样品深度与石英光释光年龄 趋势线是对样品年龄数据的线性拟合,其斜率即为沉积速率 Fig. 6 The depth-OSL ages graph of samples in loess sections 1 (a)and 2 (b) Trend line fits in with the age data of samples, and the slope is deposition rate |
Roberts和Duller[52]在2004年提出了释光信号标准生长曲线(SGC)方法,通过对样品SAR法测量建立了一条通用的石英释光信号剂量响应曲线。在确定一个样品的等效剂量值时,只需测量该样品天然光释光信号(Ln)和实验剂量光释光信号(Tn),利用这条曲线就可以估算出该样品的等效剂量值,不再需要对每个样品单独建立相应的生长曲线,极大地节省了测量时间。Lai等[53~54]对中国黄土高原样品的研究结果表明,不同地点、不同剖面的样品同样存在相似的生长曲线,可以建立SGC;进而提出全球不同大陆的黄土有可能建立统一的SGC。Stevens等[55]却认为SGC法仅能适用于同一个剖面。Li等[41]选择亚洲、非洲、欧洲和北美等不同地区石英样品,通过再归一建立了全球通用的石英光释光标准生长曲线(gSGC)。本文检验了SGC和gSGC方法在瓦恰盆地黄土光释光测年中的适用性。
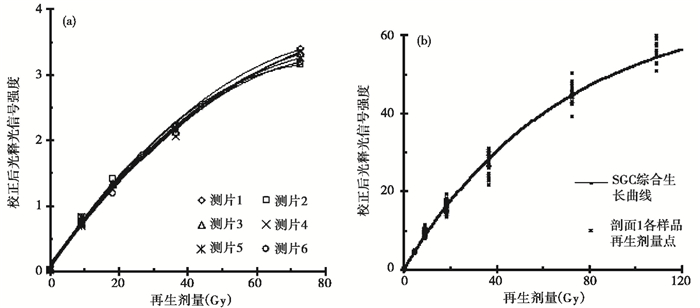
建立一条可用于不同样品的光释光标准生长曲线,前提条件是每个样品不同测片及多个样品的生长曲线具有相同的剂量响应特征。剖面1样品14-21所有测片的生长曲线如图 7a所示,在剂量小于60 Gy的范围内,他们的形状高度一致,标准生长曲线方法对该样品是适用的。
|
图 7 14-21样品6个测片的SAR法光释光信号生长曲线(a)与剖面1综合生长曲线(b) Fig. 7 Sample 14-21 SAR protocol growth curves of six aliquots (a) and stander growth curve of section 1 (b) |
我们选取剖面1中11-310和14-23的7至8个测片,将其再生剂量点标准化((Lx/Tx)×TD)后构建区域综合生长曲线(图 7b)。用饱和指数方程Y=a×(1-exp(-(X+c)/b))进行拟合,其中Y=Ln/Tn×TD,a=67.9,b=67.4,c=0.304。据此公式,只需测得样品的天然剂量:Ln/Tn,再乘以实验剂量(TD),即可便捷地估算样品的等效剂量(X)。先利用此区域综合生长曲线计算了剖面1和2各样品每个测片的SGC等效剂量,然后采用算术平均计算获得每个样品的SGC等效剂量值(表 2)。
| 表 2 各样品SAR法等效剂量与SGC、gSGC结果对比 Table 2 The equivalent doses determined by SAR, SGC and gSGC methods, respectively |
选取与样品等效剂量最为接近的再生剂量点Li/Ti作为归一化点对天然剂量点Ln/Tn进行归一后,利用Li等[41]提出的全球通用石英光释光综合生长曲线(gSGC),计算了所有测片的等效剂量,并采用算术平均获得了各样品的gSGC等效剂量值(表 2)。
从表 2可见,瓦恰盆地两个黄土剖面每个样品分别采用SGC法和gSGC法获得的等效剂量与其实测SAR法等效剂量值在误差范围内是一致的。这验证了本批SAR法获得光释光年龄的可靠性,也表明在60 Gy范围内SGC法与gSGC法适用于瓦恰盆地的黄土测年。
4 初步认识与讨论帕米尔高原瓦恰盆地南部不同地貌面上均发育厚约1~2 m的近源风成黄土,该黄土呈黄褐色,质地疏松,发育垂直节理,无层理,粒径较粗,以粉砂和极细砂为主,偶含细砾,与典型的灰黄到黄红色、多空隙、无层理、粒级0.01~0.05 mm粉砂组成的典型黄土高原黄土[56]明显不同。
采自瓦恰盆地的黄土样品石英光释光信号主要源于325 ℃热释光信号所对应陷阱电子,以快速组分为主(图 3a和3b),适于采用Murray和Wintle[38]的石英单测片再生剂量法(SAR)测年。两个剖面黄土石英SAR法光释光年龄序列与地层层序相符,未出现年龄倒置。每个样品分别采用释光信号标准生长曲线法(SGC)和全球石英光释光标准生长曲线法(gSGC)获得的等效剂量与其实测SAR法等效剂量值在误差范围内是一致的。这表明在60 Gy范围内瓦恰盆地黄土石英适合采用SAR、SGC与gSGC法进行测年。
瓦恰盆地剖面1黄土样品石英SAR法光释光年龄界于4.7~14.3 ka(见表 1),沉积速率在8.6±0.6 ka附近存在一明显拐折,在8.6 ka之前为0.11 mm/a,之后加速至0.15 mm/a;剖面2黄土样品石英SAR法光释光年龄界于5.5~9.3 ka,沉积速率为0.18 mm/a,明显要大于剖面1,这可能是由于该剖面海拔低于剖面2且靠近瓦恰河谷,具更充足的粉尘供应。该区黄土的沉积速率显然要比黄土高原区的沉积速率要大,且全新世有加快的趋势。
本研究为进一步开展帕米尔高原黄土古环境研究提供年代框架。根据沉积速率估算剖面1黄土堆积于17.2 ka至2.7 ka之间,剖面2黄土堆积于10.1 ka至3.6 ka之间,略晚于剖面1,且远比其所在地貌面的年龄要年轻。这有可能是之前堆积的风成黄土未能保存下来所致;也有可能表明,瓦恰盆地风成黄土主要堆积于末次冰盛期末至全新世晚期,推测可能是中纬度西风带和印度夏季风共同作用的产物,不同时代地貌面上黄土堆积可能是同期的。我们更倾向于后者,这一认识尚需要这两个剖面及更多黄土剖面详细粒度分析与磁化率分析曲线的验证。此外剖面1沉积速率在8.6±0.6 ka附近的突变是否反映了8.2 ka的快速变冷事件的存在或气候波动[57~59],也需更密集地(约10 cm采样间距)在该剖面采集样品进行光释光测年来予以验证。
致谢: 感谢王昌盛、杨会丽在光释光测年方面的帮助,美国辛辛那提大学Kathryn Hedrick参加了野外样品的采集,感谢审稿人和编辑部老师的细致审阅及建议。
| [1] |
Ding Feng, Ding Zhongli. Chemical weathering history of the southern Tajikistan loess and paleoclimate implications. Science in China (Series D), 2003, 46(10): 1013-1024. |
| [2] |
冉敏, 杨奇丽, 黄昌庆. 中亚哈萨克斯坦南部VA黄土剖面过去~25000 a来沉积地层特征. 干旱区地理, 2013, 36(6): 979-986. Ran Min, Yang Qili, Huang Changqing. Sedimentary strata record in VA loess section from the southern Kazakhstan during past 25000 a. Arid Land Geography, 2013, 36(6): 979-986. |
| [3] |
Deviatkin E V. Meridional distribution of Pleistocene ecosystems in Asia:Basic problems. Stratigraphy and Geological Correlation, 1993, 1: 439-444. |
| [4] |
Pakhnmov M M. Phyto-indicative features of climatic changes in Middle Asian Mountains. Bulletin of the Commission on the Quaternary Research, 1987, 56: 95-102. |
| [5] |
杨小平. 塔里木盆地边缘山地的黄土沉积. 干旱区地理, 2000, 23(1): 13-18. Yang Xiaoping. Loess-deposits in the surrounding mountains of Tarim Basin, Northwestern China. Arid Land Geography, 2000, 23(1): 13-18. |
| [6] |
Bronger A. Correlation of loess-paleosol sequences in East and Central Asia with SE Central Europe:Towards a continental Quaternary pedostratigraphy and paleoclimatic history. Quaternary International, 2003, 106: 11-31. |
| [7] |
Ding Z L, Ranov V, Yang S L et al. The loess record in southern Tajikistan and correlation with Chinese loess. Earth and Planetary Science Letters, 2002, 200(3-4): 387-400. DOI:10.1016/S0012-821X(02)00637-4 |
| [8] |
Vandenberghe J, Renssen H, Huissteden K V et al. Penetration of Atlantic westerly winds into Central and East Asia. Quaternary Science Reviews, 2006, 25(17-18): 2380-2389. DOI:10.1016/j.quascirev.2006.02.017 |
| [9] |
方小敏, 蒋平安, 杨胜利等. 昆仑山黄土与中国西部沙漠发育和高原隆升. 中国科学(D辑), 2001, 31(3): 177-184. Fang Xiaomin, Jiang Ping'an, Yang Shengli et al. The relationship among loess depositions in Kunlun Mountain and the development of China western desert and the uplift of Tibetan Plateau. Science in China (Series D), 2001, 31(3): 177-184. |
| [10] |
唐自华, 穆桂金, 陈冬梅等. 昆仑山北坡近5000年以来黄土堆积的环境信息. 第四纪研究, 2007, 27(4): 598-606. Tang Zihua, Mu Guijin, Chen Dongmei et al. Eolian deposits in northern slope of Kunlun Mts and their palaeoenvironmental implications during the past 5000 years. Quaternary Sciences, 2007, 27(4): 598-606. |
| [11] |
史正涛. 亚洲中部中更新世以来气候环境变化——来自天山北坡黄土沉积的证据. 云南师范大学学报:自然科学版, 2006, 26(4): 66-69. Shi Zhengtao. Climate changes in Center Asia since the Middle Pleistocene-Study from loess sediment in north slop of Tianshan Mt. Journal of Yunnan Normal University(Natural Science), 2006, 26(4): 66-69. |
| [12] |
史正涛, 董铭. 天山黄土粒度特征及粉尘来源. 云南师范大学学报:自然科学版, 2007, 27(3): 55-57. Shi Zhengtao, Dong Ming. Characteristics of loess grain size and source of dust in Tianshan. Journal of Yunnan Normal University (Natural Science), 2007, 27(3): 55-57. |
| [13] |
宋友桂, 史正涛, 方小敏等. 伊犁黄土的磁学性质及其与黄土高原对比. 中国科学:地球科学, 2010, 40(1): 61-72. Song Yougui, Shi Zhengtao, Fang Xiaomin et al. Loess magnetic properties in the Ili Basin and their correlation with the Chinese Loess Plateau. Science China:Earth Sciences, 2010, 40(1): 61-72. |
| [14] |
宋友桂, 李越, 陈秀玲等. 塔吉克斯坦黄土矿物与稀土元素组成特征. 地球环境学报, 2014, 5(2): 145-154. Song Yougui, Li Yue, Chen Xiuling et al. Mineralogical and REE geochemical compositions of Tajikistan loess. Journal of Earth Environment, 2014, 5(2): 145-154. DOI:10.7515/JEE201402012 |
| [15] |
陈秀玲, 李金婵, 方红等. 末次冰期以来新疆伊犁黄土的稀土元素特征及环境演变. 第四纪研究, 2017, 37(1): 14-24. Chen Xiuling, Li Jinchan, Fang Hong et al. Rare earth element characteristics and environmental changes recorded by loess deposition in the Yili Basin since the last glaciation. Quaternary Sciences, 2017, 37(1): 14-24. |
| [16] |
邱思静, 陈一凡, 王振等. 天山北麓乌鲁木齐河阶地晚更新世黄土磁学特征及古气候意义. 第四纪研究, 2016, 36(5): 1319-1330. Qiu Sijing, Chen Yifan, Wang Zhen et al. Rock magnetic properties and paleoclimatic implications of Late Pleistocene loess in the range front of the Vrümqi River, Xinjiang, NW China. Quaternary Sciences, 2016, 36(5): 1319-1330. |
| [17] |
王涛, 刘秀铭, 吕镔等. 新疆尼勒克黄土岩石磁学特征及变化机制研究. 第四纪研究, 2014, 34(3): 491-503. Wang Tao, Liu Xiuming, Lü Bin et al. Study of rock magnetic properties and its variation mechanism of loess in Nileke, Xinjiang. Quaternary Sciences, 2014, 34(3): 491-503. |
| [18] |
邓少福, 杨太保, 秦宏毅等. 新疆塔城黄土-古土壤磁化率特征及其影响因素. 中国沙漠, 2011, 31(4): 848-854. Deng Shaofu, Yang Taibao, Qin Hongyi et al. Magnetic susceptibility and its influencing factors from loess-paleosol in Tacheng, Xinjiang, China. Journal of Desert Research, 2011, 31(4): 848-854. |
| [19] |
昝金波, 杨胜利, 方小敏. 西昆仑山黄土1 Ma以来的粒度变化特征及其古气候意义. 地球环境学报, 2014, 5(2): 120-126. Zan Jinbo, Yang Shengli, Fang Xiaomin. Grain size composition of West Kunlun Mountains loess in the past 1 Ma and its paleoclimatic implications. Journal of Earth Environment, 2014, 5(2): 120-126. DOI:10.7515/JEE201402009 |
| [20] |
Li Guoqiang, Rao Zhiguo, Duan Yanwu et al. Paleoenvironmental changes recorded in a luminescence dated loess paleosol sequence from the Tianshan Mountains, arid Central Asia, since the Penultimate Glaciation. Earth and Planetary Science Letters, 2016, 448: 1-12. DOI:10.1016/j.epsl.2016.05.008 |
| [21] |
陈杰, 杨太保, 曾彪等. 中国帕米尔地区黄土磁化率特征及其影响因素. 干旱区地理, 2016, 39(4): 761-769. Chen Jie, Yang Taibao, Zeng Biao et al. Magnetic susceptibility features and influencing factors in Pamir, China. Arid Land Geography, 2016, 39(4): 761-769. |
| [22] |
张克旗. 新疆昆仑山北坡黄土细颗粒混合矿物IRSL,. 第四纪研究, 2012, 32(3): 527-534. Zhang Keqi. Preliminary studies on dating using IPSL and[post-IR]OSL signals from fine-grained quartz in loess at northern slope of Kunlun Mts, Xinjiang. Quaternary Sciences, 2012, 32(3): 527-534. |
| [23] |
李冠华, 夏敦胜, 温仰磊等. 天山北麓典型黄土沉积序列的磁学特征及主控因子初探. 第四纪研究, 2013, 33(5): 900-910. Li Guanhua, Xia Dunsheng, Wen Yanglei et al. Rock magnetism of the loess paleosol sequences in north of the Tianshan Mountains, Northwest China. Quaternary Sciences, 2013, 33(5): 900-910. |
| [24] |
丁仲礼, 韩家楙, 杨石岭等. 塔吉克斯坦南部黄土沉积. 第四纪研究, 2000, 20(2): 171-177. Ding Zhongli, Han Jiamao, Yang Shiling et al. A brief introduction of loess deposits in Southern Tadjikistan. Quaternary Sciences, 2000, 20(2): 171-177. |
| [25] |
Rhodes E J. Optically stimulated luminescence dating of sediments over the past 200, 000 years. Annual Review of Earth and Planetary Sciences, 2011, 39(1): 461-488. DOI:10.1146/annurev-earth-040610-133425 |
| [26] |
Li G Q, Wen L J, Xia D S et al. Quartz OSL and K-feldspar pIRIR dating of a loess/paleosol sequence from arid central Asia, Tianshan Mountains, NW China. Quaternary Geochronology, 2015, 28: 40-53. DOI:10.1016/j.quageo.2015.03.011 |
| [27] |
Li G Q, Rao Z G, Duan Y W et al. Paleoenvironmental changes recorded in a luminescence dated loess/paleosol sequence from the Tianshan Mountains, arid Central Asia, since the Penultimate Glaciation. Earth and Planetary Science Letters, 2016, 448: 1-.12. DOI:10.1016/j.epsl.2016.05.008 |
| [28] |
Feng Z D, Ran M, Yang Q L et al. Stratigraphies and chronologies of Late Quaternary loess-paleosol sequences in the core area of the Central Asian arid zone. Quaternary International, 2011, 240(1-2): 156-166. DOI:10.1016/j.quaint.2010.10.019 |
| [29] |
E C Y, Lai Z P, Sun Y J et al. A luminescence dating study of loess deposits from the Yili River basin in Western China. Quaternary Geochronology, 2012, 10: 50-55. DOI:10.1016/j.quageo.2012.04.022 |
| [30] |
Song Y G, Li C X, Zhao J D et al. A combined luminescence and radiocarbon dating study of the Ili loess, Central Asia. Quaternary Geochronology, 2012, 10: 2-7. DOI:10.1016/j.quageo.2012.04.005 |
| [31] |
Yang S L, Forman S L, Song Y G et al. Evaluating OSL-SAR protocols for dating quartz grains from the loess in Ili Basin, Central Asia. Quaternary Geochronology, 2014, 20: 78-88. DOI:10.1016/j.quageo.2013.11.004 |
| [32] |
Kang S G, Wang X L, Lu Y C et al. A high-resolution quartz OSL chronology of the Talede loess over the past~30 ka and its implications for dust accumulation in the Ili Basin, Central Asia. Quaternary Geochronology, 2015, 30(B): 181-187. |
| [33] |
Song Y G, Lai Z P, Li Y et al. Comparison between luminescence and radiocarbon dating of Late Quaternary loess from the Ili Basin in Central Asia. Quaternary Geochronology, 2015, 30 B: 405-410. |
| [34] |
Li Y, Song Y G, Lai Z P et al. Rapid and cyclic dust accumulation during MIS 2 in Central Asia inferred from loess OSL dating and grainsize analysis. Scientific Report, 2016, 6: 32365. DOI:10.1038/srep32365 |
| [35] |
Qin J T, Zhou L P. Luminescence dating of the Zeketai loess section in the Ili Basin, Northwestern China:Methodological considerations. Journal of Asian Earth Science, 2018, 155: 146-153. DOI:10.1016/j.jseaes.2017.11.018 |
| [36] |
Song Y G, Luo D, Du J H et al. Radiometric dating of Late Quaternary loess in the northern piedmont of South Tianshan Mountains:Implications for reliable dating. Geological Journal, 2018. |
| [37] |
Zhou L P, Fu D P, Zhang J F. An analysis of the components of the luminescence signals of selected polymineral and quartz samples from loess in Western China and Southern Tajikistan, and their suitability for optical dating. Quaternary Geochronology, 2010, 5: 149-153. DOI:10.1016/j.quageo.2009.05.008 |
| [38] |
Murray A S, Wintle A G. Luminescence dating of quartz using an improved single-aliquot regenerative-dose protocol. Radiation Measurements, 2000, 32(1): 57-73. DOI:10.1016/S1350-4487(99)00253-X |
| [39] |
Zhou L P, Shackleton N J. Photon-stimulated luminescence of quartz from loess and effects of sensitivity change on palaeodose determination. Quaternary Science Reviews, 2001, 20: 853-857. DOI:10.1016/S0277-3791(00)00024-X |
| [40] |
Lu Y C, Wang X L, Wintle A G. A new OSL chronology for dust accumulation in the last 130, 000 yr for the Chinese Loess Plateau. Quaternary Research, 2007, 67(1): 152-160. DOI:10.1016/j.yqres.2006.08.003 |
| [41] |
Li Bo, Roberts R G, Jacobs Z et al. Potential of establishing a 'global standardised growth curve'(gSGC) for optical dating of quartz from sediments. Quaternary Geochronology, 2015, 27: 94-104. DOI:10.1016/j.quageo.2015.02.011 |
| [42] |
Hedrick K, Owen L A, Chen J et al. Quaternary history and landscape evolution of a high altitude intermountain basin at the western end of the Himalayan Tibetan orogeny, Waqia Valley, Chinese Pamir. Geomorphology, 2017, 284: 156-174. DOI:10.1016/j.geomorph.2016.09.002 |
| [43] |
Owen L A, Chen J, Hedrick K A et al. Quaternary glaciation of the Tashkurgan Valley, Southeast Pamir. Quaternary Science Reviews, 2012, 47: 56-72. DOI:10.1016/j.quascirev.2012.04.027 |
| [44] |
陈杰, 李涛, 孙建宝等. 2016年11月25日新疆阿克陶MW6.6地震发震构造与地表破裂. 地震地质, 2016, 38(4): 1160-1174. Chen Jie, Li Tao, Sun Jianbao et al. Coseismic surface ruptures and seismogenic Muji fault of the 25 November 2016 Arketao MW6.6 earthquake in northern Pamir. Seismology and Geology, 2016, 38(4): 1160-1174. |
| [45] |
Aitken M J. An Introduction to Optical Dating. London: Oxford University Press, 1998: 39-50.
|
| [46] |
Duller G A T. Distinguishing quartz and feldspar in single grain luminescence measurements. Radiation Measurements, 2003, 37(2): 161-165. DOI:10.1016/S1350-4487(02)00170-1 |
| [47] |
杨会丽, 陈杰. ORTECGEM 70P4-95 P型高纯锗γ谱仪的标定. 核技术, 2012, 11(35): 1-5. Yang Huili, Chen Jie. Calibration of the ORTEC Ptype Ge γ-ray spectrometer. Nuclear Techniques, 2012, 11(35): 1-5. |
| [48] |
王同利, 陈杰, 杨传成. Daybreak厚源α计数仪的标定及测量影响因素的初步研究. 地震地质, 2001, 27(4): 633-644. Wang Tongli, Chen Jie, Yang Chuancheng. Calibration of Daybreak thick source alpha counter and preliminary study of influencing factors. Seismology and Geology, 2001, 27(4): 633-644. |
| [49] |
Rees Jones J. Optical dating of young sediments using fine grain quartz. Ancient TL, 1995, 13(2): 9-14. |
| [50] |
Adamiec G, Aitken M. Dose rate conversion factors:Update. Ancient TL, 1998, 16(2): 37-50. |
| [51] |
Prescott J R, Hutton J T. Cosmic ray contribution to dose rates for luminescence and ESR dating:Large depth and long term time variations. Radiation Measurements, 1994, 23(2-3): 497-500. DOI:10.1016/1350-4487(94)90086-8 |
| [52] |
Roberts H M, Duller G A T. Standardized growth curves for optical dating of sediment using multiple grain aliquots. Radiation Measurements, 2004, 38(2): 241-252. DOI:10.1016/j.radmeas.2003.10.001 |
| [53] |
Lai Z P. Testing the use of an OSL Standardised growth curve(SGC) for De determination on quartz from the Chinese Loess Plateau. Radiation Measurements, 2006, 41(1): 9-16. DOI:10.1016/j.radmeas.2005.06.031 |
| [54] |
Lai Z P, Bruckner H, Zoller L et al. Existence of a common growth curve for silt-sized quartz OSL of loess from different continents. Radiation Measurements, 2007, 42(9): 1432-1440. DOI:10.1016/j.radmeas.2007.08.006 |
| [55] |
Stevens T, Armitage S J, Lu H Y et al. Examining the potential of high sampling resolution OSL dating of Chinese loess. Quaternary Geochronology, 2007, 2(1-4): 15-22. DOI:10.1016/j.quageo.2006.03.004 |
| [56] |
刘东生等. 黄土与环境. 北京: 科学出版社, 1985: 191-196. Liu Tungsheng et al. Loess and Environment. Beijing: Science Press, 1985: 191-196. |
| [57] |
Eelco J R, Heiko P. Centennial-scale climate cooling with a sudden cold event around 8, 200 years ago. Nature Review, 2005, 434: 975-979. |
| [58] |
刘嘉丽, 刘强, 储国强等. 大兴安岭四方山天池15.4 ka B.P.以来湖泊沉积记录. 第四纪研究, 2015, 35(4): 901-912. Liu Jiali, Liu Qiang, Chu Guoqiang et al. Sediment record at Lake Sifangshan in the central-northern part of the Great Xing'an range, Northeast China since 15.4 ka B.P.. Quaternary Sciences, 2015, 35(4): 901-912. |
| [59] |
章云霞, 叶玮, 马春梅等. 浙江北湖桥孔色度记录的早-中全新世环境变化. 第四纪研究, 2016, 36(5): 1331-1342. Zhang Yunxia, Ye Wei, Ma Chunmei et al. Environment variabilities archived by color of the drill core Beihuqiao in Hangjiahu Plain during Early-Mid Holocene, China. Quaternary Sciences, 2016, 36(5): 1331-1342. |
| [60] |
贾红娟, 汪敬忠, 秦小光等. 罗布泊地区晚冰期至中全新世气候特征及气候波动事件. 第四纪研究, 2017, 37(3): 510-521. Jia Hongjuan, Wang Jingzhong, Qin Xiaoguang et al. Climate and abrupt events record in the Lop Nur region Late Glacial to the middle Holocene. Quaternary Sciences, 2017, 37(3): 510-521. |
2 East China University of Technology, Nanchang 330013, Jiangxi;
3 China Earthquake Disaster Prevention Center, Beijing 100029;
4 Institute of Earthquake Forecasting, China Earthquake Administration, Beijing 100036)
Abstract
Loess deposited in Central Asia bears great significance for investigating the history of aridification in Inner Aisa, the provenance of Asian dust, the variation of Asian monsoon and the Westerly and their interplay. Aeolian loess deposits, with a thickness of 1~2 m, are widely deposited on the Pamir Plateau, which is located in the south of Central Asia. In this study, the chronology framework of two loess sections in Waqia Basin located in the northeast of Pamir Plateau is established by employing the fine-grained quartz(fgQ) luminescence dating technique. Section 1 loess(37°31'24″N, 75°39'59″E; elevation for 3782 m) is 1.8 m thick and located on the top of glacial-fluvial deposit on the south bank of Waqia River, 5 loess samples collected from this section. 26 km to the north of section 1, section 2 loess(37°34'47″N, 75°40'01″E; elevation for 3475 m) is 1.2 m thick and deposited on the T3 terrace on the southwest bank of Waqia River, 3 loess samples collected from this section. The optically stimulated luminescence(OSL) signal of the fgQ is dominated by the fast component and originates from the electron traps responsible for the 325℃ thermoluminescence(TL) peak. The equivalent doses determined by using both the conventional standardized growth curve(SGC) and global standardized growth curve(gSGC) methods are consistent with each other within uncertainties, and it indicates that both two methods are applicable to loess deposits in Waqia Basin. The OSL ages determined by single aliquot regenerative(SAR) dose protocol suggest that the aeolian dust is deposited between 14.3 ka and 4.7 ka for these two sections. The sedimentation rate increases from 0.11 mm/a at the early stage to 0.15~0.18 mm/a during the Holocene. According to the accumulation rate, the section 1 loess is deposited between 17.2 ka and 2.7 ka, mainly from the late glacial to Late Holocene, much younger than the surface it deposited. This study provides a preliminary chronological framework for reconstructing the paleoenvironment by using loess deposited on the Pamir Plateau. 2018, Vol.38

