 2018, Vol.38


地表过程是联系地貌格局和地球深部过程反馈机制的桥梁[1~9]。地表侵蚀是地表过程的关键一环。基于从源到汇的通量研究是目前约束地表侵蚀广泛采用的方法,如碎屑物质的沉积速率[10~16]、通过宇宙成因核素计算的侵蚀速率[17~19]。然而,通过这些方法得到的侵蚀和沉积速率是区域平均状况的反映;碎屑物质在从源到汇的过程中,驻留时间和“埋藏-再搬运”的循环过程可能使得通过汇区与源区得到的侵蚀速率存在较大差别,仅通过对“汇”的通量研究难以揭示区域侵蚀过程的差异,更无法揭示地表起伏的变化[20~21]。
地表过程通过对地表物质进行重新分配而影响地壳温度场。对流和扩散是地壳热传导的主要方式,地表侵蚀使得来自地壳深部的热量伴随岩石运动向上对流,这一过程对地温场的扰动又通过扩散机制演化至稳定状态。随着构造活动和地表侵蚀的变化,地温场发生相应变化[22~24],地温场变化的历史可反映地表侵蚀剥露的历史。同时,地温场也决定着地壳中矿物的物理和化学行为[24~27]。温度较高时,矿物是高扩散性的开放体系,受到放射性核素辐照时生成的物质(如He)或产生的次级效应(如裂变径迹、释光)无法在矿物中保存记录;随温度降低,这些物质和次级效应开始逐渐在矿物中被保存下来[24~27]。低温热年代方法可揭示处于深部地壳的岩石由于侵蚀剥露作用而被带向地表过程中的温度变化历史,并结合地壳热运动模型将其转化为地表的侵蚀剥露速率,是目前研究侵蚀剥露历史最为有效的手段之一[20, 26]。低温热年代学方法已用于对数百万年尺度上的区域地貌演化过程进行重建[24~27],而万年至数十万年尺度侵蚀剥露过程的重建则是其空白和难点。最近发展的释光低温热年代学方法有可能填补这一空白。
矿物中热释光和光释光信号的积累与温度相关,是潜在的记录过去温度变化信息的载体。相比于其他热年代体系,矿物释光信号对较低的温度更加敏感,如30~40 ℃[28~30],因此,释光信号可作为一种理想的低温热年代计[28]。释光低温热年代学研究在过去近十年中取得了显著进展[31~32]。鉴于前人已对该方法的发展历史、技术流程和研究实例进行了总结[31~32],本文将侧重前人综述未涉及或未做详细论述的方面,拟从基本原理出发,介绍浅部地壳的矿物释光信号如何记录地表侵蚀过程和地形起伏,阐述释光低温热年代学方法的特点,总结其应用现状和方法学进展,在此基础上讨论释光低温热年代学研究面临的挑战。
1 释光低温热年代学的基本原理 1.1 释光信号饱和比例与岩石热历史的关系岩石中的石英和长石等矿物晶体在吸收围岩和自身放射性核素,如U238、Th232及其子体和40 K衰变释放的能量后,所产生的自由电子将被由于晶格缺陷而产生的陷阱所俘获,被俘获电子在陷阱中的存留时间(即寿命)由其稳定性决定。一般而言,温度越高,寿命越短,随着温度降低,陷阱电子的寿命呈指数增长,因而相对能更为长期地驻留在陷阱中。陷阱电子的数量随晶体受辐照时间增加而增加,直至陷阱俘获电子的速率与电子逃离陷阱的速率相同时不再增加,达到稳态。当晶体受到光、热等能量激发时,陷阱电子吸收能量发生逃逸并漂移至晶体发光中心附近与空穴复合并释放光子,该光子即为热释光或光释光[33~34]信号。此过程可通过如下方程定量描述。
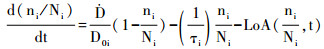
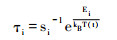
假设石英或长石晶体中有i类不同的电子陷阱,相应陷阱的数量为Ni,矿物每千年吸收的放射性能量为剂量率Ḋ(Gy/ka)。一方面,晶体吸收辐照剂量导致电子不断被陷阱俘获,致使陷阱以一定速率趋于饱和。假设t时刻,陷阱已俘获电子的数量为ni,此时陷阱俘获电子的速率由未被填充陷阱的比例(1-ni/Ni)、辐照剂量率和陷阱的特征饱和剂量D0i(Gy),即方程(1)右端第1项决定。特征饱和剂量D0i表征陷阱趋向饱和的速率:当矿物接收D0i剂量的辐照后,电子将填充63 %的陷阱。另一方面,由于晶格热振动,被俘获的陷阱电子以方程(1)右侧第2项决定的速率发生逃逸,其中τi(ka)为陷阱电子在某一温度下的寿命,由方程(2)所示的Arrhenius方程决定,其中si(s-1)为陷阱的振动频率因子,描述陷阱电子因晶格振动而发生逃逸的概率;Ei(eV)为陷阱深度,反映电子逸出陷阱所需的能量,kB(eV/K)为玻尓兹曼常数,其值为8.617×10-5 eV/K,T (t)为t时刻的岩石温度(以热力学温标K为单位)。该方程是将矿物释光信号用于热年代学研究的理论基础[28, 31~32, 35~38]。方程(1)右侧第3项为与热稳定性无关的陷阱电子逃逸速率(Loss of Athermal fading,简称LoA),与温度无关,仅与陷阱电子数量和时间相关。对于长石释光信号,该项通常被称为异常衰减,被认为是由于陷阱电子的隧道效应而导致[39];目前已发展出诸多模型对该效应进行校正[40~41]。
|
(1) |
|
(2) |
若已知温度T随时间t的变化,将方程(1)对时间积分,即可得到任意时刻t,陷阱i的饱和比例。饱和比例越高,对应的表观年龄越老;饱和比例接近1时,对应的表观年龄为最小年龄。对于热年代学研究,样品温度的变化历史T (t)是未知的,需要利用实测的陷阱饱和比例通过方程(1)进行反演而得到。目前的释光热年代学研究中,多采用数值技术进行模拟,并不需要将天然释光信号强度转化为表观年龄。由于陷阱数量Ni和俘获电子数量ni难以测量,一般以样品天然释光信号强度与饱和释光信号强度的比值表征陷阱电子的饱和比例(ni/Ni)。下面扼要说明利用释光低温热年代学方法确定岩石冷却历史的基本流程(表 1):
| 表 1 利用释光低温热年代学方法确定岩石冷却历史的基本流程 Table 1 Basic procedure for determining rock cooling history of low temperature luminescence thermochronology |
首先,在避光和水冷却条件下钻取岩石样品内部未曝光部分,并在水冷却条件下粉碎后,通过化学处理和密度分离获取释光测年中常用的石英和钾长石颗粒。然后,利用单片或多片再生剂量法测量矿物的天然释光信号强度(Sn),建立释光信号的剂量响应曲线,获取释光信号的最大饱和强度(Ssat)及特征饱和剂量(D0),计算信号的饱和比例(Sn/Ssat),其等效于陷阱饱和比例(n/N)。利用以上测片通过脉冲退火或等温衰减实验得到陷阱深度(E)和频率因子(s),测定由于非热原因导致的信号衰减特征,如长石释光信号的异常衰减速率,并据此确定方程(1)右侧第3项随时间变化的规律。
获得上述参数后,便可通过蒙特卡洛方法,随机生成若干种(通常是数万种)温度随时间变化的可能方式,称为T-t路径[42]。将这些温度变化情形代入方程(1)中,计算相应的陷阱饱和比例及其与实测陷阱饱和比例的差异,以此差异计算该温度变化情形的概率。理论与实测值差异越小,相应温度变化情形的可能性越大。最终,通过比较不同T-t路径的概率,获得样品可能的温度变化历史。释光热年代体系与其他热年代体系的显著不同是矿物释光信号不会无限增长。约定俗成地,当陷阱饱和比例达到0.86时,即认为释光信号已达饱和[43],得到的热年代为最小年龄,相应剥露速率为最大值[36]。需要指出,为了阐述基本原理的方便,方程(1)所描述的是陷阱电子不发生再俘获的一级动力学情形,其他更复杂的非一级动力学过程可参考文献[32, 38]的研究。详细的流程和技术细节可参考相应的综述文章[31~32]。
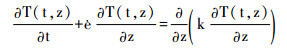
1.2 岩石热历史与地表侵蚀剥露的关系如引言所述,释光热年代计所记录的岩石温度变化历史反映了地温场对构造活动和地表过程扰动的响应。我们以仅考虑垂直方向侵蚀剥露的一维情形为例,阐述侵蚀剥露、地温场变化和释光信号饱和比例之间的关系。一维侵蚀情形下的地壳温度随深度和时间的变化可利用方程(3)描述[25, 44]:
|
(3) |
方程(3)中T(t,z)为地下深度z(km)处、在时刻t(ka)的温度,k(m2/s)为岩石的热扩散系数,ė(mm/a)为侵蚀速率。在一定初值和边值条件下解方程(3)即可得到一维侵蚀情形下的T(t,z)。假设地壳浅层的初始地温梯度为30 ℃/km,地表温度恒定保持在0 ℃,以5 mm/a的速率发生侵蚀剥露。剥露过程中,据Simpson[44]的程序计算得到的地温随深度的变化如图 1a中不同线条所示。侵蚀开始时,地温梯度为30 ℃/km;随着侵蚀过程持续,地温梯度变大,经过500 ka后,地温场达到新的稳态(即地温场不再随侵蚀过程而变化),同一深度的温度发生了不同程度增加。

|
图 1 一维剥露情形下地温场与岩石样品温度及石英不同释光信号随时间的变化 (a)地温-深度关系随时间的变化(t=0 ka为剥露开始时,线间时间间隔为50 ka,剥露持续时间为700 ka)以及3.2 km深处一岩石样品在剥露过程中的深度-温度路径(点间时间间隔为50 ka);(b)岩石由于剥露作用而被带向地表的过程中温度随时间的变化,由(a)中地温-深度随时间的变化和样品在剥露过程中的深度变化计算得到;(c)岩石样品中石英矿物不同深度陷阱的释光信号饱和比例随时间的变化,其中阴影区为信号饱和区域 Fig. 1 Evolution of the geothermal field, rock temperature and luminescence signals of quartz grains from the rock under the one-dimension exhumation scenario.(a)Evolution of depth-temperature relationships during the erosion(t=0 ka means the beginning of erosion, which lasts for 700 ka, and the interval between the lines is 50 ka). The solid circles show the depth-temperature path of a rock sample during the erosion; (b)The temporal change of rock temperature during its exhumation to Earth surface in response to the erosion; (c)The accumulation of quartz luminescence signals relevant to electron traps with different depths and the shaded zone shows the luminescence signals are in saturation |
侵蚀作用开始时,假设一岩石样品处于3.2 km深处,环境温度为96 ℃。剥露过程中,岩石样品以5 mm/a的速率向地表运动,温度-深度路径如图 1a的实心点所示;经历了约500 ka剥露后,样品深度为0.7 km,温度为约35 ℃,此时地温场重新回到稳态;经历640 ka剥露后,样品到达地表被剥蚀进入碎屑沉积中,温度始终与地表温度平衡处于0 ℃,图 1b显示了这一过程中样品温度随时间的变化。假设该岩石样品中的石英晶体有4类热稳定性不同的陷阱,深度Ei分别为1.56 eV、1.61 eV、1.66 eV和1.71 eV,频率因子si均为1013 s-1,陷阱饱和剂量D0i均为200 Gy,环境辐照剂量率为3 Gy/ka。将通过方程(3)计算得到的T(t,z)代入方程(2),并对方程(1)进行积分即可得到剥露过程中与不同陷阱有关的释光信号饱和比例变化(图 1c)。在岩石剥露冷却过程中,不同释光信号开始计时的温度不同,其饱和比例也不相同。与1.1中所述的通过饱和比例约束冷却历史相似,剥露历史的获得亦是通过比较各种剥露情形下,利用方程(1)~ (3)得到的陷阱饱和比例与实测释光信号饱和比例的差异而获得。
图 1c显示,陷阱深度最大的释光信号起始积累时间最早。热年代学研究中,为理解方便,引入了封闭温度的概念。在特定冷却速率下,若样品某种释光信号表观年代为A,那么A年前样品的温度定义为该热年代计在相应冷却速率下的封闭温度[45],封闭温度与样品的冷却速率本身呈正相关。热年代表征了样品自通过封闭温度所对应的地温等温面到取样时所经历的时间。总体而言,封闭温度的高低反映了热年代体系的温度敏感区间。不同热年代体系对温度的敏感区间不同。现有研究显示石英光释光和长石红外释光信号积累对温度敏感的范围为30~100 ℃[31~32],意味着当温度大于100 ℃时,陷阱不能有效俘获电子;当温度小于30 ℃时,陷阱虽继续俘获电子,但已无法记录后续的温度变化信息。由于剥露过程造成岩石温度降低,温度变化历史也常表述为冷却历史或冷却速率。
1.3 释光热年代与地形起伏的关系第四纪以来周期性气候变化引起冰川、河流和坡面侵蚀,地表形态持续发生着强烈变化,理解这些过程的关键在于重建过去的侵蚀历史及地形变化。
地壳深部的高温等温面不易受局部地形起伏影响,较为平直;而接近浅表的低温等温面受地表过程影响显著。对于有限起伏的地形,近地表等温面形状随地形而起伏,相对于山脊,山谷处的近地表等温面更密集[24]。有限地形对地温场的扰动随深度增加以指数方式衰减,其衰减速率反比于地形起伏的波长,Braun等[24]指出在深度为λ/2π(λ为地形波长)时,温度扰动减小为地表值的1/e(约0.37)。图 2a示意性地显示了在二维地形起伏(水平方向-X轴和垂直方向-Z轴)下,地温场等温线如何受上部地形影响。山谷处向下的钻孔序列样品(圆圈),贯穿山体的水平隧道序列样品(三角),以及沿山坡的高程序列样品(方块)是热年代研究中常用的几种取样方式[46]。若石英光释光和长石红外释光信号封闭温度分别为30 ℃和70 ℃[31~32],那么两种信号敏感温度的等温线不同程度地保留了上部地形信息(图 2a),相应释光信号的饱和比例可记录地形起伏变化的信息。图 2b显示了钻孔序列样品随深度增加,温度升高,两种释光信号饱和比例由饱和或接近饱和而逐渐减小至零。由于长石红外释光信号饱和剂量显著大于石英,即使其封闭温度相对较高,同一样品长石红外释光信号的饱和比例仍可能小于石英。基于等温线分布特性,水平隧道中部温度高于两端,因此,两种释光信号的饱和比例在水平方向上的变化与等温线及地形起伏相对应(图 2c)。由于石英光释光信号封闭温度的等温线与上部地形起伏大体一致,假设侵蚀剥露过程未造成地形起伏的显著变化,那么图 2a中不同高程样品几乎同时越过石英光释光信号封闭温度对应的等温线,给出几乎相同的饱和比例(图 2d);长石红外释光信号的封闭温度等温线相对更加平直,因此高程较高样品通过等温线后所经历时间更长,其饱和比例随高程增加而增加(图 2d)。由上述讨论可见,释光低温热年代学可通过不同的取样策略,从多个维度揭示地形起伏和侵蚀剥露的历史。

|
图 2 地形起伏对地壳浅部地温场与不同类型序列样品释光信号饱和比例分布样式的影响示意图(据文献[24, 26]修改) (a)地形起伏对地温场等温线的影响及热年代学研究常用的取样策略,图中水平距离尺度可视为20 km,地形波长相应为10 km;山谷区钻孔样品(圆圈)序列(b)、贯穿山体水平隧道样品(三角)序列(c)和沿山坡高程样品(方块)序列(d)的石英光释光(蓝色空心)和长石红外释光信号(橙色实心)饱和比例的分布样式如图(b)、(c)和(d)所示 Fig. 2 Effect of topographic relief on the crustal thermal field and on the pattern of saturation ratio of luminescence signals obtained from various sample series, modified from references [24, 26]. (a)Effect of topographic relief on the shape of crustal isotherms and the frequently employed sampling strategies for thermochronology. The borehole samples are labeled as circles and the pattern of the saturation ratios of quartz(blue open)and feldspar(orange solid)of these samples are shown in (b), the samples from horizontal tunnel across the mountain range are labeled as triangles and the pattern of the saturation ratios are shown in (c), and the samples from the elevation profile along the hill slope are labeled as triangles and the pattern of the saturation ratios are shown in (d) |
相比于其他低温热年代学方法,释光低温热年代学有其独到之处。当冷却速率介于200~1000 ℃/Ma时,石英蓝光释光信号和长石红外释光信号的封闭温度分别介于45~60 ℃[30~32]和60~75 ℃[31~32, 37],两者适用于过去300 ka以来地表过程的重建。虽然磷灰石U-Th/He体系的封闭温度与此相近[24, 26~27],然而,对于300 ka以来的时间尺度,该体系中4 He浓度低于现有仪器的检测限[47],使其难以应用于短时间尺度的剥露过程研究。
热年代研究中常采用“矿物对”方法约束冷却速率,假设同一样品有两种不同的矿物A和B,封闭温度分别为TA和TB(TA>TB),测得其表观热年代分别为tA和tB(tA>tB),那么,在距今tA到tB的时段内,岩石的冷却速率为(TA-TB)/(tA-tB)[24]。两种矿物热年代越接近,意味着岩石冷却速率越高。因此,仅通过同一样品不同矿物的热年代,即可估算该岩石的表观冷却速率。如图 1c所示,对于同一岩石样品,可选择钾长石或石英等不同矿物,甚至对同一矿物颗粒,在一次测量中,采用不同测量条件即可获得热稳定性差异显著的多种释光信号[33~34, 48~51],从而有可能获得该岩石不同时期的表观冷却速率。Qin等[52]提出了利用多种释光信号对岩石冷却历史进行约束的新方法,以石英不同热稳定性释光信号为例,通过数值模拟证实了多种释光热年代计可有效减小反演冷却速率的不确定性和对边界条件的要求,不仅可获得冷却速率,还可估算样品的现代温度。随后多种释光信号热年代计方法被扩展至长石红外释光信号[32, 42, 53]。除减小估算冷却速率的不确定性外,由于不同释光信号计时的起始温度不同,多种释光信号热年代计方法能反映更大温度范围、更加连续的温度变化信息,反映不同的地质地貌过程[36, 42]。
与对陷阱深度具有选择性的光释光信号不同,矿物不同温度的热释光信号直接对应了热稳定性不同的陷阱电子,随温度升高,信号热稳定性增加[33]。理想情况下,可从一条热释光发光曲线中获得一个样品连续的温度变化历史。Tang和Li[54~55]通过对采自怒江的岩石样品石英和钾长石热释光与等温热释光信号的系统测量,发现等效剂量随温度升高而逐渐增加,但不同样品存在差异,意味着这些样品冷却历史并不相同;Biswas等[56]则进一步尝试将钾长石热释光曲线作为连续热年代谱,发展了对热释光曲线不同温度区间信号热稳定性参数进行快速计算的方法,为未来利用不同热释光年代计进行不同地质时期冷却和剥露历史的重建提供了基础。这是释光热年代方法的一个天然优势所在。
3 释光低温热年代学方法研究及其应用现状释光低温热年代学方法已被用于地表剥露与构造和气候之间关系的研究。Herman等[28, 32]将释光低温热年代学方法用于第四纪冰川极为发育、构造活动强烈的新西兰南阿尔卑斯剥露历史研究,通过石英光释光信号揭示了该地区末次冰期以来的剥露速率是稳定的,且与百万年以来长时间尺度的剥露速率没有差异,意味着构造变形是该区侵蚀速率的主控因素[28];并利用长石多种红外释光信号,揭示了该地区侵蚀速率存在显著的空间差异[32]。De Sarkar等[57]通过石英释光低温热年代学研究了西喜马拉雅剥露历史,发现晚更新世到早全新世,侵蚀速率较之于过去1.8 Ma增加了5~10倍,揭示了短时间尺度上气候变化对侵蚀速率的影响;King等[53]在东喜马拉雅Parlung江两岸采集了基岩样品,通过长石多种红外释光热年代方法揭示了过去百万年以来的剥露速率增加了一个数量级,高剥露速率区持续向北迁移,与构造活跃带的北迁相对应,否定了河流侵蚀和构造活动间存在正反馈而使得侵蚀中心固定不动的“构造动脉瘤”假说。由于强烈的构造活动和极高的降雨量,日本阿尔卑斯可能是世界上剥露速率最快的地区,以至于多数热年代体系无法积累可测信号,释光热年代学已被尝试用于该地区的Hida山脉,有望揭示高侵蚀速率中来自构造和降雨的贡献[32]。有趣的是,通过释光低温热年代学方法得到的万年至数十万年尺度上的冷却速率较之于其他热年代学方法得到的冷却速率通常高一个数量级[32]。事实上,通过前者约束的冷却速率对应的时间单位为“每千年”(ka-1),将其直接乘以103而转换为百万年(Ma)尺度的冷却速率可能并不恰当,而应直接报道以“每千年”为单位的冷却速率。
从方法学的角度,岩石样品部分石英颗粒含有长石包裹体、蓝光释光信号对辐照剂量响应不敏感和测量过程中灵敏度变化较大,使得石英释光信号并不适合用于岩浆岩、变质砂岩和高变质岩等类型样品的研究[58~60];而沉积岩和低变质岩类中的石英释光特性则使其有可能适用于热年代学研究[60]。石英蓝光释光信号饱和剂量较小,在相对较短(如100 ka)的时间尺度内信号即达到稳态而不再增加,因此仅能给出最大冷却速率[36, 60]。常规石英蓝光释光信号仅适用于冷却速率高于100 ℃/Ma,甚至是360 ℃/Ma的样品[30, 60]。由于石英热转移释光(TT-OSL)信号[60~61]和紫光释光(VSL)信号[60, 62~63]的饱和剂量可达1000 Gy以上,它们也被尝试用于热年代学研究,这些信号具有将石英释光热年代计的适用范围拓展至冷却速率介于101~102 ℃/Ma情形的潜力。基于多片再生剂量法的热释光(TL)信号[54]和单片再生剂量法的等温热释光(ITL)信号[54, 59, 64~65],除饱和剂量高于常规蓝光释光信号外,还可在一次测量中获得多种热稳定性不同的释光热年代计。红光波段(590~650 nm)在300 ℃以上的热释光信号,在环境温度高于53 ℃的条件下可被归零,饱和剂量可达6~10 kGy,在热年代研究中具有巨大潜力[66]。
与石英相比,长石红外释光信号由于对辐照剂量响应更敏感、饱和剂量更高,自然更适用于释光热年代学的研究[37, 42]。近年来,随着对长石发光模型理解的深入[40, 67~69],对长石释光信号异常衰减的进一步认识以及相应校正方法的发展[39, 41, 70~71],使得长石红外释光信号成为了目前释光热年代学研究的首选,并得到了应用[37, 42, 53]。然而,如何确定长石红外释光信号的陷阱深度和频率因子仍存在较大不确定性。目前,热作用导致的长石红外释光信号衰减可通过一般动力学模型[37, 60]和带尾模型[42, 72~73]进行描述。一般动力学模型是基于对测量数据的最优拟合,但物理意义并不明确,通过其计算得到热稳定性参数是否能够扩展至地质历史时期仍然存疑;而带尾模型的不确定性则在于带尾宽度难以直接测量,而其又直接影响释光信号热稳定性。目前,对带尾宽度的直接测量需在接近绝对零度的条件下进行,技术上存在较大困难[74~75]。对异常衰减的校正,是通过测量实验室放置不同时间后释光信号的衰减程度计算出信号衰减速率[76],再应用Kars等[41]的公式计算得到发光中心密度,然后据此计算地质历史时期的信号衰减。然而,实验数据表明长石红外释光信号的异常衰减速率随辐照剂量增加而增加[35, 77],对计算发光中心密度造成了不确定性,因此,对于异常衰减项的准确描述仍需进一步研究。
除通过上述测量饱和比例的方法进行矿物热历史分析外,还有多种应用释光信号研究矿物热历史的方法。如基于矿物热释光信号的峰形峰位[66],热释光信号半峰高对应的温度[78]及释光灵敏度的变化[79~80]。然而,这些方法目前仅局限于估算稳态下的样品温度,或是推测样品所经历的最高可能温度,在用于过去地表过程的研究时具有较大局限性。
总体而言,为使得释光低温热年代可用于较低冷却速率的区域,如 < 100 ℃/Ma,需寻找饱和剂量更大的释光信号;为使其能描述更丰富的地表过程,需寻找更多不同热稳定性的释光信号;而从减小热年代数据的不确定性出发,则需尽量选择发光模型明确的释光信号和可靠的计算热稳定性参数的方法。
4 释光低温热年代学方法面临的挑战对于释光热年代计,其封闭温度并不等同于释光信号开始积累时对应的温度。如图 1c所示,温度为80 ℃时,深度为1.71 eV陷阱的饱和比例已达0.1,该温度显著高于目前报道的石英释光信号封闭温度。同样,以起始冷却温度为100 ℃的情形为例,对于长石红外释光信号,在200 ℃/Ma冷却速率下计算得到的封闭温度约60 ℃,而此时相应释光信号饱和比例已达0.4;当冷却速率增加至400 ℃/Ma时,相应封闭温度约70 ℃,而此时对应的释光信号饱和比例达0.2[31]。因此,释光热年代计的封闭温度不可简单理解为释光信号开始积累时对应的温度,其原因需进一步研究。事实上,当前的热年代学研究中,封闭温度更多是从概念上辅助理解热年代学原理,帮助判断热年代计可能反映的地质或地表过程;在对冷却和剥露速率的实际反演中,更多使用是的数值方法,封闭温度并非必要条件。
随着释光测量仪器的发展,目前已可通过电子倍增电荷耦合器件(EMCCD)对岩石切片进行空间分辨的释光信号原位测量,获得岩石薄片不同部位矿物颗粒的释光信号饱和比例[81~83]。在剂量率测量方面,则可结合对岩片放射性元素浓度的原位测量和DosiVox程序[84]实现对岩片不同部位辐照剂量率的计算,实现原位释光低温热年代学研究。
目前,岩石样品的冷却历史可通过释光信号进行重建,但是,将冷却历史转变为剥露历史的研究仍然较少。图 1所示的一维剥露情形下,将释光信号饱和比例转化为剥露速率较为简单,但是,如图 2所示,地形及侵蚀剥露对地温场的影响更多是二维甚至是三维的。虽然对于其他热年代体系已能够在二、三维情形下重建剥露历史,但是基于释光热年代体系的相关研究仍然较少,亟需将二维和三维剥露情形下的岩石热运动模型与矿物释光发光模型和热衰减模型相结合,发展可利用多个样品的释光热年代数据反演区域剥露历史的二维甚至是三维模型。
5 结论低温热年代学方法可用于揭示地表侵蚀剥露过程以及地形起伏演变。传统的低温热年代学方法,如磷灰石U-Th/He,多适用于数千万年至数百万年尺度的侵蚀剥露过程,而对更短时间尺度的晚第四纪则并不适用。最新发展的释光低温热年代学方法,由于其封闭温度更低、适于晚第四纪测年、时间分辨率更高,为我们研究数十万年至数万年甚至万年尺度的地表侵蚀剥露速率及其时空分布和变化提供了一种新途径。通过近十年发展,用于约束晚第四纪地表剥露历史的释光低温热年代学方法已初步建立,目前已可通过测量单一样品多种热稳定性不同的释光信号饱和比例来约束岩石的冷却历史,并结合一维地壳热运动模型估算其剥露速率。由于释光信号的饱和特性,释光低温热年代学方法仅适用于冷却速率较高(> 100 ℃/Ma)的地区。从目前的多数应用实例看,通过释光低温热年代学方法揭示的万年至数十万年尺度冷却速率较其他低温热年代学方法揭示的数十万年至百万年尺度冷却速率高近一个数量级。从方法学的角度,寻找饱和剂量更高、热稳定性多样、测量程序简洁的释光信号是扩展释光低温热年代方法应用范围的重要突破方向。热释光发光曲线可能含有更加丰富的样品温度变化信息,需进一步挖掘其在热年代研究中的可能应用。对于目前应用最为广泛的长石红外释光信号,释光信号发光模型、热稳定性和信号异常衰减的计算方法仍需进一步改进和验证。测量仪器和数据分析软件的发展已使得原位释光低温热年代学研究成为可能。与此同时,亟需将释光发光模型与二维或三维地壳热运动模型结合,以真正实现应用释光低温热年代学方法重建晚第四纪地表演化过程,探讨其与构造变形和气候变化间的相互作用。
致谢: 感谢周力平教授鼓励进行释光低温热年代学研究的总结梳理和本文的写作;感谢审稿人对文章提出的建设性修改意见以及编辑部杨美芳老师的悉心编审。
| [1] |
Molnar P, England P. Late Cenozoic uplift of mountain ranges and global climate change:Chicken or egg?. Nature, 1990, 346(6279): 29-34. DOI:10.1038/346029a0 |
| [2] |
Zeitler P K, Koons P O, Bishop M L et al. Crustal reworking at Nanga Parbat, Pakistan:Evidence for erosional focusing of crustal strain. Tectonics, 2001, 20(5): 712-728. DOI:10.1029/2000TC001243 |
| [3] |
Pan B T, Burbank D, Wang Y X et al. A 900 k.y. record of strath terrace formation during glacial-interglacial transitions in Northwest China. Geology, 2003, 31(11): 957-960. DOI:10.1130/G19685.1 |
| [4] |
Whipple K X, Meade B J. Orogen response to changes in climatic and tectonic forcing. Earth and Planetary Science Letters, 2006, 243(1-2): 218-228. DOI:10.1016/j.epsl.2005.12.022 |
| [5] |
Zheng D W, Clark M K, Zhang P Z et al. Erosion, fault initiation and topographic growth of the North Qilian Shan(northern Tibetan Plateau). Geosphere, 2010, 6(6): 937-941. DOI:10.1130/GES00523.1 |
| [6] |
Whipple K X. The influence of climate on the tectonic evolution of mountain belts. Nature Geoscience, 2009, 2(2): 97-104. DOI:10.1038/ngeo413 |
| [7] |
刘静, 赵越. 构造地貌研究方法[M]//丁仲礼主编. 固体地球科学研究方法. 北京: 科学出版社, 2013: 952-953. Liu Jing, Zhao Yue. Methodology for tectonic geomorphology[M]//Ding Zhongli. Methodology for Solid Earth Science. Beijing: Science Press, 2013: 952-953. |
| [8] |
Zhang H, Zhang P, Champagnac J D et al. Pleistocene drainage reorganization driven by the isostatic response to deep incision into the northeastern Tibetan Plateau. Geology, 2014, 42(4): 303-306. DOI:10.1130/G35115.1 |
| [9] |
Yang R, Willett S D, Goren L. In situ low-relief landscape formation as a result of river network disruption. Nature, 2015, 520(7548): 526-529. DOI:10.1038/nature14354 |
| [10] |
Li Y L, Yang J C, Tan L H et al. Impact of tectonics on alluvial landforms in the Hexi Corridor, Northwest China. Geomorphology, 1999, 28(3-4): 299-308. DOI:10.1016/S0169-555X(98)00114-7 |
| [11] |
Zhang P Z, Molnar P, Downs W R. Increased sedimentation rates and grain sizes 2~4 Myr ago due to the influence of climate change on erosion rates. Nature, 2001, 410(6831): 891-897. DOI:10.1038/35073504 |
| [12] |
Chen J, Burbank D W, Scharer K M. Magnetochronology of the Upper Cenozoic strata in the southwestern Chinese Tian Shan:Rates of Pleistocene folding and thrusting. Earth and Planetary Science Letters, 2002, 195(1-2): 113-130. DOI:10.1016/S0012-821X(01)00579-9 |
| [13] |
Sun J M, Zhu R X, An Z S. Tectonic uplift in the northern Tibetan Plateau since 13.7 Ma ago inferred from molasse deposits along the Altyn Tagh Fault. Earth and Planetary Science Letters, 2005, 235(3-4): 641-653. DOI:10.1016/j.epsl.2005.04.034 |
| [14] |
孙继敏, 朱日祥. 天山北麓晚新生代沉积及其新构造与古环境指示意义. 第四纪研究, 2006, 26(1): 14-19. Sun Jimin, Zhu Rixiang. Cenozoic deposits in the northern Tianshan Mountains and its implications for neo tectonics and environmental changes. Quaternary Sciences, 2006, 26(1): 14-19. |
| [15] |
Lu H H, Burbank D W, Li Y L et al. Late Cenozoic structural and stratigraphic evolution of the northern Chinese Tian Shan foreland. Basin Research, 2010, 22(3): 249-269. DOI:10.1111/bre.2010.22.issue-3 |
| [16] |
方小敏. 山前挠曲盆地沉积相变化对地层对比和气候变化记录的关键控制:模型与应用——以临夏盆地为例. 第四纪研究, 2018, 38(1): 1-14. Fang Xiaomin. Crucial control of sedimentary facies changes of intracontinental flexural(foreland) basin on stratigraphic correlation and climatic records:Model and application-A case from the Linxia Basin. Quaternary Sciences, 2018, 38(1): 1-14. |
| [17] |
Willenbring J K, von Blanckenburg F. Long-term stability of global erosion rates and weathering during Late Cenozoic cooling. Nature, 2010, 465(7295): 211-214. DOI:10.1038/nature09044 |
| [18] |
Willenbring J K, Jerolmack D J. The null hypothesis:Globally steady rates of erosion, weathering fluxes and shelf sediment accumulation during Late Cenozoic mountain uplift and glaciation. Terra Nova, 2016, 28(1): 11-18. DOI:10.1111/ter.12185 |
| [19] |
Wang W, Godard V, Liu-Zeng J et al. Perturbation of fluvial sediment fluxes following the 2008 Wenchuan earthquake. Earth Surface Processes and Landforms, 2017, 42(15): 2611-2622. DOI:10.1002/esp.v42.15 |
| [20] |
Herman F, Seward D, Valla P G et al. Worldwide acceleration of mountain erosion under a cooling climate. Nature, 2013, 504(7480): 423-426. DOI:10.1038/nature12877 |
| [21] |
Herman F, Champagnac J D. Plio-Pleistocene increase of erosion rates in mountain belts in response to climate change. Terra Nova, 2016, 28(1): 2-10. DOI:10.1111/ter.12186 |
| [22] |
Mancktelow N S, Grasemann B. Time-dependent effects of heat advection and topography on cooling histories during erosion. Tectonophysics, 1997, 270(3-4): 167-195. DOI:10.1016/S0040-1951(96)00279-X |
| [23] |
Braun J. Quantifying the effect of recent relief changes on age-elevation relationships. Earth and Planetary Science Letters, 2002, 200(3): 331-343. |
| [24] |
Braun J, Van der Beek P, Batt G. Quantitative Thermochronology:Numerical Methods for the Interpretation of Thermochronological Data. Cambridge: Cambridge University Press, 2006: 19-130.
|
| [25] |
Ehlers T A. Crustal thermal processes and the interpretation of thermochronometer data. Reviews in Mineralogy and Geochemistry, 2005, 58: 315-350. DOI:10.2138/rmg.2005.58.12 |
| [26] |
Reiners P W, Brandon M T. Using thermochronology to understand orogenic erosion. Annual Review of Earth and Planetary Sciences, 2006, 34: 419-466. DOI:10.1146/annurev.earth.34.031405.125202 |
| [27] |
郑德文, 武颖, 庞建章等. U-Th/He热年代学原理、测试及应用. 第四纪研究, 2016, 36(5): 1027-1036. Zheng Dewen, Wu Ying, Pang Jianzhang et al. Fundamentals, dating and application of U-Th/He thermochronology. Quaternary Sciences, 2016, 36(5): 1027-1036. |
| [28] |
Herman F, Rhodes E J, Braun J et al. Uniform erosion rates and relief amplitude during glacial cycles in the southern Alps of New Zealand, as revealed from OSL-thermochronology. Earth and Planetary Science Letters, 2010, 297(1-2): 183-189. DOI:10.1016/j.epsl.2010.06.019 |
| [29] |
Guralnik B, Jain M, Herman F et al. Effective closure temperature in leaky and/or saturating thermochronometers. Earth and Planetary Science Letters, 2013, 384: 209-218. DOI:10.1016/j.epsl.2013.10.003 |
| [30] |
Wu T S, Jain M, Guralnik B et al. Luminescence characteristics of quartz from Hsuehshan range(Central Taiwan) and implications for thermochronometry. Radiation Measurements, 2015, 81: 104-109. DOI:10.1016/j.radmeas.2015.03.002 |
| [31] |
King G E, Guralnik B, Valla P G et al. Trapped-charge thermochronometry and thermometry:A status review. Chemical Geology, 2016, 446: 3-17. DOI:10.1016/j.chemgeo.2016.08.023 |
| [32] |
Herman F, King G E. Luminescence thermochronometry:Investigating the link between mountain erosion, tectonics and climate. Elements, 2018, 14: 33-38. DOI:10.2138/gselements.14.1.33 |
| [33] |
Aitken M J. Thermoluminescence Dating. London: Academic Press, 1985: 41-60.
|
| [34] |
Aitken M J. An Introduction to Optical Dating. Oxford: Oxford Science Publications, 1998: 6-36.
|
| [35] |
Huntley D J, Lian O B. Some observations on tunnelling of trapped electrons in feldspars and their implications for optical dating. Quaternary Science Reviews, 2006, 25(19-20): 2503-2512. DOI:10.1016/j.quascirev.2005.05.011 |
| [36] |
Li B, Li S H. Determining the cooling age using luminescence thermochronology. Tectonophysics, 2012, 580: 242-248. DOI:10.1016/j.tecto.2012.09.023 |
| [37] |
Guralnik B, Jain M, Herman F et al. OSL-thermochronology of feldspar from the KTB borehole, Germany. Earth and Planetary Science Letters, 2015, 423: 232-243. DOI:10.1016/j.epsl.2015.04.032 |
| [38] |
Guralnik B, Li B, Jain M et al. Radiation-induced growth and isothermal decay of infrared-stimulated luminescence from feldspar. Radiation Measurements, 2015, 81: 224-231. DOI:10.1016/j.radmeas.2015.02.011 |
| [39] |
Wintle A G. Anomalous fading of thermoluminescence in mineral samples. Nature, 1973, 245: 143-144. DOI:10.1038/245143a0 |
| [40] |
Huntley D J. An explanation of the power-law decay of luminescence. Journal of Physics-Condensed Matter, 2006, 18(4): 1359-1365. DOI:10.1088/0953-8984/18/4/020 |
| [41] |
Kars R H, Wallinga J, Cohen K M. A new approach towards anomalous fading correction for feldspar IRSL dating-Tests on samples in field saturation. Radiation Measurements, 2008, 43(2-6): 786-790. DOI:10.1016/j.radmeas.2008.01.021 |
| [42] |
King G E, Herman F, Lambert R et al. Multi-OSL thermochronometry of feldspar. Quaternary Geochronology, 2016, 33: 76-87. DOI:10.1016/j.quageo.2016.01.004 |
| [43] |
Wintle A G, Murray A S. A review of quartz optically stimulated luminescence characteristics and their relevance in single-aliquot regeneration dating protocols. Radiation Measurements, 2006, 41(4): 369-391. DOI:10.1016/j.radmeas.2005.11.001 |
| [44] |
Simpson G. Practical Finite Element Modeling in Earth Science Using Matlab. London: Wiley Blackwell, 2017: 122-126.
|
| [45] |
Dodson M. Closure temperature in cooling geochronological and petrological systems. Contributions to Mineralogy and Petrology, 1973, 40(3): 259-274. DOI:10.1007/BF00373790 |
| [46] |
Braun J, van der Beek P, Valla P et al. Quantifying rates of landscape evolution and tectonic processes by thermochronology and numerical modeling of crustal heat transport using PECUBE. Tectonophysics, 2012, 524-525: 1-28. DOI:10.1016/j.tecto.2011.12.035 |
| [47] |
Herman F, Braun J, Senden T J et al. (U-Th)/He thermochronometry:Mapping 3D geometry using micro-X-ray tomography and solving the associated production-diffusion equation. Chemical Geology, 2007, 242(1-2): 126-136. DOI:10.1016/j.chemgeo.2007.03.009 |
| [48] |
Bailey R M. Towards a general kinetic model for optically and thermally stimulated luminescence of quartz. Radiation Measurements, 2001, 33(1): 17-45. DOI:10.1016/S1350-4487(00)00100-1 |
| [49] |
Buylaert J P, Murray A S, Thomsen K J et al. Testing the potential of an elevated temperature IRSL signal from K-feldspar. Radiation Measurements, 2009, 44(5-6): 560-565. DOI:10.1016/j.radmeas.2009.02.007 |
| [50] |
Li B, Li S H. Luminescence dating of K-feldspar from sediments:A protocol without anomalous fading correction. Quaternary Geochronology, 2011, 6(5): 468-479. DOI:10.1016/j.quageo.2011.05.001 |
| [51] |
Thomsen K J, Murray A S, Jain M. Stability of IRSL signals from sedimentary K-feldspar samples. Geochronometria, 2011, 38(1): 1-13. DOI:10.2478/s13386-011-0003-z |
| [52] |
Qin J, Chen J, Valla P G et al. Estimating rock cooling rates by using multiple luminescence thermochronometers. Radiation Measurements, 2015, 81: 13-18. |
| [53] |
King G E, Herman F, Guralnik B. Northward migration of the Himalayan syntaxis revealed by OSL thermochronometry. Science, 2016, 353(6301): 800-804. DOI:10.1126/science.aaf2637 |
| [54] |
Tang S L, Li S H. Low temperature thermochronology using thermoluminescence signals from quartz. Radiation Measurements, 2015, 81: 92-97. DOI:10.1016/j.radmeas.2015.04.011 |
| [55] |
Tang S L, Li S H. Low temperature thermochronology using thermoluminescence signals from K-feldspar. Geochronometria, 2017, 44: 112-120. |
| [56] |
Biswas R H, Herman F, King G E. Thermoluminescence as a multi-thermochronometer[C]//Abstracts of 15th International Conference on Luminescence and Electron Spin Resonance Dating. Cape Town, South Africa, 2017: 30.
|
| [57] |
De Sarkar S, Mathew G, Pande K et al. Rapid denudation of higher Himalaya during Late Pleistocene, evidence from OSL thermochronology. Geochronometria, 2013, 40(4): 304-310. |
| [58] |
Preusser F, Chithambo M L, Götte T et al. Quartz as a natural luminescence dosimeter. Earth-Science Reviews, 2009, 97(1-4): 184-214. DOI:10.1016/j.earscirev.2009.09.006 |
| [59] |
Wu T S, Kunz A, Jaiswal M K et al. A feasibility study on the application of luminescence dating for quartz from different rock types as a thermochronometer. Quaternary Geochronology, 2012, 10: 340-344. DOI:10.1016/j.quageo.2012.04.009 |
| [60] |
Guralnik B, Ankjærgaard C, Jain M et al. OSL-thermochronometry using bedrock quartz:A note of caution. Quaternary Geochronology, 2015, 25: 37-48. DOI:10.1016/j.quageo.2014.09.001 |
| [61] |
Wang X L, Wintle A G, Lu Y C. Thermally transferred luminescence in fine grained quartz from Chinese loess:Basic observations. Radiation Measurements, 2006, 41(6): 649-658. DOI:10.1016/j.radmeas.2006.01.001 |
| [62] |
Jain M. Extending the dose range:Probing deep traps in quartz with 3.06 eV photons. Radiation Measurements, 2009, 44(5-6): 445-452. DOI:10.1016/j.radmeas.2009.03.011 |
| [63] |
Ankjærgaard C, Guralnik B, Porat N et al. Violet stimulated luminescence:Geo-or thermochronometer?. Radiation Measurements, 2015, 81: 78-84. DOI:10.1016/j.radmeas.2015.01.011 |
| [64] |
龚革联, 蔡观强, 刘顺生等. 利用石英375℃热释光峰研究其受热历史的模拟实验. 地球化学, 2007, 36(6): 633-637. Gong Gelian, Cai Guanqiang, Liu Shunsheng et al. Simulation study on isothermal activation method for tracing thermal history of quartz using 375℃ thermoluminescence peak. Geochimica, 2007, 36(6): 633-637. |
| [65] |
Gong G L, Li S H, Sun W D et al. Quartz thermoluminescence-Another potential paleo-thermometer for studies of sedimentary basin thermal history. Chinese Journal of Geophysics, 2010, 53(1): 103-112. DOI:10.1002/cjg2.v53.1 |
| [66] |
Schmidt C, Friedrich J, Zöller L et al. Thermochronometry using red TL of quartz?-Numerical simulation and observations from in-situ drill-hole samples. Radiation Measurements, 2015, 81: 98-103. DOI:10.1016/j.radmeas.2015.04.004 |
| [67] |
Jain M, Ankjærgaard C. Towards a non-fading signal in feldspar:Insight into charge transport and tunnelling from time-resolved optically stimulated luminescence. Radiation Measurements, 2011, 46(3): 292-309. DOI:10.1016/j.radmeas.2010.12.004 |
| [68] |
Jain M, Guralnik B, Andersen M T. Stimulated luminescence emission from localized recombination in randomly distributed defects. Journal of Physics-Condensed Matter, 2012, 24(38): 385402. DOI:10.1088/0953-8984/24/38/385402 |
| [69] |
Jain M, Sohbati R, Guralnik B et al. Kinetics of infrared stimulated luminescence from feldspars. Radiation Measurements, 2015, 81: 242-250. DOI:10.1016/j.radmeas.2015.02.006 |
| [70] |
Auclair M, Lamothe M, Huot S. Measurement of anomalous fading for feldspar IRSL using SAR. Radiation Measurements, 2003, 37(4-5): 487-492. DOI:10.1016/S1350-4487(03)00018-0 |
| [71] |
Valla P G, Lowick S E, Herman F et al. Exploring IRSL 50 fading variability in bedrock feldspars and implications for OSL thermochronometry. Quaternary Geochronology, 2016, 36: 55-66. DOI:10.1016/j.quageo.2016.08.004 |
| [72] |
Li B, Li S H. The effect of band-tail states on the thermal stability of the infrared stimulated luminescence from K-feldspar. Journal of Luminescence, 2013, 136: 5-10. DOI:10.1016/j.jlumin.2012.08.043 |
| [73] |
Poolton N R J, Kars R H, Wallinga J et al. Direct evidence for the participation of band-tails and excited-state tunnelling in the luminescence of irradiated feldspars. Journal of Physics-Condensed Matter, 2009, 21(48): 485505. DOI:10.1088/0953-8984/21/48/485505 |
| [74] |
Prasad A K, Lapp T, Kook M et al. Probing luminescence centres in Na rich feldspar. Radiation Measurements, 2016, 90: 292-297. DOI:10.1016/j.radmeas.2016.02.033 |
| [75] |
Riedesel S, King G E, Kumar R et al. Constraining the band-tail width of feldspar: Implications for luminescence thermochronometry[C]//Abstracts of 15th International Conference on Luminescence and Electron Spin Resonance Dating. Cape Town, South Africa, 2017: 177.
|
| [76] |
Huntley D J, Lamothe M. Ubiquity of anomalous fading in K-feldspars and the measurement and correction for it in optical dating. Canadian Journal of Earth Science, 2001, 38(7): 1093-1106. DOI:10.1139/e01-013 |
| [77] |
Li B, Li S H. Investigations of the dose-dependent anomalous fading rate of feldspar from sediments. Journal of Physics D-Applied Physics, 2008, 41(22): 225502. DOI:10.1088/0022-3727/41/22/225502 |
| [78] |
Brown N D, Rhodes E J, Harrison M T. Using thermoluminescence signals from feldspars for low-temperature thermochronology. Quaternary Geochronology, 2017, 42: 31-41. DOI:10.1016/j.quageo.2017.07.006 |
| [79] |
Sawakuchi A O, Blair M W, DeWitt R et al. Thermal history versus sedimentary history:OSL sensitivity of quartz grains extracted from rocks and sediments. Quaternary Geochronology, 2011, 6(2): 261-272. DOI:10.1016/j.quageo.2010.11.002 |
| [80] |
Liu Z, Zhao H, Wang C M et al. Estimation of paleo-firing temperatures using luminescence signals for the volcanic lava baked layer in Datong, China. Quaternary Geochronology, 2015, 30B: 363-368. |
| [81] |
Chauhan N, Adhyaru P, Vaghela H et al. EMCCD based luminescence imaging system for spatially resolved geo-chronometric and radiation dosimetric applications. Journal of Instrumentation, 2014, 9: 11016. |
| [82] |
Duller G A T, Kook M, Stirling R et al. Spatially-resolved ther-moluminescence from snail opercula using an EMCCD. Radiation Measurements, 2015, 81: 157-162. DOI:10.1016/j.radmeas.2015.01.014 |
| [83] |
Lapp T, Kook M, Murray A S et al. A new luminescence detection and stimulation head for the Risø TL/OSL reader. Radiation Measurements, 2015, 81: 178-184. DOI:10.1016/j.radmeas.2015.02.001 |
| [84] |
Martin L, Mercier N, Incerti S et al. Dosimetric study of sediments at the beta dose rate scale:Characterization and modelization with the DosiVox software. Radiation Measurements, 2015, 81: 134-141. DOI:10.1016/j.radmeas.2015.02.008 |
Abstract
The accumulation of luminescence signal of mineral is governed by the received radiation and the ambient temperature through time; therefore, the luminescence signal could serve as a kind of thermo-chronometer. The low-temperature luminescence thermochronology(LtLT) is characterized by its low closure temperature and high temporal resolution. It is one of the most direct ways to explore the interactions between the structural deformation and the Earth surface processes, such as erosion and relief change, during the Late Quaternary. In this review, we started by introducing the basic principles for the production of mineral luminescence signal and the evolution of geothermal field. A one-dimension scenario with steady surface erosion and a two-dimension scenario with topographic relief were employed to demonstrate how the geothermal field and various luminescence signals of minerals at depths of the crust responded to the surface processes, such as erosion and relief change. We briefly outlined the established procedure for using the saturation ratios of multiple-luminescence-thermo-chronometer to constrain the rock cooling history. Subsequently, we elaborated the features of the LtLT method from the perspectives of its low closure temperature, high sensitivity to very recent exhumation and high versatility to offer a spectrum of thermo-chronometers with different closure temperatures, and were aiming to stimulate more considerations on how to make the best use of LtLT method to explore various aspects of the Earth surface processes. Then, we showed several case studies, in which the LtLT method was applied to typical sites with high exhumation rates over the world to derive the spatial and temporal changes of erosion rate during the Late Quaternary, which could not be achieved by using other low temperature thermochronology methods. With the brief summary of the progress in application and methodological development, technical challenges for using the LtLT method to reconstruct the surface erosion and relief changes were discussed, which include (1) clarifying the concept of "closure temperature" for the LtLT method, (2) developing the in situ LtLT technique with consideration of the luminescence and dose rate variability across the rock samples, and (3) coupling the luminescence production model with the two-dimension or three-dimension thermo-mechanical model of the crust to retrieve the Earth surface processes during the Late Quaternary.