 2017, Vol.37


② 南京信息工程大学气象灾害预报预警 与评估协同创新中心, 南京 210044;
③ 成都信息工程大学气候与环境变化联合实验室, 成都 610225;
④ 中国科学院青藏高原研究所, 北京 100101;
⑤ 国家气候中心, 北京 100081;
⑥ 中国科学院大学, 北京 100049;
⑦ 中国科学院西北生态环境资源研究院/青藏高原冰冻圈观测研究站, 兰州 730000)
多年冻土约占北半球陆地面积的1/4。全球多年冻土中储存着约18300×108吨的土壤有机碳,相当于大气中二氧化碳含量(8280×108吨)的2.2倍[1~2]。北半球多年冻土中还存储着约11370×109~36550×109m3的地下冰,相当于全球海平面升高3~10cm的水含量[3]。此外,表层冻土的季节性冻融过程与地表生态、水文及能量收支有着紧密的联系[4~9]。冻土消融会导致土壤有机碳释放、地下冰消融以及冻土季节性冻融规律的改变,进而对气候、水文与水资源、冻土工程稳定性以及地表生态环境产生重要影响[4, 10]。因此,在当前气候变暖以及将来气候可能进一步变暖的背景下[11~14],冻土消融及其影响成为气候变化研究领域的热点问题。
青藏高原上广泛分布着多年冻土和季节冻土。多年冻土约1.06×10⁶km2,季节冻土约1.46×10⁶km2[15]。由于青藏高原位于北半球中低纬度,因此其多年冻土属性较暖,对气候变化尤为敏感;研究表明气候变暖引起的青藏高原多年冻土消融速度是高纬度多年冻土的1.4倍[16]。此外,作为“亚洲水塔”,青藏高原是东南亚一些主要河流的源头。被誉为“天路”的青藏铁路的约50 %路段位于多年冻土之上。多年冻土退化会对亚洲水资源供应、青藏铁路的稳定性等产生重要影响[17]。因此,开展青藏高原冻土变化及其影响研究尤为重要。
作为冻土研究中最为关键的参量,土壤温度对冻土变化具有重要指示作用,已经引起了越来越多的关注。例如,国际上启动的“国际极地年计划”就旨在调查多年冻土的土壤温度状况[18]。基于野外钻孔观测资料,青藏高原土壤温度的日、月和年际变化(1996~2006年)特征已经得以研究[19~21];基于气象站观测资料,土壤温度研究的时间尺度被拓展到了年代际尺度(1960~2005年)[22, 23]。但由于青藏高原观测站点稀少,基于观测的研究在区域代表性上受到了限制。于是学者们开始尝试评估和利用卫星遥感和再分析资料研究青藏高原土壤温度,突破区域限制[24~26]。然而,再分析资料主要开始于1979年,并且土壤深度基本在3.5m以内,难以研究更长时间和更深层的土壤温度变化。值得庆幸的是,随着模式和计算能力的不断改进和发展,数值模拟方法已经能够弥补这些不足。
本研究利用最新版本的通用陆面模式(CLM4.5) 对过去百年青藏高原0~35m土壤温度变化进行了研究,旨在从长时间和大空间尺度上揭示青藏高原土壤温度的演化规律,为青藏高原冻土及陆地生态系统变化研究提供依据。
2 数据、模式、试验设计和方法 2.1 数据本文所用的大气强迫场为模式自带的CRUNCEP资料[27],包括气温、降水、气压、风速、比湿和辐射变量。空间分辨率为0.5°,时间分辨率为6小时。资料时期为1901~2010年,覆盖了全球范围。CRUNCEP资料融合了CRU(Climate Research Unit,0.5°×0.5°)观测资料[28]和NCEP(National Centers for Environmental Prediction,2.5°×2.5°)再分析资料[29]。对与冻土模拟相关较紧密的气温、降水和辐射变量,CRUNCEP资料在发展过程中利用月平均CRU观测资料对NCEP资料进行了校正,保证了这些变量在月尺度上的准确性。当前CRUNCEP资料有5个版本,本文用的是第4个版本,这套资料已经被用于驱动通用陆面模式进行植被生长和蒸散发等研究[30, 31]。
土壤温度再分析资料ERA-Interim(European Centre for Medium-Range Weather Forecasts Re-Analysis Interim)[32]和CFSR(National Oceanic and Atmospheric Administration Climate Forecast System Reanalysis)[33]用于与模拟结果进行对比。ERA-Interim资料的空间分辨率为0.75°,CFSR的空间分辨率为0.5°,它们的时期均为1979~2016年。这两套再分析资料没有直接提供对比深度(0.2m)的土壤温度,本文中通过线性插值方法获得。我们之所以用这两套再分析资料是因为它们已被证实在青藏高原上相比其他再分析资料具有更高的精度[25, 26, 34]。我们将模拟结果与它们进行对比来说明模拟结果相比再分析资料的优劣。
气象站观测的土壤温度资料用于验证模拟结果。这套资料观测了8层土壤的土壤温度,深度分别为0.05m、0.1m、0.15m、0.2m、0.4m、0.8m、1.6m和3.2m,其中0.4m及以上的浅层观测资料具有较长观测时期,从20世纪60、70年代开始观测,数据较为连续;0.4m以下土壤资料基本从2004年开始才有观测数据。考虑到利用尽可能长序列的观测资料进行验证模式,我们仅采用了位于冻土活动层之内的0.2m深处土壤观测资料。综合观测时期和数据缺测等因素,我们在青藏高原选取了20个气象站点,其分布如图 1所示,坐标信息如表 1所示。验证时,先将所有站点的观测资料和与其对应模拟格点的模拟资料做平均,然后将二者进行对比。

|
图 1 研究区域(25°~40.5°N,75°~105°E)和观测站点分布图 圆形代表气象站站点,五角星代表野外钻孔监测站点 Fig. 1 Distribution of study area(25°~40.5°N, 75°~105°E) and observation sites. Circles represent meteorological stations and five-pointed stars represent field borehole monitoring sites |
| 表 1 气象站站点和野外钻孔监测站点的信息 Table 1 Information of meteorological stations and field borehole monitoring sites |
野外钻孔观测资料用于验证深层(1m和6m)土壤温度模拟结果。考虑选取具有较长观测时期(10年以上)的站点和数据的可获得性,收集了4个站(FH1、WD2、CM2和Wuli)的观测资料,其分布如图 1所示,坐标信息如表 1所示。数据的观测时期为1996~2010年,部分站的资料要短于该时期。这些数据主要来自文献[20, 35]。有关观测资料的观测方法、后处理等详细信息可见相关文献[20, 35]。
2.2 模式本研究利用了最新版本的通用陆面模式CLM4.5(Community Land Model,version 4.5)。模式明确考虑了冻土冻融过程,包含了一个冰点降低方程[36],允许液态水和冰在温度低于0℃时可以共存,增强了水的下渗能力。模式还考虑了土壤有机物的水热属性,减小了模拟结果的暖偏差[37]。此外,土壤层被拓展到了15层、约50m深,克服了深层多年冻土的热绝缘问题[37]。这些改进使得CLM4.5成为当前较为成熟的模拟冻土的模式之一[38]。需要输入的大气强迫资料包括气温、降水、气压、风速、比湿和向下短波辐射,时间分辨率为6小时。CLM模式目前已经广泛用于冻土及陆面模拟研究[38~41]。
2.3 试验设计利用CRUNCEP资料驱动CLM4.5模式进行了模拟试验。植被和土壤质地使用了模式自带的数据集。植被由中等分辨率成像分光辐射计(MODIS)产品反演获得[42]。土壤质地基于国际岩石圈—生物圈计划(IGBP)土壤数据集发展而成[43]。模拟输出的时间分辨率为每天,模拟的空间分辨率为0.5°。模拟区域为全球范围,本文选取青藏高原区域的土壤温度模拟数据进行分析。模式的初始化过程为利用1979年的大气数据驱动CLM4.5循环模拟了100年,再用1901年的大气数据驱动CLM4.5继续循环模拟了5年。在初始化过程结束期,所有层区域平均土壤温度的年际变化都低于0.003℃。将此时的模式状态做初始场,开展瞬时模拟,模拟时期为1901~2010年。
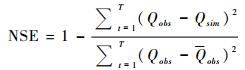
2.4 方法纳什效率系数(Nash-Sutcliffe Efficiency, 简称NSE)和相关系数用于评估模拟结果与观测值的吻合程度。NSE由Nash和Sutcliffe[44]提出,计算如下:
|
(1) |
公式(1) 中Qobs代表观测值,Qsim代表模拟值,Qobs代表观测值的平均,T为总样本数。NSE表示模拟和观测值接近1︰1线的程度,其对极值敏感。纳什效率系数的范围为-∞到1,1表示观测和模拟值完全相同。系数越接近1,表明观测和模拟值越接近;系数接近0,表示模拟值接近观测值的平均水平,总体结果可信;系数远小于0,则模拟结果不可信。
模式验证时,首先利用最邻近插值方法将模拟结果插值到观测站点上,然后再与站点观测值进行对比。土壤温度增温趋势采用普通的最小二乘法和线性拟合方法计算获得。变化趋势的显著性利用t检验方法。
3 结果 3.1 模拟结果验证模式模拟出了观测的0.2m土壤温度年际变化和趋势,模拟效果比再分析资料合理(图 2)。模拟和观测结果的相关系数为0.92,NSE为0.82。它们的线性趋势十分接近,分别为0.27℃/10年和0.28℃/10年。与再分析资料的相比,不论是相关系数、NSE、还是趋势,模拟结果都要明显优于两套再分析资料(表 2)。这一结果表明这套模拟资料具有相对再分析资料更高的精度,意味着它们在将来可以用于与土壤温度相关科学问题的研究。

|
图 2 1972~2005年0.2m土壤温度变化(相对1981~2000年)模拟结果和再分析资料与观测值的对比 CC代表相关系数,“*”代表相关系数通过95 %显著性水平,NSE代表纳什效率系数,趋势的单位为℃/10年 Fig. 2 Comparison of changes in simulated and reanalysis soil temperature at a depth of 0.2m to observations during the period 1972~2005 relative to 1981~2000. CC represents correlation coefficient, "*" represents the correlation coefficient exceeding 95 % significance level, and NSE represents the Nash-Sutcliffe efficiency |
| 表 2 1979~2005年0.2m土壤温度本文模拟结果、ERA-Interim和CFSR资料与观测值对比的统计 Table 2 Statistics of comparison of simulations, ERA-Interim and CFSR data to observed soil temperature at a depth of 0.2m during the period 1979~2005 |
模拟的深层(1m和6m)土壤温度变化也表现合理(图 3)。基于钻孔观测资料的验证显示,模拟结果较好地再现了观测的变化,深层较浅层更好。相关系数在0.52~0.94之间,NSE在-0.57~0.88之间。相对FH1、WD2和Wuli站,CM2站的模拟效果较差。由于这种对比是模拟格点平均值与单个站点观测值之间的对比,因此存在尺度不匹配问题。加之青藏高原地形复杂,使得尺度不匹配问题更为突出,这可能放大了某些地区模拟结果的偏差。这一原因和图 3显示的模拟性能证明了模拟结果的合理性。

|
图 3 1981~2010年1m(a,c,e,g)和6m(b,d,f)土壤温度变化(相对各站点的观测时期)模拟结果与各站点观测时期观测值的对比 CC代表相关系数,“*”代表相关系数通过95 %显著性水平,NSE代表纳什效率系数,趋势的单位为℃/10年 Fig. 3 Comparison of simulated change in soil temperature at a depth of 1m(a, c, e, g)and 6m(b, d, f)to observations during the period 1981~2010 relative to observation period of each site. CC represents correlation coefficient, "*" represents the correlation coefficient exceeding 95 % significance level, and NSE represents the Nash-Sutcliffe efficiency |
整个青藏高原1m深度土壤温度都显著增加,西北部增温高于东南部,冬季增温高于夏季(图 4)。从空间分布上看,整个青藏高原土壤温度都显示为增加趋势,增温最高的区域在高原西北角,增温最低区域在高原东南部(图 4a)。从区域平均线性变化来看,总体上1901~2010年青藏高原土壤温度呈增加趋势,增加率为0.08℃/10年。1979~2010年土壤温度快速增加,增加率为0.38℃/10年。可以看出,土壤温度在20世纪40年代出现过一次明显增加,这与观测的全球气温变化相一致[11]。从季节来看,冬季增温高于夏季,1901~2010(1979~2010) 年冬季和夏季的增温率分别为0.10(0.41)℃/10年和0.08(0.36)℃/10年。

|
图 4 1901~2010年年平均(a,b)、夏季(c,d)和冬季(e,f)1m土壤温度的趋势(℃/10年)分布(a,c,e)和区域平均线性变化(相对1981~2000年)(b,d,f) “+”代表趋势通过95 %的显著性检验,“*”代表相关系数通过95 %显著性水平 Fig. 4 Distribution(a, c, e)of trend(℃/decade) in soil temperature at a depth of 1m during the period 1901~2010 and the related area-average linear change(b, d, f)relative to 1981~2000 for annual(a, b), summer(c, d)and winter(e, f). "+" represents the trend exceeding 95 % significance level, and "*" represents the correlation coefficient exceeding 95 % significance level |
15m深度土壤温度增加的时空特征与1m深度相似,但增加率相对较低,季节变化不明显(图 5)。年平均地温指地下土壤温度季节变化幅度为0的深度的土壤温度,它能很好的指示多年冻土对长期气候变化的响应。这一温度在青藏高原上一般指10~15m深度的温度[20]。因此,我们分析了15m土壤温度变化。可以看到,15m土壤温度的增加模态与1m的相似,都为西北部高于东南部,1979~2010年增温更快。不同的是15m土壤温度的增加率低于1m深度。1901~2010(1979~2010) 年15m土壤温度的增加率为0.05(0.27)℃/10年,无季节差别。

|
图 5 1901~2010年年平均(a,b)、夏季(c,d)和冬季(e,f)15m土壤温度的变化趋势(℃/10年)分布(a,c,e)和区域平均线性变化(相对1981~2000年)(b,d,f) “+”代表通过趋势95 %的显著性检验,“*”代表相关系数通过95 %显著性水平 Fig. 5 Same as Fig. 4, but for soil temperature at a depth of 15m |

|
图 6 青藏高原经向(a)和纬向(b)平均的1901~2010年土壤温度变化趋势(℃/10年)分布 深度中的“-”号代表向下,所有趋势都通过了95 %的显著性检验 Fig. 6 Distribution of trend in soil temperature(℃/decade)during the period 1901~2010 for meridional (a) and latitudinal (b) mean over the Tibetan Plateau. "-" in the value of depth represents underground. Trends for all grids exceeding 95 % significance level |
青藏高原土壤温度变化具有明显的深度、经度和纬度依赖性(图 6)。随着深度从0增加到35m,土壤增温逐渐减弱。这可能与深层多年冻土消融吸热,抑制增温有关。随着经度增加,土壤增温逐渐减弱(图 6a)。随着纬度增加,土壤增温的规律是:先增加,而后略减小(图 6b)。

|
图 7 1901~2010年整个青藏高原地区(a,d)、多年冻土区(b,e)和季节冻土区(c,f)1m(a,b,c)和15m(d,e,f)土壤温度与气温变化(相对1981~2000年)的关系 敏感性指土壤温度对气温变化的敏感性,以子图(a)为例,气温增加1℃,对应土壤温度增加0.79℃ Fig. 7 Relationship between soil temperature and air temperature changes at depths of 1m(a, b, c) and 15m(d, e, f)over entire Tibetan Plateau(a, d), permafrost(b, e), and seasonally frozen ground(c, f)regions during the period 1901~2010 relative to 1981~2000 |
1m深度土壤温度与气温的相关关系明显好于15m深度(图 7)。1m深度土壤温度对气温变化的敏感性为0.79℃/℃(即气温增加1℃,1m深度土壤温度增加0.79℃),明显高于15m深度的0.37℃/℃(图 7),这表明浅层土壤温度受气候变化影响比深层更大。就多年冻土和季节冻土区分开来看,多年冻土区1m(15m)土壤温度增加率为0.08(0.07)℃/10年,高于季节冻土区的0.06(0.05)℃/10年(图略)。这里的多年冻土和季节冻土区的划分根据青藏高原冻土图[45]。对气温变化的敏感性,多年冻土区也高于季节冻土区(图 7),1m深度多年冻土温度对气温变化的敏感性为0.80℃/℃,季节冻土温度为0.78℃/℃,这表明多年冻土热状况对气温变化较季节冻土更为敏感。
4 结论与讨论本研究基于最新版本的通用陆面模式CLM4.5对过去百年青藏高原土壤温度演化进行了模拟研究,得到如下结果:
(1) 利用CRUNCEP驱动CLM4.5能合理地模拟出观测的青藏高原土壤温度的年际变化(相关系数为0.92,纳什效率系数为0.82) 和线性趋势(模拟和观测的趋势分别为0.27℃/10年和0.28℃/10年),其结果要明显优于再分析资料。
(2)1901~2010年青藏高原1m和15m土壤温度增加率分别为0.08℃/10年和0.05℃/10年,1979~2010年土壤温度增加更快,增加率为0.38(1m)℃/10年和0.27(15m)℃/10年。
(3) 土壤增温特征为青藏高原西北部增温高于东南部、冬季增温高于夏季、浅层增温高于深层、增温随经度增加而减小、增温随纬度增加先增加而后略减小。
(4) 土壤温度增加主要受气温控制,浅层(1m)土壤温度对气温变化较深层(15m)更敏感,其敏感度分别为0.79℃/℃和0.37℃/℃;多年冻土温度对气候变化较季节冻土更敏感,其1m(15m)深度敏感性分别为0.80℃/℃和0.78℃/℃(0.38℃/℃和0.36℃/℃)。
上述结果对认识过去百年青藏高原冻土及陆地生态系统变化具有一定的指示意义。基于气象站和野外钻孔观测资料的验证证明了这些模拟结果的合理性。同时,对比发现本模拟结果要比再分析资料更接近观测的土壤温度变化,并且这套资料具有较长时期(1901~2010年)、较高时空分辨率(每天和0.5°)和较深深度(0~35m,15层)的优势,这些使得在将来可以广泛地运用这套模拟结果去研究与青藏高原土壤温度相关的各种变化(比如冻土)、联系(比如遥相关)及物理机制。该套模拟数据可以联系论文作者获得。
由于本研究利用了在冻土模拟方面较为成熟的最新版本的通用陆面模式,同时采用了模式自带的CRUNCEP大气资料。CRUNCEP资料融合了CRU观测资料,且分辨率较高,在区域陆面模拟方面具有一定的优势。这些优势在一定程度上提高了本文模拟结果的可信度。由于青藏高原地形十分复杂,对模拟分辨率要求较高。本研究中的分辨率为0.5°,这一分辨率对青藏高原而言可能仍较粗,给模拟结果带来了不确定,将来可以采取更高分辨率的模拟试验研究。此外,研究表明CLM模式中的植被在青藏高原上存在一定的误差[46],这可能在一定程度上影响了模拟的准确度。将来可以采用国内的《中国1︰1000000植被图》[47]数据集对模式地面和土壤数据进行校正,减少模拟结果的不确定。
鉴于土壤温度对冻土及陆面过程、生态等的重要性,之前学者已经对它们的日变化、月变化、季节变化、年际变化、年代际等进行了研究[19~23]。本研究在更长时间尺度(110年)上对青藏高原土壤温度变化进行了数值模拟研究。揭示了过去百年青藏高原土壤温度演化的时空特征,阐明了土壤温度演化与土壤深度、纬度、经度和气温变化的联系。将来的研究可以集中在过去百年青藏高原土壤湿度和地表水热交换过程变化及其机理的模拟研究方面。
致谢: 感谢同行评审专家和编辑部老师提出的宝贵修改意见!本研究受国家自然科学基金项目(批准号:41405087和41401086) 和公益性行业(气象)科研专项项目(批准号:GYHY201406001) 共同资助。
| 1 |
Ciais P, Sabine C, Bala G et al. Carbon and other biogeochemical cycles. In:Stocker T, Qin D, Plattner G et al.eds. Climate Change 2013:The Physical Science Basis. Contribution of Working Group Ⅰ to the Fifth Assessment Report of the Intergovernmental Panel on Climate Change. Cambridge, United Kingdom and New York:Cambridge University Press, 2013. 465~570
|
| 2 |
Mu C, Zhang T, Wu Q, et al. Editorial:Organic carbon pools in permafrost regions on the Qinghai-Xizang(Tibetan)Plateau. The Cryosphere, 2015, 9(2): 479-486. DOI:10.5194/tc-9-479-2015 |
| 3 |
Zhang T, Barry R, Knowles K, et al. Statistics and characteristic of permafrost and ground-ice distribution in the Northern Hemisphere. Polar Geography, 1999, 23(2): 132-154. DOI:10.1080/10889379909377670 |
| 4 |
Yang Meixue, Nelson F, Shiklomanov N, et al. Permafrost degradation and its environmental effects on the Tibetan Plateau:A review of recent research. Earth-Science Reviews, 2010, 103(1): 31-44. |
| 5 |
Guo Donglin, Yang Meixue, Wang Huijun. Sensible and latent heat flux response to diurnal variation in soil surface temperature and moisture under different freeze/thaw soil conditions in the seasonal frozen soil region of the central Tibetan Plateau. Environmental Earth Sciences, 2011, 63(1): 97-107. DOI:10.1007/s12665-010-0672-6 |
| 6 |
Guo Donglin, Yang Meixue, Wang Huijun. Characteristics of land surface heat and water exchange under different soil freeze/thaw conditions over the central Tibetan Plateau. Hydrological Processes, 2011, 25(16): 2531-2541. DOI:10.1002/hyp.v25.16 |
| 7 |
张廷军. 全球多年冻土与气候变化研究进展. 第四纪研究, 2012, 32(1): 27-38. Zhang Tingjun. Progress in global permafrost and climate change studies. Quaternary Sciences, 2012, 32(1): 27-38. |
| 8 |
Chen Boli, Luo Siqiong, Lü Shihua, et al. Effects of the soil freeze-thaw process on the regional climate of the Qinghai-Tibet Plateau. Climate Research, 2014, 59(3): 243-257. DOI:10.3354/cr01217 |
| 9 |
Cuo Lan, Zhang Yongxi, Bohn T, et al. Frozen soil degradation and its effects on surface hydrology in the northern Tibetan Plateau. Journal of Geophysical Research:Atmospheres, 2015, 120(16): 8276-8298. DOI:10.1002/2015JD023193 |
| 10 |
Guo Donglin, Wang Huijun. Permafrost degradation and associated ground settlement estimation under 2℃ global warming. Climate Dynamics, 2016. DOI:10.1007/s00382-016-3469-9 |
| 11 |
IPCC:Summary for policymakers. In:Stocker T, Qin D, Plattner G et al.eds. Climate Change 2013:The Physical Science Basis. Contribution of Working Group Ⅰ to the Fifth Assessment Report of the Intergovernmental Panel on Climate Change. Cambridge, United Kingdom and New York:Cambridge University Press, 2013. 3~29
|
| 12 |
Guo Donglin, Wang Huijun. The significant climate warming in the northern Tibetan Plateau and its possible causes. International Journal of Climatology, 2012, 32(12): 1775-1781. DOI:10.1002/joc.v32.12 |
| 13 |
Guo Donglin, Yu Entao, Wang Huijun. Will the Tibetan Plateau warming depend on elevation in the future?. Journal of Geophysical Research:Atmospheres, 2016, 121(8): 3969-3978. DOI:10.1002/2016JD024871 |
| 14 |
Guo Donglin, Li Duo, Hua Wei. Quantifying air temperature evolution in the permafrost region from 1901 to 2014. International Journal of Climatology, 2017. DOI:10.1002/joc.5161 |
| 15 |
Zou Defu, Zhao Lin, Sheng Yu, et al. A new map of the permafrost distribution on the Tibetan Plateau. The Cryosphere Discussions, 2016. |
| 16 |
Guo Donglin, Wang Huijun. CMIP5 permafrost degradation projection:A comparison among different regions. Journal of Geophysical Research:Atmospheres, 2016, 121(9): 4499-4517. DOI:10.1002/2015JD024108 |
| 17 |
Guo Donglin, Sun Jianqi. Permafrost thaw and associated settlement hazard onset timing over the Qinghai-Tibet engineering corridor. International Journal of Disaster Risk Science, 2015, 6(4): 347-358. DOI:10.1007/s13753-015-0072-3 |
| 18 |
Romanovsky V E, Smith S L, Christiansen H H. Permafrost thermal state in the polar Northern Hemisphere during the international polar year 2007-2009:A synthesis. Permafrost and Periglacial Processes, 2010, 21(2): 106-116. DOI:10.1002/ppp.689 |
| 19 |
杨梅学, 姚檀栋, KoikeT. 藏北高原土壤温度的变化特征. 山地学报, 2000, 18(1): 16-17. Yang Meixue, Yao Tandong, Koike T. Variation features of soil temperature in northern Tibetan Plateau. Journal of Mountain Science, 2000, 18(1): 16-17. |
| 20 |
Wu Qingbai, Zhang Tingjun. Recent permafrost warming on the Qinghai-Tibetan Plateau. Journal of Geophysical Research, 2008, 113: D13108. DOI:10.1029/2007JD009539 |
| 21 |
Zhao Lin, Wu Qingbai, Marchenko S S, et al. Thermal state of permafrost and active layer in Central Asia during the international polar year. Permafrost and Periglacial Processes, 2010, 21(2): 198-207. DOI:10.1002/ppp.688 |
| 22 |
张文纲, 李述训, 庞强强. 近45年青藏高原土壤温度的变化特征分析. 地理学报, 2008, 63(11): 1151-1159. Zhang Wengang, Li Shuxun, Pang Qiangqiang. Variation characteristics of soil temperature over Qinghai-Xizang Plateau in the past 45 years. Acta Geographica Sinica, 2008, 63(11): 1151-1159. DOI:10.3321/j.issn:0375-5444.2008.11.004 |
| 23 |
赵林, 李韧, 丁永建, 等. 青藏高原1977-2006年土壤热状况研究. 气候变化研究进展, 2011, 7(5): 307-316. Zhao Lin, Li Ren, Ding Yongjian, et al. Study on thermal conditions of soil on the Tibetan Plateau from 1977 to 2006. Advances in Climate Change Research, 2011, 7(5): 307-316. |
| 24 |
邹德富, 赵林, 吴通华, 等. MODIS地表温度产品在青藏高原连续多年冻土区的适用性分析. 冰川冻土, 2015, 37(2): 308-317. Zou Defu, Zhao Lin, Wu Tonghua, et al. Assessing the applicability of MODIS land surface temperature products in continuous permafrost regions in the central Tibetan Plateau. Journal of Glaciology and Geocryology, 2015, 37(2): 308-317. |
| 25 |
刘川, 余晔, 解晋, 等. 多套土壤温湿度资料在青藏高原的适用性. 高原气象, 2015, 34(3): 653-665. Liu Chuan, Yu Ye, Xie Jin, et al. Applicability of soil temperature and moisture in several datasets over Qinghai-Xizang Plateau. Plateau Meteorology, 2015, 34(3): 653-665. DOI:10.7522/j.issn.1000-0534.2015.00034 |
| 26 |
秦艳慧, 吴通华, 李韧, 等. ERA-Interim地表温度资料在青藏高原多年冻土区的适用性. 高原气象, 2015, 34(3): 666-675. Qin Yanhui, Wu Tonghua, Li Ren, et al. Application of ERA product of land surface temperature in permafrost regions of Qinghai-Xizang Plateau. Plateau Meteorology, 2015, 34(3): 666-675. DOI:10.7522/j.issn.1000-0534.2014.00151 |
| 27 |
Viovy N. CRUNCEP dataset. 2011 Description available at http://www.cesm.ucar.edu/models/cesm1.2/clm/clm_forcingdata_esg.html
|
| 28 |
Mitchell T D, Jones P D. An improved method of constructing a database of monthly climate observations and associated high-resolution grids. International Journal of Climatology, 2005, 25(6): 693-712. DOI:10.1002/(ISSN)1097-0088 |
| 29 |
Kalnay E, Kanamitsu M, Kistler R, et al. The NCEP/NCAR 40-year reanalysis project. Bulletin of the American Meteorological Society, 1996, 77(6): 437-471. |
| 30 |
Mao J, Shi X, Thornton P E, et al. Global latitudinal-asymmetric vegetation growth trends and their driving mechanisms:1982-2009. Remote Sensing, 2013, 5(3): 1484-1497. DOI:10.3390/rs5031484 |
| 31 |
Shi X, Mao J, Thornton P E, et al. Spatiotemporal patterns of evapotranspiration in response to multiple environmental factors simulated by the Community Land Model. Environmental Research Letters, 2013, 8(2): 024012. DOI:10.1088/1748-9326/8/2/024012 |
| 32 |
Dee D, Uppala S, Simmons A, et al. The ERA-Interim reanalysis:Configuration and performance of the data assimilation system. Quarterly Journal of the Royal Meteorological Society, 2011, 137(2): 553-597. |
| 33 |
Saha S, Moorthi S, Pan H, et al. The NCEP Climate Forecast System Reanalysis. Bulletin of the American Meteorological Society, 2010, 91(8): 1015-1057. DOI:10.1175/2010BAMS3001.1 |
| 34 |
Wang A, Zeng X. Evaluation of multireanalysis products with in situ observations over the Tibetan Plateau. Journal of Geophysical Research:Atmospheres, 2012, 117: D05102. DOI:10.1029/2011JD016553 |
| 35 |
Wu Q, Zhang T, Liu Y. Thermal state of the active layer and permafrost along the Qinghai-Xizang(Tibet)Railway from 2006 to 2010. The Cryosphere, 2012, 6(3): 607-612. DOI:10.5194/tc-6-607-2012 |
| 36 |
Niu G, Yang Z. Effects of frozen soil on snowmelt runoff and soil water storage at a continental scale. Journal of Hydrometeorology, 2006, 7(5): 937-952. DOI:10.1175/JHM538.1 |
| 37 |
Lawrence D M, Slater A G, Romanovsky V E, et al. Sensitivity of a model projection of near-surface permafrost degradation to soil column depth and representation of soil organic matter. Journal of Geophysical Research, 2008, 113: F02011. DOI:10.1029/2007JF000883 |
| 38 |
Lawrence D M, Slater A G, Swenson S C. Simulation of present-day and future permafrost and seasonally frozen ground conditions in CCSM4. Journal of Climate, 2012, 25(7): 2207-2225. DOI:10.1175/JCLI-D-11-00334.1 |
| 39 |
Guo Donglin, Wang Huijun. Simulated change in the near-surface soil freeze/thaw cycle on the Tibetan Plateau from 1981 to 2010. Chinese Science Bulletin, 2014, 59(20): 2439-2448. DOI:10.1007/s11434-014-0347-x |
| 40 |
Guo Donglin, Wang Huijun. Simulation of permafrost and seasonally frozen ground conditions on the Tibetan Plateau, 1981-2010. Journal of Geophysical Research:Atmospheres, 2013, 118(11): 5216-5230. DOI:10.1002/jgrd.50457 |
| 41 |
Guo Donglin, Wang Huijun, Li Duo. A projection of permafrost degradation on the Tibetan Plateau during the 21st century. Journal of Geophysical Research, 2012, 117: D05106. DOI:10.1029/2011JD016545 |
| 42 |
Lawrence P J, Chase T N. Representing a new MODIS consistent land surface in the Community Land Model(CLM3.0). Journal of Geophysical Research, 2007, 112: G01023. DOI:10.1029/2006JG000168 |
| 43 |
Bonan G B, Levis S, Kergoat L, et al. Landscapes as patches of plant functional types:An integrating concept for climate and ecosystem models. Global Biogeochemical Cycles, 2002, 16(2): 5-1. |
| 44 |
Nash J E, Sutcliffe J V. River flow forecasting through conceptual models. Part Ⅰ:A discussion of principles. Journal of Hydrology, 1970, 10(3): 282-290. DOI:10.1016/0022-1694(70)90255-6 |
| 45 |
李树德, 程国栋. 青藏高原冻土图. 兰州: 甘肃文化出版社, 1996. Li Shude, Cheng Guodong. Map of Permafrost Distribution on the Qinghai-Xizang(Tibetan)Plateau. Lanzhou: Gansu Cultural Press, 1996. |
| 46 |
韩振宇, 高学杰, 石英, 等. 中国高精度土地覆盖数据在RegCM4/CLM模式中的引入及其对区域气候模拟影响的分析. 冰川冻土, 2015, 37(4): 857-866. Han Zhenyu, Gao Xuejie, Shi Ying, et al. Development of Chinese high resolution land cover data for the RegCM 4/CLM and its impact on regional climate simulation. Journal of Glaciology and Geocryology, 2015, 37(4): 857-866. |
| 47 |
张新时. 中华人民共和国植被图(1: 1000000). 北京: 地质出版社, 2007. Zhang Xinshi. Vegetation map of the peoples republic of China(1: 1000000). Beijing: China Land Press, 2007. |
② Collaborative Innovation Center on Forecast and Evaluation of Meteorological Disasters, Nanjing University of Information Science & Technology, Nanjing 210044;
③ Joint Laboratory of Climate and Environment Change, Chengdu University of Information Technology, Chengdu 610225;
④ Institute of Tibetan Plateau Research, Chinese Academy of Sciences, Beijing 100101;
⑤ National Climate Center, Beijing 100081;
⑥ University of Chinese Academy of Sciences, Beijing 100049;
⑦ Northwest Institute of Eco-Environment and Resources, Chinese Academy of Sciences/Cryosphere Research Station on Qinghai-Xizang Plateau, Lanzhou 730000)
Abstract
Frozen ground change is a hot issue in the research regarding climate change, and soil temperature is an important parameter for research on frozen ground change. However, the change in soil temperature at deep layer has not be well understood on a centenary time-scale. This study investigates the change in soil temperature on the Tibetan Plateau (25°~40.5°N, 75°~105°E) from 1901 to 2010 using the latest version of Community Land Model(CLM), CLM4.5, driven by the default forcing dataset of CRUNCEP in the model. The in situ observations from both 20 meteorological stations and 4 field borehole monitoring sites were collected to validate the simulated results. The results show that (1) the CLM can reproduce the observed changes in soil temperature(the correlation coefficient is 0.92 and the Nash-Sutcliffe efficiency is 0.82), and the results are superior to reanalysis data. (2) Soil temperature at 15m depth increased by 0.05(0.27)℃/decade on the Tibetan Plateau during 1901~2010(1979~2010). The increase in the soil temperature is larger in winter than summer. Increase in soil temperature decreased along with increasing depth and longitude and first increased and then slightly decreased along with increasing latitude. (3) Change in soil temperature on the Tibetan Plateau is mostly influenced by air temperature. Sensitivity of soil temperature at 1m(15m)depth to air temperature change is 0.79(0.37)℃/℃. Soil temperature at shallow layer is more sensitive than those at deep layer and permafrost temperature is more sensitive than seasonally frozen ground temperature. These results are useful for in-depth understanding the change in soil temperature on the Tibetan Plateau on a centenary time-scale.