 2015, Vol.35


1 引言
随着树轮、 冰芯、 石笋等古气候代用资料数据网络的不断丰富和完善[1, 2, 3, 4, 5, 6, 7, 8, 9, 10],空间大尺度的气候重建研究已成为可能。就温度重建而言,已涌现出大量关于重建全球或北半球温度平均序列的研究[11, 12, 13, 14, 15, 16, 17, 18]。然而,大尺度温度空间格局重建的研究还相对较少[19, 20]。与单一平均序列相比,基于气候场重建(Climate Field Reconstruction,简称CFR)方法所得到的重建数据不仅可以揭示不同时间尺度上的变化规律,还能够在动力机制层面提供更加详细的基础数据[19]。气候场重建资料在气候变化科学领域中的重要性已成为广泛共识[21, 22]。因此,气候空间场重建方法的研究显得十分迫切。
目前,气候场重建方法主要分为两大类,一类是通过对各格点与其附近的代用资料建立回归关系,从而逐个格点进行重建,即点对点回归方法[23, 24, 25]; 另一类是利用代用资料网络和目标气候场之间的典型空间型的相互关系构建模型,进而实现对气候场的重建,例如典型相关分析法[26, 27, 28]、 主成分分析法等[19, 20, 29]。前者点对点回归法对代用资料的要求较高,且偏重于区域局地信息的反演,很难重建出代用资料贫乏区域的空间特征的变化信息; 而后者,则着重于空间特征型的演变,将原本自由度很高的整个空间场做了一定的降维处理,也就是以某几个空间特征型为主,通过不同的方法试图建立代用资料与这些空间型的统计关系,继而实现空间格局演变特征的重建,因此这类方法更适用全球或半球尺度气候空间格局的重建,例如正则期望最大法[19](Regularized Expectation Maximization,简称RegEM)。 现有的CFR方法主要是通过回归模型(最小二乘法回归、 岭回归,以及总体最小二乘法回归)建立空间型的演变与代用资料间的关系,而基于回归方法所建立的重建模型往往会出现“变率/方差损失”的问题[30, 31]。另外,为了避免“过度拟合”的情况出现,现有的CFR方法一般需要提取主要空间模态来实现“正则化”,但对于不同的资料集以及不同的代用资料特征,究竟选用多少模态作为主模态目前仍没有明确的标准[32, 33]。
本文基于常用的经验正交函数(Empirical Orthogonal Function,简称EOF)分析方法,提出了一种新的气候场重建方法,即模态逼近的经验正交函数分解方法(Mode approached EOF,简称MA-EOF),也就是利用代用资料与器测资料不同EOF空间模态之间的协调性,通过逐次重构并更新有效值,最终得到无器测资料覆盖的空间点的气候场重建结果。
2 资料和方法 2.1 温度资料器测资料采用Berkeley Earth地表气温[34, 35]的北半球陆地格点数据。为了减少变量自由度并结合代用资料的分布情况,将分辨率为1°×1°的器测资料插值到5°×5°的格点上。由于少数格点在1850~1880年之间有不同程度的缺测,本文采用基于岭回归的正则期望最大方法[36]对该时段上的缺测资料做了插补,使得每个格点最终均覆盖了1850~2000A.D. 时段。此外,还引入了第五次耦合模式比较计划(Coupled Model Intercomparison Project Phase 5,简称CMIP5)中的过去千年模拟试验结果用于对比,提取其中的地表气温模拟数据,并统一插值到相同的5°×5°经纬网格。本文共引用了CMIP5中的5个模式的7个模拟结果,分别为BCC-CSM1-1[37]、 CSIRO-Mk3L-1-2[38, 39]、 HadCM3[40]、 MPI-ESM-P[41]和GISS-E2-R(包含p121、 p124和p125共3组结果,见http://data.giss.nasa.gov/modelE/ar5/)。
2.2 代用资料目前受该方法的算法限制,本文仅收集了树轮资料用于重建北半球年平均温度的空间格局,暂未考虑低分率代用资料的引用。树轮资料共来源于4种途径:1)国际树轮数据库(International Tree-Ring Data Bank,简称ITRDB); 2)过去两千年全球变化研究网络(PAGES 2k network); 3)中国气象科学数据共享服务网; 4)已发表的相关文献。收集起始年份早于1800年的年表资料,截取样本量大于8的时段作为有效时段,再从中筛选出与各自最近格点的年均温存在正相关且通过95%显著性的树轮序列用于温度场重建。最终共筛选得到549条树轮代用资料,其中269条序列来源于ITRDB,最短序列长度为180年,最长为1990年; 267条来源于PAGES 2k,最短序列长度为393年,最长为2000年; 7条序列来自于中国气象科学数据共享服务网,最短序列长度为259年,最长为403年; 6条序列来自于已发表的相关文献[42, 43, 44, 45, 46, 47],最短序列长度为197年,最长为1001年。树轮代用资料的空间分布如图 1所示,覆盖的最高纬度为 71.90°N,最低纬度为 24.53°N,本文的温度场重建范围为 22.5°N以北的整个北半球陆地区域。同样,利用正则期望最大法[36]对在最近三十多年有缺测的树轮数据做插补,使得所有树轮序列均达到公元2000年。

|
图 1 筛选后用于北半球年均温格点重建的树轮资料的空间分布图 Fig. 1 Spatial distribution of the screened tree-ring database used for the Northern Hemisphere annual temperature field reconstruction |
由于各个树轮代用资料的覆盖时段差异较大,随着重建时间向更早的时段延伸,可用的代用资料数目减少,并且空间代表性也越来越差。因此,为了减少代用资料数量随时间变化的干扰,按照覆盖时段,将549条树轮序列分为17组,起始时间从公元1800年开始逐渐向更早的时间延伸,每隔50年为一组,即第1组覆盖时段为1800~2000年,第2组为1750~2000年,第3组为1700~2000年,依此类推,第17组覆盖时段为1000~2000年。每组树轮数据所覆盖的时段及其对应的年表个数如图 2所示。对第1组而言,由于收集到的所有树轮序列起始年都早于1800年,所以第1组树轮数据为全部549条树轮序列在1800~2000年时段上的数据。而早于1800年的数据则被“裁掉”。而在第2组,由于覆盖时段向前延伸了50年(即1750~2000年,见图 2),为保证该时段上树轮数据的完整性,所以起始年位于该时段内的树轮序列则不会被再次归入第2组,因而第2组树轮数据是474条树轮序列(起始年均早于1750年)在1750~2000年时段上的所有数据。依此类推,直到第17组时,仅剩48条树轮序列可用,即第17组树轮数据是指这48条树轮序列在1000~2000年时段上的数据。

|
图 2 分组后的每组树轮数据所覆盖的时段(灰色条柱)及其对应的年表个数(线) Fig. 2 Time spans(gray column)of each group and the amount of total available chronologies(solid line)after grouping |
本研究提出的模态逼近EOF方法(MA-EOF)与目前国际上采用的气候场重建方法(CFR)[48]的基本思路相同,即将代用资料与器测数据共同组成增广矩阵,并将该矩阵中对应规则格点上没有器测资料覆盖时段的数据点设为缺测,进而将温度格点重建问题转化为数据“插补”问题,在有器测资料时段则不做重建,只关注“缺失值”的部分。一般而言,CFR方法的核心就是通过建立相应的统计模型使得代用资料与器测数据之间建立联系,并将这种联系推广到较早的时段内进而实现气候场(或区域平均序列)的重建。本文尝试基于不同模态逼近下的EOF重构算法,尽量保留代用资料所反映的不同层次的变率特征,使得最终重构的数据集能够反映不同尺度的信息,从而实现对格点温度的重建。本方法的实施主要包括3个基本循环步骤,即数据分解、 数据重构和数据更新,具体介绍如下。
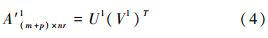
2.3.1 数据分解对于每一组树轮数据来说,将器测数据与标准化后的代用资料按照对应的时间放置在同一个数据矩阵中,对该矩阵做EOF分解,得到基于该矩阵的时空依赖关系,即空间模态与时间系数。假定规则格点的器测资料(Tm×ni)格点数为m,时间长度为ni,可利用的代用资料矩阵(Pp×nr)包含的序列个数为p,时间跨度为nr,进而重构数据的时间跨度也为nr。在没有器测资料时段(np)器测资料规则网格上的数据统一赋予零值,即矩阵A 可以写为:
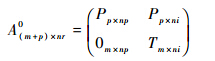
其中,nr=ni+np,即重构数据的增广矩阵时间长度包括器测资料长度与只有代用资料覆盖的时间长度之和。
对矩阵A(m+p)×nr0做EOF分解,即:
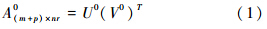
其中,U0=(u10,u20,.,ul0)为空间模态,V0=(v10,v20,.,vl0)为对应的时间系数,右上角数字代表算法循环的次数(0表示从最初的矩阵开始分解),右下角数字代表模态数,l∈min(m+p,nr)。
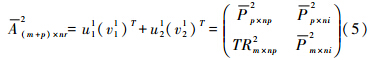
2.3.2 数据重构利用上一步骤得到的时空模态,从最低阶(第一主模态)开始重构,得到:
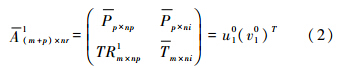
在A(m+p)×nr1中,TRm×np1即为原增广矩阵(A(m+p)×nr)的第一主模态的重构结果,而相应的 和
和 即为第一主模态的低阶近似。
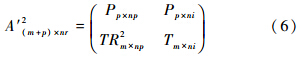
提取出每次分解与重构后所得到的A(m+p)×nr1中在缺值位置(待重建部分)的重构结果TRm×np1,其余部分则全部以初始的代用料以及器测数据替换,得到数据更新矩阵:
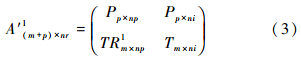
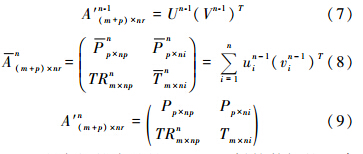
此时算法采用第一个模态近似下的重建步骤已经完成,在A′(m+p)×nr1的基础上重复第一步的EOF分解,但在第二步中,重构过程则采用前两个模态进行,即:
分解过程:
重构过程:
更新过程:
到第n次循环时则有:
以上所介绍的步骤是基于一组树轮数据的重建过程,在本文中需要对17组数据分别进行重建,共得到17套格点重建数据,以此更加深入的认识代用资料空间覆盖度的变化对重建结果的影响。整体来看,本方法主要是通过EOF模态的逐次重构从而叠加更高阶的模态信息,这一过程是在已有的低阶模态重构信息基础上做出的。因而在整个算法循环过程中(数据分解,数据重构,数据更新),循环次数与迭代数据模态数是对应的,随着算法循环次数逐渐增加,更高模态的信息也就逐步引入,最终实现空间格局的重建。值得注意的是,为了避免“过度学习”的情况出现,本方法设置截断条件为当重构数据方差总和超过器测数据所有格点上的变率方差总和时,停止循环算法,此时所对应的n即为截断阶数。另外,由于本文所提出的方法是基于EOF分析做出的,所以重建结果的空间特征在一定程度上是依赖于器测数据的,相对于点对点回归方法,可能会丢失部分气候空间特征随时间变化的信息。
为了比较本方法(MA-EOF)与已有的正则期望最大法(RegEM)在重建温度空间格局方面的异同,还利用RegEM方法基于相同的树轮资料做了重建。该方法的使用与文献[19]中的高频重建部分的参数设定是相同的,由于篇幅有限,本文暂不对该方法的细节做详细介绍。
2.4 验证方法考虑到所搜集的树轮资料在最近的三十多年可用年表数量衰减较为严重,且器测资料在1850年后的10年内也存在较多缺测,因而在本研究中,将验证时段设定为1861~1960年。验证时每次取20年为一个验证子时段,即取1861~1880年、 1881~1900年、 1901~1920年、 1921~1940年以及1941~1960年共5段,对17个数据组分别做5次验证试验,依次轮换验证子时段。最终将每个数据组对应的5个验证子时段上的重建结果拼接起来,便得到了各组长度为100年(1861~1960年)的验证数据。值得指出的是,通过这样的轮换方法,就可以保证每一段的验证数据与相对应的器测数据是完全独立的,从而可以利用验证数据的结果来评价重建方法的有效性,以及确定在多大程度上由于树轮数据逐渐减少引起的代表性误差是允许的,也就是确定哪些组的重建结果是可靠的。
在1861~1960年时段上,对每组拼接后的验证数据的格点资料与插值后的Berkeley Earth格点资料计算“点对点”的空间相关系数,并统计了存在正相关且超过95%显著性的格点总数。此外,还对器测资料和得到的每一组验证数据的所有格点求平均,计算每组验证数据的平均序列相对于Berkeley Earth平均序列的相关系数(r)、 缩减误差(Reduced Error,简称RE),以及均方根误差(Root Mean Squared Error,简称RMSE),以此来评估该方法重现已有器测数据变率的能力。在检验上述计算得到的评估参数的显著性时采用非参数检验的方法。与该研究[19]类似,本文通过一阶自回归模型与Monte Carlo方法[49]生成具有红噪声的1000个样本序列,从而统计得到不同评估参数的显著性阈值。
3 结果与讨论 3.1 检验结果验证试验的结果(图 3)显示,在格点资料方面,前13组验证数据中与器测数据存在正相关且超过95%显著性的格点个数均大于250个,约占重建格点总数(505个)的一半; 在平均序列方面,所有组的验证数据与器测数据的相关系数超过了99%显著阈限,前12组的RE和RMSE分别超过了Monte Carlo方法估计得到的99%显著性阈值。随着组数的增大,可用树轮序列的数量不断减小,重建得到的格点资料的误差会越来越大。结合图 3所示的4种评估参数的验证结果,最终将通过检验的1~12组数据重建的格点资料认为是可靠的,也就表明截止到第12组时所对应的树轮资料的空间分布以及数量(103条)是能够保证器测数据的变率特征得到有效重建的。另外,通过重建数据与观测数据在验证时段上的平均序列的对比结果(图 4)可以看出,尽管在年际变率上两者有时存在一定的偏差,但在整体的年代际变率上两者有较好的一致性,说明该重建方法在保证一定代用资料空间覆盖度的前提下能够较好的再现器测数据的主要年代际变率。

|
图 3 1861~1960年时段上每组树轮数据的各项验证结果包括相关系数(r)、 缩减误差(RE)、 均方根误差(RMSE), 以及超过95%显著性的格点总数; 虚线表示99%显著阈限 Fig. 3 Validation results of each group during the period 1861~1960,including the correlation coefficient,reduction of error,root mean square error and the total amount of grids with significant correlations passed 95% threshold. The horizontal dashed lines denoted the 99% significance levels |

|
图 4 重建数据与观测数据在验证时段 (1861~1960年)上的序列对比黑线表示Berkeley Earth观测数据,浅灰线表示所有17组的重建序列,红线表示通过验证的前12组重建序列的平均 Fig. 4 Comparisons of timeseries between observed and reconstructed mean temperatures during the validation period 1861~1960. Black line indicated the observed data from Berkeley Earth,light gray lines denoted reconstructions of 17 groups,and red line was the average of the first twelve groups which passed the validation |
通过以上验证试验,可以确定前12组树轮组数据分别重建得到的格点资料是有效可靠的,因此将这12套格点重建数据在对应的每年每个格点上做算术平均,作为最终的北半球地表气温空间场的重建结果。由于第12组的覆盖时段为1250~2000年(见图 2),所以本文最终重建得到了1250~1850年没有器测资料时段的北半球(22.5°N以北)地表气温的空间格局。与RegEM方法[19]类似,1851~2000年时段直接采用器测数据本身。
3.2 小冰期空间格局特征为了比较本方法(MA-EOF)与已有的正则期望最大法(RegEM)[19]在重建温度空间格局方面的异同,我们利用RegEM方法基于相同的树轮资料(549条)做了格点重建,并选择小冰期这一特征时段,对比两种方法的重建结果。本文采用Mann等[19]所定义的小冰期时段,即1400~1700年。图 5a和5b对比了两种方法重建结果相对于现代平均气候状态(1961~1990年)在小冰期时段的平均温度异常。可以看出,采用相同的代用资料,两种方法的重建结果都指示了中高纬地区较显著的冷异常,如北美西北部地区、 欧洲东部以及西伯利亚地区。但MA-EOF重建结果主要表现为除欧洲的一部分区域以外的半球尺度显著的冷异常,而RegEM的重建结果在北美中部、 地中海沿岸,以及亚洲中部地区出现了一定程度的暖异常,尤其是在北美中部以及格陵兰地区的暖异常相比现代平均气候状态(1961~1990年)通过了95% 的t检验信度。另外,本文还将两种方法的重建结果与CMIP5中过去千年模拟结果的集合平均所估计的小冰期平均气候状态(图 5c)做了对比。结果表明,MA-EOF重建结果除在欧洲部分地区存在一定的偏差之外,其空间格局基本与模式结果有较好的匹配,两者的整体空间相关系数为0.21,通过了95%显著性水平。而基于RegEM方法的重建结果在格陵兰地区表现出较为明显的暖异常,在某些中低纬度地区也与模式结果存在明显差异,且两者的整体空间相关系数为负。这很可能是因为RegEM算法是基于“截断总体最小二乘法”(Truncated Total Least Square)回归模型的,需要对原始数据做EOF分解后,按照一定的方差解释量设置截断阶数,并且这一阶数在算法实施的整个过程中是固定的,当方差解释量设置过大时(例如50%以上),重建结果会出现明显失真的变率特征。这样就容易导致RegEM方法所用到的模态个数往往比MA-EOF方法的偏少,使得最终重建结果的低频信号相对较弱,进而低估了某些区域在小冰期时段的降温幅度。尽管本文提出的方法相对于模式模拟的结果更加接近,但模式模拟的长时间尺度变率因为受到内部变率的影响也会存在一定的误差。不过,在北美西北部地区、 欧洲东部以及西伯利亚地区,三者都表现出了大范围的冷异常(图 5),这一点与Mann等[19]基于多种代用资料重建的小冰期空间格局是较为一致的。

|
图 5 1400~1700年小冰期时段的平均温度异常(相对于1961~1990年)的空间格局对比 (a)基于MA-EOF方法的重建结果;(b)基于RegEM方法的重建结果;(c)多模式集合平均的模拟结果 #表示差异通过95%置信度水平 Fig. 5 Comparison of the spatial patterns for the temperature anomaly during the Little Ice Age(with respect to 1961~1990A.D.). (a)Reconstruction based on MA-EOF method;(b)reconstruction based on RegEM method;(c)ensemble mean of the multi-model simulations. # denoted the significant differences with a 95% level of confidence |
Gao等[50]利用两极以及格陵兰地区的冰芯数据重建了过去1500年(公元501~2000年)由于火山活动所排放的硫酸盐气溶胶总量的变化,该资料目前已成为CMIP5中过去千年模拟试验常用的火山强迫资料之一。根据该资料,如图 6所示,分别以100Tg、 50Tg和25Tg硫酸盐气溶胶排放总量依次作为强火山年、 中等强度火山年和弱火山年大致水平的界定标准,分别挑选出最靠近这3条水平线的3个火山喷发事件作为个例用于后续分析。此外,由于过早时段可用年表数量较少,重建结果的不确定性较大,所以典型火山年的挑选均在1400年之后。最终,挑选出9次强度不等的火山喷发事件,以1452年、 1783年和1815年为代表的强火山年,以1600年、 1641年和1809年为代表的中等强度火山年,以1584年、 1693年和1719年为代表的弱火山年。

|
图 6 文献[50]重建的火山活动硫酸盐气溶胶排放总量(Tg)的变化以及本文所挑选的9个典型火山年份的示意图 Fig. 6 Reconstruction of the total stratospheric sulfate aerosol injection derived from the reference[50]. The arrows indicated the nine volcanic years selected for analysis in this study |
对比重建结果在这9个典型火山年上的空间格局差异可以发现,对不同强度的火山喷发事件而言,重建的格点资料体现出较为明显的空间格局特征(图 7)。在强火山年,除了个别小区域外,整个北半球均表现出一致的降温,且降温幅度明显大于中等强度与弱火山年的幅度,具有更加显著的冷中心。在中等强度火山年,基本表现出半球尺度的降温空间型,但降温幅度较大的冷中心并不明显。在弱火山年,整个北半球并没有表现出一致的降温空间型,较大幅度的降温仅出现在局部地区,例如: 东欧平原、 西伯利亚,以及北美西北部阿拉斯加等高纬度地区。尽管重建结果在不同程度火山年上的空间格局差异较为明显,但从整体来看,均表现出火山的“冷效应”普遍在高纬度地区更加显著的特征,即高纬度地区对火山外强迫更加敏感,其降温幅度明显强于中低纬度地区。这一特征与已有的基于模式模拟研究的结论是一致的[51]。

|
图 7 重建结果在不同强度的典型火山年上的空间格局差异(a)强火山年(1452年、 1783年和1815年);(b)中等强度火山年(1600年、 1641年和1809年);(c)弱火山年(1584年、 1693年和1719年) Fig. 7 Comparisons of reconstructed spatial patterns in several years of volcanic eruptions with different intensity.(a)Strong volcanic years:1452A.D.,1783A.D. and 1815A.D.; (b)moderate volcanic years:1600A.D.,1641A.D. and 1809A.D.; (c)relatively-weak volcanic years:1584A.D.,1693A.D. and 1719A.D. |
Timmreck等[52]认为,超级火山爆发后的火山灰(以硫酸盐气溶胶为主)通过大气环流输运到火山喷发以外的地区,通过改变大气层顶辐射平衡,造成全球尺度的降温。而本研究基于树轮的重建结果在强火山年却没能完全重现这种半球尺度的大幅度降温变化,例如1815年坦博拉火山爆发时,在阿拉斯加地区出现了一定范围的暖异常[52],这种异常可能与树轮本身对强火山活动引起降温的敏感性有直接关系。有研究认为由于树轮样点的空间分布、 气候响应的季节性,以及生物滞后效应等因素会造成树轮对火山活动的响应产生一定程度的低估[53, 54],尤其一些强烈火山活动更容易造成林线处树轮普遍缺轮,从而导致定年误差增大,使得在基于树轮重建的温度数据中,火山喷发的冷效应会被一定程度地低估,局部区域的空间响应格局表现异常[55, 56]。
4 结论本文提出了一种新的气候场重建方法,即模态逼近的经验正交函数分解方法。该方法主要是利用数据矩阵的多阶EOF模态进行逐次重构,既保证了重建结果具有主模态的特征,同时由于每一次重构数据是基于前一次的大尺度信号叠加而来,因此,还在一定程度上保证了不同尺度信息的协调性。基于该方法,本文利用549个树轮序列重建了北半球(22.5°N以北)自公元1250年以来的地表气温空间格局特征。验证试验结果表明该重建方法能够较好的再现器测数据的年代际尺度变率。与已有的气候场重建方法相比,该方法重建出的北半球在小冰期时段的冷异常空间格局更加明显,而且与多个模式集合平均在该时段的模拟结果更为接近。此外,重建结果在不同程度的典型火山年也体现出较为明显的空间格局差异,但在整体上表现出与模式模拟研究结果类似的特征,即高纬度地区对与火山外强迫更加敏感。综合以上结果,说明该方法在气候场重建方面有较大的应用潜力。未来可以进一步改进该重建方法,以期能够利用不同种类的代用资料(例如,石笋,冰芯,历史文献等)重建过去更长时间尺度、 低频变率更加明显的大尺度温度空间格局特征。
致谢 感谢审稿专家和编辑部老师建设性的修改意见,使文章得以完善。
| 1 | 刘 禹, 蔡秋芳, 宋慧明. 关于青藏高原2485年温度的季节和空间代表性问题. 第四纪研究, 2013, 33 (1):108~114 Liu Yu, Cai Qiufang, Song Huiming. Seasonal and spatial reprensentativeness of the tree-ring based 2485-year annual mean temperature reconstruction in the northeastern Tibetan Plateau. Quaternary Sciences, 2013, 33 (1):108~114 |
| 2 | 邵雪梅, 王树芝, 徐 岩等. 柴达木盆地东北部3500年树轮定年年表的初步建立. 第四纪研究, 2007, 27 (4):477~485 Shao Xuemei, Wang Shuzhi, Xu Yan et al. A 3500-year master tree-ring dating chronology from the northeastern part of the Qaidam Basin. Quaternary Sciences, 2007, 27 (4):477~485 |
| 3 | 杨 保. 树轮记录的小冰期以来青藏高原气候变化的时空特征. 第四纪研究, 2012, 32 (1):81~94 Yang Bao. Spatial and temporal patterns of climate variations over the Tibetan Plateau during the period 1300~2010. Quaternary Sciences, 2012, 32 (1):81~94 |
| 4 | 时兴合, 秦宁生, 刘洪滨等. 青海治多公元1374年以来树轮记录的青藏高原地面加热场强度变化. 第四纪研究, 2013, 33 (1):115~125 Shi Xinghe, Qin Ningsheng, Liu Hongbin et al. Surface heating field intensity change over Tibetan Plateau recorded Qinghai Zhiduo tree rings since 1374A.D.Quaternary Sciences, 2013, 33 (1):115~125 |
| 5 | 任军莉, 刘 禹, 宋慧明等. 甘肃临夏地区过去195年最高温度历史重建——基于紫果云杉树轮宽度资料. 第四纪研究, 2014,34 (6):1270~1279 Ren Junli, Liu Yu, Song Huiming et al. The historical reconstruction of the maximum temperature over the past 195 years, Linxia region, Gansu Province——Based on the data from Picea purpurea Mast. Quaternary Sciences, 2014,34 (6):1270~1279 |
| 6 | 姚檀栋, 杨梅学, 康兴成. 从古里雅冰芯与祁连山树轮记录看过去2000年气候变化. 第四纪研究, 2001,21 (6):514~519 Yao Tandong, Yang Meixue, Kang Xingcheng. Comparative study of the climate changes in the past 2000 years by using ice core and tree ring records. Quaternary Sciences, 2001,21 (6):514~519 |
| 7 | 田立德, 姚檀栋, 文 蓉等. 青藏高原西部纳木那尼冰芯同位素记录的气候意义初探. 第四纪研究, 2012, 32 (1):46~51 Tian Lide, Yao Tandong, Wen Rong et al. A primary recognition on the climatic significance of ice core isotope record in Naimona'Nyi of west Tibetan Plateau. Quaternary Sciences, 2012, 32 (1):46~51 |
| 8 | 赵华标, 徐柏青, 王宁练. 青藏高原冰芯稳定氧同位素记录的温度代用性研究. 第四纪研究, 2014,34 (6):1215~1226 Zhao Huabiao, Xu Baiqing, Wang Ninglian. Study on the water stable isotopes in Tibetan Plateau ice cores as a proxy of temperature. Quaternary Sciences, 2014,34 (6):1215~1226 |
| 9 | 谭 明, 侯居峙, 程 海. 定量重建气候历史的石笋年层方法. 第四纪研究, 2002,22 (3):209~219 Tan Ming, Hou Juzhi, Cheng Hai. Methodology of quantitatively reconstructing paleoclimate from annualy laminated stalagmites. Quaternary Sciences, 2002,22 (3):209~219 |
| 10 | 汪永进, 孔兴功, 邵晓华等. 末次盛冰期百年尺度气候变化的南京石笋记录. 第四纪研究, 2002,22 (3):243~251 Wang Yongjin, Kong Xinggong, Shao Xiaohua et al. Century-scale climatic oscillations during the last glacial maximum recorded in a stalagmite from Nanjing. Quaternary Sciences, 2002,22 (3):243~251 |
| 11 | Jones P D, Briffa K R, Barnett T P et al. High-resolution palaeoclimatic records for the last millennium:Interpretation, integration and comparison with General Circulation Model control-run temperatures. The Holocene, 1998,8 (4):455~471 |
| 12 | Mann M E, Bradley R S, Hughes M K. Global-scale temperature patterns and climate forcing over the past six centuries. Nature, 1998,392 (6678):779~787 |
| 13 | Mann M E, Bradley R S, Hughes M K. Northern Hemisphere temperatures during the past millennium:Inferences, uncertainties and limitations. Geophysical Research Letters, 1999,26 (6):759~762 |
| 14 | Moberg A, Sonechkin D M, Holmgren K et al. Highly variable Northern Hemisphere temperatures reconstructed from low-and high-resolution proxy data. Nature, 2005,433 (7026):613~617 |
| 15 | D'Arrigo R, Wilson R, Jacoby G. On the long-term context for late twentieth century warming. Journal of Geophysical Research:Atmospheres, 2006, 111 (D3):D03103 |
| 16 | Christiansen B, Ljungqvist F C. Reconstruction of the extratropical NH mean temperature over the last millennium with a method that preserves low-frequency variability. Journal of Climate, 2011,24 (23):6013~6034 |
| 17 | Christiansen B, Ljungqvist F C. The extra-tropical Northern Hemisphere temperature in the last two millennia:Reconstructions of low-frequency variability. Climate of the Past, 2012,8 (2):765~786 |
| 18 | Ljungqvist F C. A new reconstruction of temperature variability in the extra-tropical Northern Hemisphere during the last two millennia. Geografiska Annaler:Series A, Physical Geography, 2010,92 (3):339~351 |
| 19 | Mann M E, Zhang Z, Rutherford S et al. Global signatures and dynamical origins of the Little Ice Age and Medieval climate anomaly. Science, 2009,326 (5957):1256~1260 |
| 20 | 史 锋, 杨 保, 赵 森等. 全球过去千年典型暖期温度空间格局重建. 第四纪研究, 2014,34 (6):1125~1135 Shi Feng, Yang Bao, Zhao Sen et al. Spatial pattern reconstruction of typical centennial warm periods of global temperature over the past millennium. Quaternary Sciences, 2014,34 (6):1125~1135 |
| 21 | Ammann C, Wahl E. The importance of the geophysical context in statistical evaluations of climate reconstruction procedures. Climatic Change, 2007,85 (1~2):71~88 |
| 22 | Hegerl G C, Crowley T J, Hyde W T et al. Climate sensitivity constrained by temperature reconstructions over the past seven centuries. Nature, 2006,440 (7087):1029~1032 |
| 23 | Shi Feng, Yang Bao, Von Gunten L. Preliminary multiproxy surface air temperature field reconstruction for China over the past millennium. Science China:Earth Sciences, 2012,55 (12):2058~2067 |
| 24 | Seftigen K, Cook E R, Linderholm H W et al. The potential of deriving tree-ring-based field reconstructions of droughts and pluvials over Fennoscandia. Journal of Climate, 2015,28 (9):3453~3471 |
| 25 | Fang K, Gou X, Chen F et al. Large-scale precipitation variability over Northwest China inferred from tree rings. Journal of Climate, 2011,24 (13):3457~3468 |
| 26 | Fritts H C, Blasing T J, Hayden B P et al. Multivariate techniques for specifying tree-growth and climate relationships and for reconstructing anomalies in paleoclimate. Journal of Applied Meteorology, 1971,10 (5):845~864 |
| 27 | Fritts H C, Lofgren G R, Gordon G A. Variations in climate since 1602 as reconstructed from tree rings. Quaternary Research, 1979,12 (1):18~46 |
| 28 | Fritts H C, Lofgren G R, Gordon G A. Variations in climate since 1602 as reconstructed from tree rings. Quaternary Research, 1979,12 (1):18~46 |
| 29 | Luterbacher J, Dietrich D, Xoplaki E et al. European seasonal and annual temperature variability, trends, and extremes since 1500. Science, 2004,303 (5663):1499~1503 |
| 30 | Juckes M N, Allen M R, Briffa K R et al. Millennial temperature reconstruction intercomparison and evaluation. Climate of the Past, 2007,3 (4):591~609 |
| 31 | Esper J, Frank D C, Wilson R J S et al. Effect of scaling and regression on reconstructed temperature amplitude for the past millennium. Geophysical Research Letters, 2005, 32 (7):L07711 |
| 32 | Esper J, Frank D C, Wilson R J S et al. Effect of scaling and regression on reconstructed temperature amplitude for the past millennium. Geophysical Research Letters, 2005, 32 (7):L07711 |
| 33 | Riedwyl N, Küttel M, Luterbacher J et al. Comparison of climate field reconstruction techniques:Application to Europe. Climate Dynamics, 2009, 32 (2~3):381~395 |
| 34 | Mann M E, Rutherford S, Wahl E et al. Robustness of proxy-based climate field reconstruction methods. Journal of Geophysical Research:Atmospheres, 2007,112 (D12):D12109 |
| 35 | Rohde R, Muller R, Jacobsen R et al. Berkeley earth temperature averaging process. Geoinformatics & Geostatistics:An Overview, 2013,1 (2):1~13 |
| 36 | Schneider T. Analysis of incomplete climate data:Estimation of mean values and covariance matrices and imputation of missing values. Journal of Climate, 2001,14 (5):853~871 |
| 37 | Wu T, Yu R, Zhang F et al. The Beijing Climate Center atmospheric general circulation model:Description and its performance for the present-day climate. Climate Dynamics, 2010,34 (1):123~147 |
| 38 | Wu T, Yu R, Zhang F et al. The Beijing Climate Center atmospheric general circulation model:Description and its performance for the present-day climate. Climate Dynamics, 2010,34 (1):123~147 |
| 39 | Phipps S J, Rotstayn L D, Gordon H B et al. The CSIRO Mk3L climate system model version 1.0—Part 1:Description and evaluation. Geoscientific Model Development, 2011,4 (2):483~509 |
| 40 | Schurer AP, Hegerl GC, Mann ME et al. Separating forced from chaotic climate variability over the past millennium. Journal of Climate,, 2013,26 (18):6954~6973 |
| 41 | Jungclaus J H, Lorenz S J, Timmreck C et al. Climate and carbon-cycle variability over the last millennium. Climate of the Past,, 2010,6 (5):723~737 |
| 42 | 邵雪梅, 吴祥定. 利用树轮资料重建长白山区过去气候变化. 第四纪研究, 1997,(1):76~85 Shao Xuemei, Wu Xiangding. Reconstruction of climate change on Changbai Mountain, Northeast China using tree-ring data. Quaternary sciences,, 1997,(1):76~85 |
| 43 | Zhu H F, Fang X Q, Shao X M et al. Tree ring-based February-April temperature reconstruction for Changbai Mountain in Northeast China and its implication for East Asian winter monsoon. Climate of the Past,, 2009,5 (4):661~666 |
| 44 | Li Z S, Zhang Q B, Ma K. Tree-ring reconstruction of summer temperature for A.D. 1475~2003 in the central Hengduan Mountains, northwestern Yunnan, China. Climatic Change,, 2011,110 (1~2):455~467 |
| 45 | Xing P, Zhang Q B, Lv L X. Absence of late-summer warming trend over the past two and half centuries on the eastern Tibetan Plateau. Global and Planetary Change, 2014, 123 (2014):27~35 |
| 46 | Zhu Haifeng, Zheng Yonghong, Shao Xuemei et al. Millennial temperature reconstruction based on tree-ring widths of Qilian juniper from Wulan, Qinghai Province, China. Chinese Science Bulletin,, 2008,53 (24):3914~3920 |
| 47 | Zhu H F, Shao X M, Yin Z Y et al. August temperature variability in the southeastern Tibetan Plateau since AD 1385 inferred from tree rings. Palaeogeography, Palaeoclimatology, Palaeoecology,, 2011,305 (2011):84~92 |
| 48 | Neukom R, Luterbacher J, Villalba R et al. Multiproxy summer and winter surface air temperature field reconstructions for southern South America covering the past centuries. Climate Dynamics,, 2010,,37 (1~2):35~51 |
| 49 | Metropolis N. The beginning of the Monte Carlo method. Los Alamos Science,, 1987, Special Issue dedicated to Stanislaw Ulam:125~130 |
| 50 | Gao C, Robock A, Ammann C. Volcanic forcing of climate over the past 1500 years:An improved ice core-based index for climate models. Journal of Geophysical Research:Atmospheres,, 2008,113 (D23):D23111 |
| 51 | 51 Berdahl M, Robock A. Northern Hemispheric cryosphere response to volcanic eruptions in the Paleoclimate Modeling Intercomparison Project 3 last millennium simulations. Journal of Geophysical Research:Atmospheres, 2013, 118 (22):2013JD019914 |
| 52 | Timmreck C, Lorenz S J, Crowley T J et al. Limited temperature response to the very large AD 1258 volcanic eruption. Geophysical Research Letters,, 2009,36 (21):L21708 |
| 53 | Anchukaitis K J, Breitenmoser P, Briffa K R et al. Tree rings and volcanic cooling. Nature Geoscience,, 2012,5 (12):836~837 |
| 54 | D'Arrigo R, Wilson R, Anchukaitis K J. Volcanic cooling signal in tree ring temperature records for the past millennium. Journal of Geophysical Research:Atmospheres,, 2013,118 (16):9000~9010 |
| 55 | Mann M E, Fuentes J D, Rutherford S. Underestimation of volcanic cooling in tree-ring-based reconstructions of hemispheric temperatures. Nature Geoscience,, 2012,5 (3):202~205 |
| 56 | Mann M E, Rutherford S, Schurer A et al. Discrepancies between the modeled and proxy-reconstructed response to volcanic forcing over the past millennium:Implications and possible mechanisms. Journal of Geophysical Research:Atmospheres,, 2013,118 (14):7617~7627 |
④ National Climate Center, China Meteorological Administration, Beijing 100081)
Abstract
As the climate field reconstruction(CFR)data have been used for important dynamical insights and its utility and significance is widely recognized, more research on CFR methodologies is therefore urgently needed. In this paper, a new technique for climate field reconstruction was developed, i.e. Mode Approached Empirical Orthogonal Function(MA-EOF)method. This method allowed appropriate modes being preserved at different iteration steps, which utilized the intrinsic connections of EOFs, so that the reconstructed data over earlier times was approaching to the "true state" step by step.
We collected the tree-ring data mainly from the International Tree-Ring Data Bank(ITRDB)and PAGES 2k network, and screened them by the correlation coefficients with the observed annual temperature in their respective neighboring grids(exceeding the threshold values at 95% significance level). Finally, 549 temperature sensitive tree-ring chronologies were screened out, including 269 records from ITRDB, 267 from PAGES 2k network, 7 from China Meteorological Science Data Sharing Service Network and 6 from some published literatures related on regional temperature signal. The screened chronologies were divided into 17 groups according to their covered period and the starting year of the groups were set every 50 years from 1800A.D. to 1000A.D.The validation results verified the reliability of the reconstructions based on 1~12 group, and demonstrated the efficiency of the MA-EOF method particularly in reconstructing decadal variability of the instrumental data. Therefore, the gridded reconstructions of the first twelve groups were averaged as the final gridded reconstruction, i.e. we reconstructed the spatial pattern of the extratropical Northern Hemisphere(22.5°~90°N) temperature during the period 1250~1850A.D.based on the MA-EOF method.
In order to highlight the performance of different methods using for large-scale temperature spatial pattern reconstruction, we also utilized the existed method(Regularized Expectation Maximization, RegEM)based on the same tree-ring dataset to reconstruct another version of extratropical Northern Hemisphere temperature field. Compared with the RegEM-based reconstruction, the MA-EOF temperature field reconstruction showed that the spatial pattern of the cold anomaly in the Little Ice Age(1400~1700A.D.)was much more evident, being more close to the ensemble mean of the multi-model simulations. Additionally, we selected several typical years of volcanic eruptions with different intensity according to the value of total stratospheric sulfate aerosol injection, and compared the temperature spatial pattern of the MA-EOF reconstruction in these volcanic years. The results showed that obvious spatial differences of cooling were found in strong(i.e. 1452A.D., 1783A.D., and 1815A.D.), moderate(i.e.1600A.D., 1641A.D., and 1809A.D.)and relatively-weak(i.e.1584A.D., 1693A.D., and 1719A.D.)volcanic years. However, they also displayed a general characteristic, i.e. the high latitude region was more sensitive to the volcanic forcing than the middle and low latitudes, which was similar to the findings deduced from model simulations. The results above all demonstrated the efficiency of this new method and indicated a great application potential in climate field reconstruction.