 2014, Vol. 2
The article information
- Jun-Zheng Peng, Hang-Kong Ouyang, Quan Yu, Ying-Jie Yu, Ke-Sheng Wang
- Phase error correction for fringe projection profilometry by using constrained cubic spline
- Advances in Manufacturing, 2014, 2(1): 39-47
- http://dx.doi.org/10.1007/s40436-014-0058-1
-
Article history
- Received: 2014-01-02
- Accepted: 2014-01-27
- Published online: 2014-03-02


2. Department of Precision Mechanical Engineering, Shanghai University, Shanghai 200072, People’s Republic of China;
3. Department of Production and Quality Engineering, Norwegain University of Science and Technology, Trondheim, Norway;
4. Department of Precision Mechanical Engineering, Shanghai University, Shanghai 200072, People’s Republic of China;
5. Department of Production and Quality Engineering, Norwegain University of Science and Technology, Trondheim, Norway
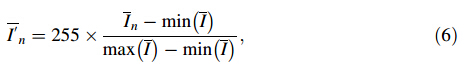
Phase measurement profilometry (PMP) is one of the most promising approaches because of the advantages of non-contact operation, full-field acquisition, high accuracy and fast data processing [1]. During the three-dimensional (3D) shape measurement, the depth map of the object surface is calculated from the phase distribution, which is extracted based on the captured fringe images. Therefore exactly retrieving the phase is important for guaranteeing measurement accuracy. However, due to the nonlinear intensity response of the electronic devices, such as the γ effect of a projector, the captured patterns are non-sinusoidal, and this will give rise to phase error. To overcome this problem, various techniques have been proposed and normally fallen into three categories.
The first solution is to directly compensate for the phase error. Zhang and Yau [2] proposed a generic phase error lookup-table (LUT) compensation scheme by directly analyzing the captured fringe image of a flat board. Pan et al. [3] proposed an iterative phase compensation algorithm to compensate for the non-sinusoidal phase error. Their methods are both based on the assumption that the phase error is independent of the pitch of the projected patterns. However, this assumption is only correct when the pitch is large enough. For measuring a complex object, multiple fringe patterns with different pitches are used in the phase unwrapping process, thus the phase errors cannot be corrected with the phase error of a specific pitch.
The second solution is called γ correction. Guo et al. [4] proposed a γ correction method by statistically analyzing the captured fringe images. Hoang et al. [5] and Liu et al. [6] developed algorithms to establish the relationship between the γ value and the correct phase value. However, the gamma value is estimated based on the projected patterns with specific pitch. Furthermore, a simple one-parameter γ function is unlikely to exactly model the full range of the nonlinear intensity response, which results in output fringe patterns with small amplitude and remarkably reduces its effectiveness.
In contrast to the aforementioned methods, another solution is to suppress the nonlinear input-output intensity response with a polynomial fitting technique [7]. The main drawback of this method is that it cannot be guaranteed to achieve a high accuracy even if a high-degree polynomial is used, because the Runge’s phenomenon may occur.
In this paper, we propose a method that neither depends on correcting the phase error from the fringe patterns with specific pitch nor corrects the full range of the nonlinear intensity response with one-parameter gamma function. Instead, a compensated curve is generated based on the input-output intensity response, and a constrained spline function is used to fit the compensated curve. With the proposed method, the compensated input gray-scale value can be accurately calculated, and the periodic errors owing to the nonlinear intensity response of the PMP system can be removed. 2 Principle
Figure. 1 illustrates the general response process from the input fringe pattern of the projector to the output distorted image captured by the camera. It is assumed that input fringe images generated by the computer have the intensity

 |
| Fig. 1 General response process of the PMP system |
After being projected by the projector, the output intensity of the fringe images becomes


Finally the distorted images are captured by the camera, and the output intensity of the captured images becomes

Combining Eqs. (2)–(4) and considering the nonlinear response of the whole PMP system, the response process can be summarized as

In practice, the discrete curve of the function ![]() can be
directly obtained by projecting a series of uniform patterns
onto a white board and imaging them. To eliminate the
interference of random noise, the output intensities of the
captured images are averaged to obtain the intensity
response curve of the measurement system, and the average
intensity of the pattern sequence is denoted by In, where
n = 0,1,…,255. To precisely obtain the intensity response
curves of the measurement system, the influence of ambient light and the reflectivity of the measured board should
be eliminated [8]. Here we normalize the output intensity
by
can be
directly obtained by projecting a series of uniform patterns
onto a white board and imaging them. To eliminate the
interference of random noise, the output intensities of the
captured images are averaged to obtain the intensity
response curve of the measurement system, and the average
intensity of the pattern sequence is denoted by In, where
n = 0,1,…,255. To precisely obtain the intensity response
curves of the measurement system, the influence of ambient light and the reflectivity of the measured board should
be eliminated [8]. Here we normalize the output intensity
by
Since the function of the intensity response curve is
usually monotonically increasing along the gray-scale axis,
there exists an inverse function ![]() corresponding to the
actual intensity response curve, which can be expressed as
corresponding to the
actual intensity response curve, which can be expressed as

It is noteworthy that the conventional method for calculating the inverse function is difficult to implement,
because the actual intensity response curve cannot be
exactly described with a specific mathematical expression.
On the other hand, as the derivatives of the inverse function
involve complicated differential computations, it will lead
to unstable results. According to characteristic of the
inverse function, the curve of inverse function ![]() can
be obtained by reflecting the curve of function
can
be obtained by reflecting the curve of function ![]() across the line y = x, which is equivalent to switching the
position of input and output.
across the line y = x, which is equivalent to switching the
position of input and output.
To obtain linear output, the compensated response curve should be fitted in advance. Although the global fitting technique with a high order polynomial can produce smooth curves, it is oscillating and overshooting at intermediate points. In contrast, the piecewise fitting with the constrained cubic spline can lead to stable and accurate results, because it combines the smooth characteristics of spline fitting with the non-overshooting behaviour of linear fitting [9].
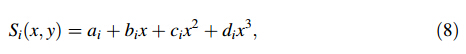
Suppose we have collected a set pairs of input-output intensity points (x0,y0), (x1,y1), …, (xi,yi), …, (xn-1,yn-1), (xn,yn), spline S(x) is used to give an approximation to a segment of the compensated curve. The ith segment of S(x) can be expressed as
 , and xi is the
intensity of the ith captured image.
, and xi is the
intensity of the ith captured image.
Here the constrained spline is constructed based on the following criteria:
(i) The fitting curve should pass through all known points, which means

(ii) The first order derivative must be continuous at intermediate points, which means

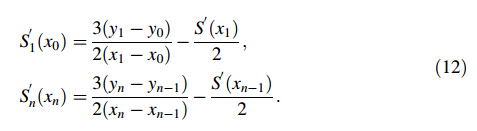
The key step becomes the calculation of the first derivative at each point. A relatively simple equation that works well and satisfies these requirements is

Equation (11) is only valid for intermediate points. The first derivative at the end point is calculated as belows:
Accordingly, the second order derivative can be calculated as follows:
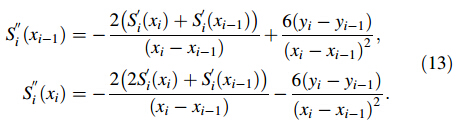
Based upon recursive rules, the coefficients of Eq. (8) can be calculated by the following formulae:

Since the coefficients can be calculated based on the two adjacent points, it is no longer necessary to solve the whole equations of the compensated curve. Therefore, the complexity of the constrained cubic spline is less than that of the polynomial method.
The phase error correction method proposed above can be summarized as follows:
(i) Project a series of uniform patterns onto a white board and capture the images to obtain the intensity response curve;
(ii) Reflect across the intensity response curve with line y = x to obtain the compensation curve for correcting the nonlinear intensity response;
(iii) Fit the compensation curve with restrained cubic spline by using Eqs. (8)–(14);
(iv) Once the coefficients of the cubic spline function have been calculated, the compensated input grayscale value can be calculated by substituting the ideal input gray-scale value into Eq. (8);
(v) Finally, a conventional three-step phase-shifting scheme can be used to extract phase with phase error removed. 3 Experiments and discussion
The performance of the proposed method was verified with a PMP system composed of digital projector (BenQ MP525ST with resolution of 1,024 × 768 pixels) and CCD camera (Sony XCG-U100E with resolution of 1,200 × 1,600 pixels). A flat board was put in front of the system. After projecting a series of uniform patterns onto the flat board and imaging them, the intensity response curve can be obtained, as shown in Fig. 2a. Then the compensation curve was generated with Eq. (7). For comparison, the polynomial method and the constrained cubic spline method were used to compensate for the nonlinear intensity response. The fitted curves are shown in Figs. 2b and 2c. We can see that the curve fitted with the polynomial method shows oscillation at the intermediate points. Whereas by using the constrained cubic spline method, the fitted curve passes all sample points. Once the function of the compensated curve is determined, it can be used to calculate the compensated input gray-scale value. Fig. 2d illustrates the intensity response curve after being compensated with two different methods. The results clearly show that there is an oscillation area in the intensity response curve when being compensated by the polynomial method. With this phenomenon, its effectiveness will be reduced remarkably. In contrast, the full range of the nonlinear intensity response can be significantly eliminated with the proposed method, which lays the basis for the PMP system to make the output fringe pattern with large amplitude.
 |
| Fig. 2 Intensity response curves (a before compensation; b comparison of compensation curve fitted with the polynomials method and the proposed method; c enlarge details of b; d comparison of intensity response curve compensated with the polynomials method and the proposed method) |
Some measurements are performed after the nonlinear compensation. Because we only focus on the phase error caused by the nonlinear intensity response, the effects of the measurement uncertainty (e.g., white noise) are handled by a Gaussian filter. With the current setup, a three-step phase-shifting scheme is used to acquire the measured phase. The fringe patterns before and after nonlinear intensity compensation are shown in Figs. 3a and 3b, respectively, and the intensity distributions along two lines AA' and BB' are shown in Figs. 3c and 3d. It can be seen that without nonlinear intensity correction, the intensity of the fringe pattern is obviously distorted, while an approximate sinusoidal fringe pattern can be obtained by correcting with the proposed method.
 |
| Fig. 3 Captured fringe patterns without and with nonlinear intensity correction (a without correction; b corrected with the proposed method; c intensity distribution along AA'; d intensity distribution along BB') |
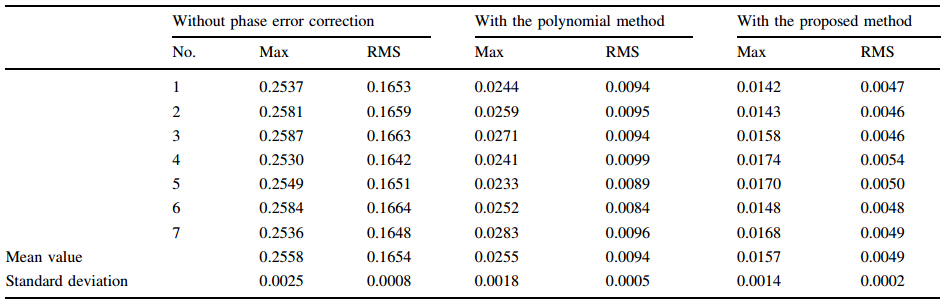
After the wrapped phases had been retrieved based on the captured fringe pattern images, the phase error of the flat board without and with nonlinear intensity correction is shown in Fig. 4a. Since the universal phase-shifting algorithm with large-step is proven to be very simple and effective for extracting correct phase value from the captured pattern images [5], here the 16-step phase-shifting scheme is used to acquire the correct phase distribution of the flat board. The pitch of the projected fringe pattern is 18 pixels. In order to check the repeatability of the presented method, seven measurements without changing the status of the PMP system have been successively executed. The quantitative comparison results of the flat board are listed in Table 1, where Max and RMS denote the maximal phase error and the root mean square in radians, respectively. It is shown that, before phase error compensation, the mean values of the Max and RMS are 0.2558 and 0.1654 rad, respectively. When compensated with the proposed method, the mean value of the Max and RMS are reduced to 0.0157 and 0.0049 rad, respectively. In addition, a more detailed comparison between the polynomial method and the proposed method is shown in Fig. 4b. Obvious improvements are observed in the result with the proposed method. Because the oscillation and overshooting at intermediate points can be avoided by constrained cubic spline algorithm, the calculated error caused by the fitting procedure will be reduced. Moreover, the relationship between the RMS of the phase error and the order of the polynomial is illustrated in Fig. 5. It can be seen that although the 15 order polynomial can lead to the minimum value, this is still larger than the result obtained by the proposed method. When the order is larger than 15, the phase error will be increased. The reason is that the Runge’s phenomenon may occur when being fitted with high order polynomial.
 |
| Fig. 4 a Central cross-section lines of the phase error of the flat board with and without nonlinear intensity correction and b comparison between the polynomial method and the proposed method |
 |
 |
| Fig. 5 Relationship between the order of the polynomial and the STD of the phase error |
With the constrained cubic spline fitting algorithm, an issue worth discussing is the amplitude of the output intensity. As indicated in the previous literature, the uncertainty of the measured phase is inversely proportional to the amplitude [10]. Thus, the small amplitude of the fringe pattern makes the phase more sensitive to the noise. As mentioned by Guo [4], the γ correction method cannot completely improve the full range of the nonlinear intensity response for the PMP system, thus the amplitude of the output fringe pattern is remarkably reduced. Nevertheless, the full range of the nonlinear intensity response can be completely compensated by the proposed method as described in Sec. 2, and the output fringe pattern with large amplitude can be acquired, as shown in Fig. 3d. It should be pointed out that, due to the influence of the environmental illumination, the minimum intensity of the captured pattern image is larger than 0.2. This can be avoided by isolating the PMP system from the environmental lighting. Therefore, the precision of the retrieved phase can be enhanced in the PMP system.
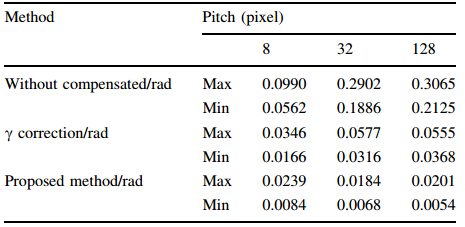
To measure a discontinuous surface or surfaces with step height more than p, multiple pitches phase-shifting algorithms are always used to recover the absolute phase. Because under the same lighting condition fringe patterns with large pitch are more vulnerable to the influence of noise or interference [11], fringe patterns with small pitch (e.g., 8 pixels) are still employed to acquire the phase with high accuracy. To study the relationship between the phase error and the pitch, we project three groups of phaseshifting patterns with pitches of 8, 32, 128 pixels onto the white flat board. The phase errors are shown in Fig. 6a. Table 2 summarizes the phase errors by projecting the fringe pattern with different pitches. We can see that the phase errors are nearly the same when the pitches are 32 and 128 pixels, and these results are consistent with the Zhang’s work [2]. However, when the pitch is 8 pixels, the phase error is clearly smaller than the others. From these experimental results, we can conclude that Zhang’s method may not work well when the pitch is small, and the phase errors of other pitches cannot be completely corrected using the phase error of specific pitch.
 |
| Fig. 6 Phase errors for multiple fringe pitches (a without nonlinear intensity correction; b corrected with single gamma correction; c corrected with the proposed method) |
The proposed method is a pure intensity response compensation method enabling to solve the problem just mentioned. We verify its validity via experimental results. Again, three groups of fringe patterns with pitches of 8, 32, 128 pixels are projected onto the white flat board, respectively. For comparison, we employ both the γ correction method [12] and the proposed method to correct the nonlinear intensity response. Table 3 lists the γ values calculated based upon the projected patterns with different pitches. It indicates that the calculation of γ value is related to the pitch of the projected pattern. The reason is that the γ values are estimated based on the wrapped phase with the specific pitch. Figure 6b shows the phase errors by pre-encoding γ value of 2.6144 onto the projected patterns, from which we can see that the maximal value of the phase error is reduced to 0.0346 rad when the pitch of the projected patterns is 8 pixels. However, when pre-encoding the γ value onto the other two sets of fringe patterns, obvious phase errors are observed owing to the single γ correction. In contrast, when the projected patterns are compensated with the proposed method, the phase errors are nearly the same, as shown in Fig. 6c. Table 2 summarizes the results from these representative cases. The experimental results clearly indicate that the proposed method is insensitive to the pitch of the projected patterns and thus gives accurate phase measurement results.

To further check the effects of the nonlinear intensity correction, an experiment is carried out to simultaneously measure the 3D shape of the multiple objects, as shown in Fig. 7a. For comparison, the projected fringe patterns are corrected with the polynomial method and the proposed method, respectively. The 3D shape measurement results are given in Figs. 7b and 7c. For convenience of comparison, the cross profiles of lines AA' are further plotted in Fig. 7d, where the curves are artificially separated for ease comparison. It can be seen that the 3D surface with the polynomial method still has ripple error. However, the 3D shape with the proposed method is much smoother and has better visual effects. These experimental results confirm that the proposed method can enhance the accuracy of the measurement of the PMP system.
 |
| Fig. 7 3D shape measurement of multiple models (a captured fringe image; b with the polynomial method; c with the proposed method; d section profile of line AA') |
However, there is certain limitation and restriction on above results. Since the proposed method is pure intensity compensation, it depends on the actual input-output response of the PMP system. Illumination of the environment influences the output intensity of the captured images. This means that the input-output intensity response curve will change. Figure 8 illustrates two intensity response curves, which are obtained under two different conditions of the environmental illumination. These two curves are not overlapping. Therefore, the nonlinear intensity response under condition 2 cannot be accurately corrected based on the intensity response curve under condition 1. In this instance, a new intensity curve should be acquired before generating and fitting the compensation intensity curve.
 |
| Fig. 8 Intensity response curves obtained under two different conditions of the environmental illuminance |
In this paper, we have presented a method to obtain the compensation curve of the input-output intensity response of the PMP system. Based on the compensation curve, we propose a restrained cubic spline approach to calculate the compensated input gray-scale value. With it, oscillation and overshooting are avoided during the fitting process. As a result, it can effectively remove the periodical phase error owing to the nonlinear intensity response that is characteristic of the PMP system. It has been demonstrated by experimental results that this method provides some advantages over others. It enables to correct the full range of nonlinear intensity response of the PMP system, thus making the amplitude of the projected pattern as large as possible. Since the proposed method is a purely nonlinear intensity response compensation operation, it is insensitive to the pitch of the project pattern.
Acknowledgements This work was supported by the National Natural Science Foundation of China (Grant No. 51175318), the National High Technology Research and Development Program of China (Grant No. 2012AA040507), and the Major National Science and Technology Project of China (Grant No.2013ZX04006011-217). Junzheng Peng is also thankful for the support of the China Scholarship Council to carry out research at Norwegian University of Science and Technology for one year.
| 1. | Gorthi SS, Rastogi P (2010) Fringe projection techniques: whither we are? Opt Lasers Eng 48:133–140 |
| 2. | Zhang S, Yau S-T (2007) Generic nonsinusoidal phase error correction for three-dimensional shape measurement using a digital video projector. Appl Opt 46:36–43 |
| 3. | Pan B, Kemao Q, Huang L et al (2009) Phase error analysis and compensation for nonsinusoidal waveforms in phase-shifting digital fringe projection profilometry. Opt Lett 34:416–418 |
| 4. | Guo H, He H, Chen M (2004) Gamma correction for digital fringe projection profilometry. Appl Opt 43:2906–2914 |
| 5. | Hoang T, Pan B, Nguyen D et al (2010) Generic gamma correction for accuracy enhancement in fringe-projection profilometry. Opt Lett 35:1992–1994 |
| 6. | Liu K, Wang Y, Lau DL et al (2010) Gamma model and its analysis for phase measuring profilometry. J Opt Soc Am A 27:553–562 |
| 7. | Huang PS, Zhang C, Chiang F-P (2003) High-speed 3-D shape measurement based on digital fringe projection. Opt Eng 42: 163–168 |
| 8. | Zuo C, Chen Q, Gu G et al (2013) High-speed three-dimensional shape measurement for dynamic scenes using bi-frequency tripolar pulse-width-modulation fringe projection. Opt Lasers Eng 51:953–960 |
| 9. | Kokes J, Nghien NB (2011) Using constrained cubic spline instead of natural cubic spline to eliminate overshoot and undershoot in HTT. Ann Fac Eng Hunedoara-Int J Eng 9:23–28 |
| 10. | Zhang X, Zhu L, Li Y et al (2012) Generic nonsinusoidal fringe model and gamma calibration in phase measuring profilometry. J Opt Soc Am A 29:1047–1058 |
| 11. | Zhang S (2009) Phase unwrapping error reduction framework for a multiple-wavelength phase-shifting algorithm. Opt Eng 48: 105601–105601-8 |
| 12. | Li Z, Li Y (2011) Gamma-distorted fringe image modeling and accurate gamma correction for fast phase measuring profilometry. Opt Lett 36:154–156 |