 2013, Vol. 1
The article information
- Satyanarayana Kosaraju, Venu Gopal Anne
- Optimal machining conditions for turning Ti-6Al-4V using response surface methodology
- Advances in Manufacturing, 2013, 1(4): 329-339
- http://dx.doi.org/10.1007/s40436-013-0047-9
-
Article history
- Received: 2013-07-24
- Accepted: 2013-11-05
- Published online: 2013-11-30


Venu Gopal Anne, E-mail: venu@nitw.ac.in
Application of titanium alloys has increased in aerospace, marine and automobile industries because of their light weight, good fatigue strength and corrosion-resistance properties. The specific weight of titanium is about two thirds that of steel and about 60% higher than that of aluminum. However, titanium’s strength is far greater than that of many alloy steels, and it has the highest strength-toweight ratio when compared to any of structural metals nowadays. Ti-6Al-4V is one of the most widely used titanium alloys, which is an alpha-beta type containing 6 wt% aluminum and 4 wt% vanadium [1]. Machining titanium and titanium alloys would always be a problem, no matter what techniques are employed to transform this metal into chips, as reported in Refs. [1, 2]. The machining technique of titanium alloys is hindered basically due to their low thermal conductivity and high chemical reactivity. Due to the low thermal conductivity of titanium, heat generated by the cutting action cannot dissipate quickly. Therefore, most of heat is concentrated on the cutting edge and the tool face, which will adversely affect the life of the cutting tool. The chemical reactivity of titanium alloys with different tool materials and their consequent welding by adhesion onto the cutting tool during machining lead to excessive chipping and/or premature tool failure and poor surface finish [3]. Additionally, high strength is maintained at elevated temperature and low modulus of elasticity further impairs machinability [4].
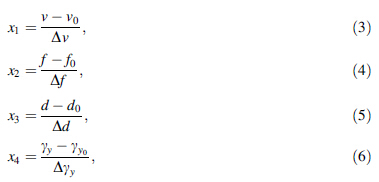
In order to enhance the product quality and machining efficiency, there has been increasing focus on improvement of Ra. A good surface finish can lead to improvement in strength properties, such as fatigue strength, corrosion resistance, and thermal resistance [5]. In order to develop a model, it is necessary to design and carry out an experiment involving work material and cutting tool. The experimental work provides the response data as a function of speed (υ), feed (ƒ), depth of cut (d) and back rake angle (γy). According to Ernst [6], the term "machinability" means a complex physical property of metal. Design of experiment methods such as factorial design, response surface methodology (RSM), and Taguchi methods is now widely used in industries to reduce the cost and time of machining.
In machinability studies, statistical design of experiments is used quite extensively. Statistical design of experiments refers to the process of planning the experiments so that the appropriate data can be analyzed by statistical methods, resulting in valid and objective conclusions [7]. Thiele and Melkote [8] used four-factor and two-level fractional factorial design to find out the effects of cutting edge geometry, workpiece hardness, ƒ, and υ on surface roughness (Ra) and resultant forces in the hard finish turning of AISI H13 steel. Neseli et al [9] investigated the influence of tool geometry on surface finish using RSM and indicated that nose radius contributed much to Ra. Masounave et al. [10] used a full factorial design involving six factors to investigate the effects of cutting and tool parameters on the resulting Ra and built up edge formation in the dry turning of carbon steel. Makadia and Nanavati [11] studied the effects of turning parameters and nose radius on Ra using Taguchi’s technique and the effects of those chosen parameters were investigated using RSM. Choudhury and El-Baradie [12] used RSM and 23 factorial designs to estimate the Ra during the turning process of high strength steel. Fnides et al [13] developed a statistical model using RSM for cutting force during hard turning of AISI H11 steel by mixed ceramic tool and concluded that d was the dominant factor that affected the tangential force (Fz). Saint et al [14] developed a model to predict Ra and tool wear in finish hard turning and found that with lower f and higher υ a significant increase in surface quality was achieved using RSM-Box behnken method. Mandal et al [15] investigated the effects of cutting parameters on machining forces using RSM during finish hard turning of AISI 4340 steel with ZTA inserted and obtained 76.51% desirability level. Tsourveloudis [16] used RSM and fuzzy logic system through the adaptive neuro-fuzzy inference system (ANFIS) for Ti6Al4V titanium alloy. The f had been verified as the most important parameter for the surface of Ti-6Al-4V. The two factor interaction (2FI) model was the only successful one among the polynomial models that had been employed to predict Ra of Ti-6Al-4V turning. Ramesh et al [17] used RSM for machining titanium alloy with CVD coated carbide inserts and developed a 2FI Ra model in terms of cutting parameters, such as υ, ƒ, and d. The results indicated that f was the main influencing factor on Ra. Ra increased with f and d, but decreased with the increase in υ.
From mentioned literatures, it is very clear that statistical technique such as RSM is effective for investigating the machinability of various metals and alloys. However, there is very little mention of RSM used for optimization of machining parameters using TiAlN coated carbide tool insert for machining titanium alloy (Ti-6Al-4V) using factor, γy. In the present work, machining parameters such as υ, ƒ, d, and γy are considered independent variables. Based on the preliminary experiments, the effects of these machining parameters on Ra and Fz have been investigated through the set of planned experiments based on the four factors at three levels. The RSM uses face centered, central composite design (CCD) of experiments to explore the responses and construct the model. 2 RSM
The experiments were conducted to find the optimal results, under which a certain process attains, i.e., optimum could be either a maximum or a minimum of a function with the design parameters. One of methodologies for obtaining the optimum values is RSM. RSM is a combination of mathematical theory and statistical techniques, and useful for modeling and analyzing problems in which a response of interest is influenced by several variables and the objective is to optimize this response. RSM also quantifies the relationship between the controllable input parameters and the obtained response surfaces.
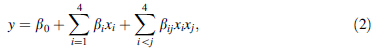
The Design Expert® software (Stat-Ease Inc., USA) version 8.0.7.1 was used to develop the experimental plan for RSM. The software was also used to analyze data collected from experimentation. The RSM was employed for modeling and analyzing machining parameters in dry turning process in order to obtain the machinability performances of Ra and FZ. In RSM, the relationship between desired response and independent input variables can be represented in the following equation:

The objective of the experiments is to establish the relationship between the machining parameters and the machinability performance, including Fz and Ra. The turning experiments were carried out in order to obtain experimental data under dry machining conditions on a MAGNUM precision lathe machine which is a high precision grade 1 accuracy lathe. The experimental setup is shown in Fig. 1. The cutting forces generated during machining trials were measured using piezoelectric tool post dynamometer (Kistler, 9272). The force signals generated during machining were fed into a charge amplifier (Kistler, 5070) connected to the dynamometer. This amplifier converted the analogue signal to digital signal that was continuously recorded by the data acquisition system connected to the charge amplifier. The average Ra obtained on workpiece after first pass of machining with each tool, was measured with a portable Ra tester (Handy Surf, E-35) with a cut off length of 0.8 mm.
 |
| Fig. 1 Experimental set-up |
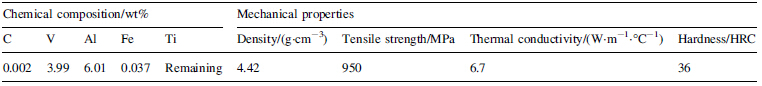
The work material used for conducting the experiments was titanium alloy (Ti-6Al-4V) in the form of round bars with 65 mm diameter and 200 mm cutting length. The chemical composition and mechanical properties of the workpiece material are listed in Table 1.
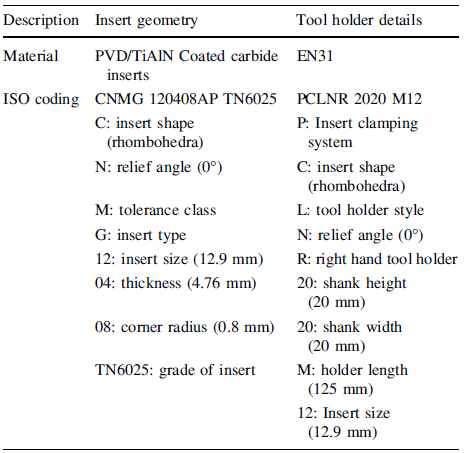
Coated carbide is the most common tool material, and the coated carbide tools are employed in the machining of titanium alloys due to their improved performance in terms of tool wear relative to others. PVD/TiAlN coated carbide inserts with the ISO designation CNMG 120408AP TN6025 along with the tool holder PCLNR 2020 M12 was used. The geometry details are shown in Table 2.
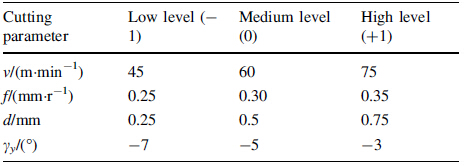
The aimof experimental design was to reduce the test activity and maximize the result quality. In the present work, the experimental data were collected by the face centered, CCD technique. The factorial portion of the CCD is a full factorial design with all combinations of factors at two levels (low -1 and high + 1) and composed of eight star points, six central points (coded levels 0), between the high and low levels is the midpoint. The star points at face of the cubic portion on the design corresponding to a value of 1. This type of design is commonly called face centered. Table 3 shows the four machining parameters at three levels with their ranges.
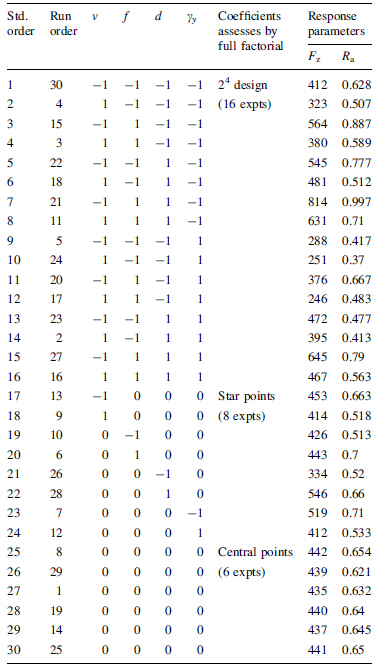
The design matrix (coded values) and results from the experimental plan of Ra and Fz are shown in Table 4.
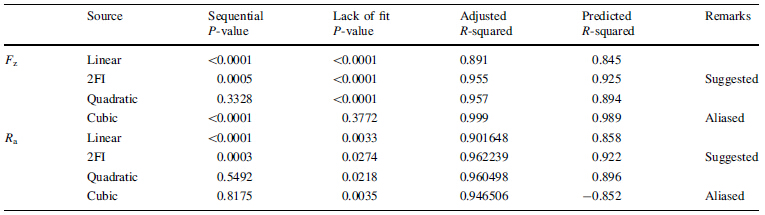
From Table 5 it is clear that 2FI model is suggested with face-centered CCD for both Fz and Ra. Therefore, the test for significance of the regression model, individual model coefficients, and the test for lack-of-fit was performed to verify the goodness-of-fit for the obtained 2FI model. The analysis of variance (ANOVA) was applied to summarize the above mentioned performing tests. Without performing any transformation on the response, examination of the fit and summary output revealed that the 2FI model was statistically significant for both responses, and therefore it was used in further analysis.
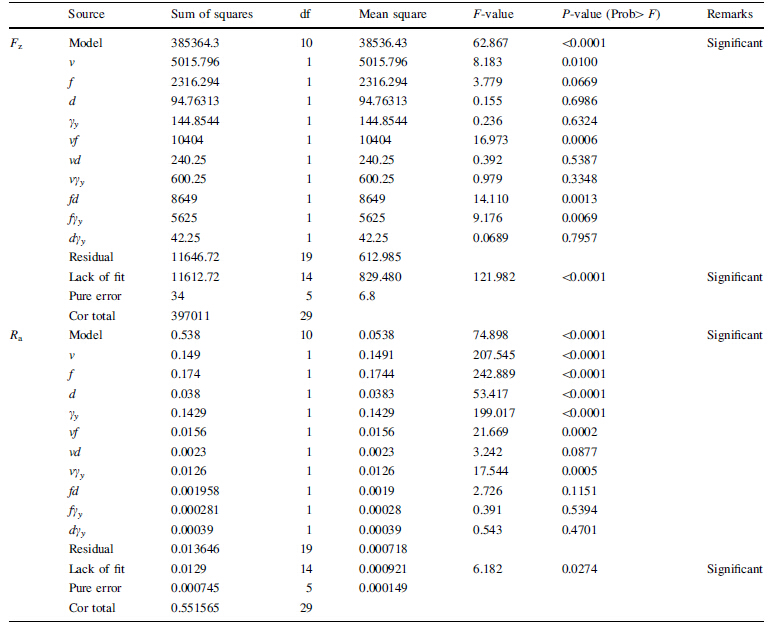
In the ANOVA analysis the test for significance in individual model coefficients, and test for lack-of-fit was necessary. Table 6 shows the ANOVA data for response surface 2FI model for Fz and Ra. By selecting the backward elimination procedure to automatically reduce the terms that are not significant. The ANOVA table for the reduced 2FI model for Fz and Ra is shown in Table 7, which indicates that the model is significant in both cases, and the terms in the model have a significant effect on the response. It can also be observed from Table 7 that the multiple correlation R2 is estimated for Fz is 0.9684 and Ra is 0.970 from the estimated values of Fz and Ra with the model developed using the process parameters. This means that 96.84% of Fz and 97% of Ra explained uniquely or jointly by the independent variables and hence the model developed is fairly strong enough to be used in predicting Fz and Ra. There is little difference between the predicted and actual results. Furthermore, the value of adequate precision in the model, which compares with the range of value at the design point to the average prediction error, should be well above 4.
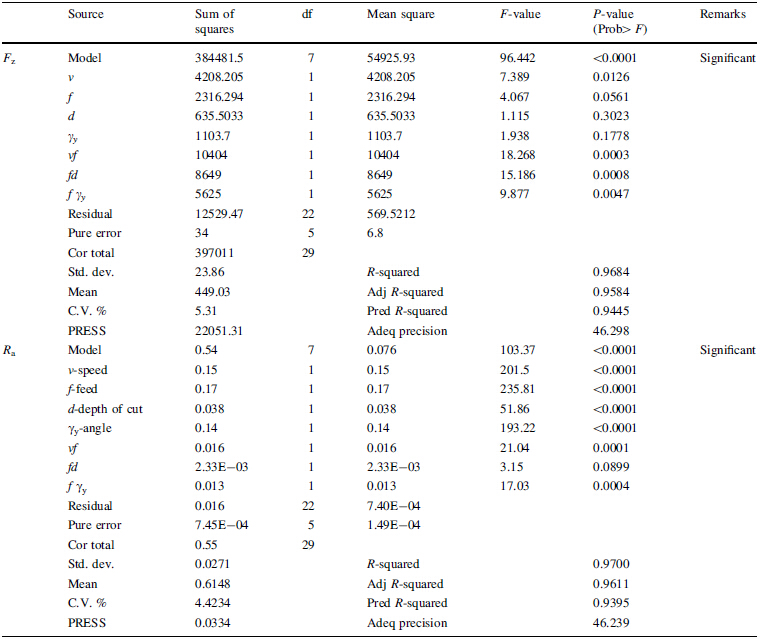
The 2FI model for Fz and Ra in terms of actual factors is shown as follows:

After 2FI models of Fz and Ra were established, the model adequacy checking was performed in order to verify that the underlying assumption of regression analysis is not violated. Figures 2 and 3 illustrate the normal probability plots of the residual, which show no sign of the violation since each point follows a straight line pattern implying that the errors are distributed normally.
 |
| Fig. 2 Normal probability plot of residuals for Fz |
 |
| Fig. 3 Normal probability plot of residuals for Ra |
Three-dimensional response surfaces plots are shown in Figs. 4-9 to investigate the influences of machining parameters on Fz and Ra. Figures 4-6 present the influences of machining parameters on Fz of the machined part, such as f and υ, γy and ƒ, d and ƒ, respectively. Also, Figs. 7-9 present the influences of machining parameters, such as υ and γy, υ and d, υ and ƒ, respectively, on Fz of the machined part.
From the Figs. 4-6, it could be seen that Fz increases with d, f and decreases with increase in υ and γy. This is because at larger feeds or depths of cut, larger volume of the deformed metal and consequently is the resistance of the material to chip formation is greater leading to an increase in Fz. A decreasing trend in was observed with increase in υ because as υ increases chips are thinner and shear angle is bigger. Thus, the decreasing trend in chip reduction coefficient and chip strains means that plastic deformation of metal takes place with less strain because of smaller shear angles. This leads to decrease in power consumption as well. A decreasing trend in Fz was also observed with an increase in γy due to the decrease in toolchip contact area.
 |
| Fig. 4 Response surface plot of Fz according to f and v |
 |
| Fig. 5 Response surface plot of Fz according to γy and f |
 |
| Fig. 6 Response surface plot of Ra according to f and d |
From Figs. 7-9, it could be observed that Ra decreases with increase in υ and cy, and increases with d and f. This established behavior can be explained by observing the variation of maximum chip thickness with the turning parameters. Increase in d or f causes the maximum chip thickness to increase, thereby formation of larger uncut ridge results in the formation of poor surface finish. The surface finish has been observed to increase with cutting υ due to increased temperature at high speeds. Low cutting speeds resulting in the formation of an increase in the height of uncut ridge lead to poor surface finish when compared to higher speeds. The γy increases and Fz decreases, which will lead to decrease in Ra.
 |
| Fig. 7 Response surface plot of Ra according to υ and γy |
 |
| Fig. 8 Response surface plot of Ra according to υ and d |
 |
| Fig. 9 Response surface plot of Ra according to υ and f |
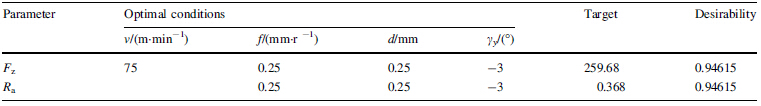
One of the most important aims of the experiments related to manufacturing is to obtain cutting parameters corresponding to minimum Fz and Ra. RSM is an ideal technique for the determination of the best cutting parameters in turning operation [18]. RSM optimization results for Ra and Fz are shown in Fig. 10 and Table 8. Optimum cutting parameters are 75 m/min, 0.25 mm/r, 0.25 mm and -3°. The optimized Ra and Fz are 0.3679 μ and 259.682 N.
 |
| Fig. 10 Response optimization for force and Ra parameters |
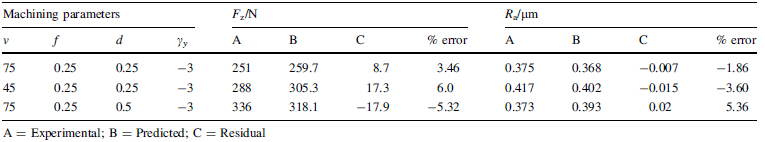
For the confirmation of 2FI model, three confirmation experiments are performed for Fz and Ra in order to verify the adequacy of obtained 2FI model. Using the point prediction capability of the software, Fz and Ra of the selected experiments were predicted together with the prediction interval of 95%. The predicted value and actual experimental value were compared, and the residual and percentage error were calculated. The results of the confirmation test and their comparisons with the predicted values for Fz and Ra are listed in Table 9. The results in Table 9 show that both the residual and percentage error are small. The percentage error range between the actual and predicted value of Fz lies between 2.5% and 6%, and Ra lies in the range of 1.86% to 5.36%. All the experimental values of confirmation test are within the 95% prediction interval.
In the present work, the 2FI models for Fz and Ra have been developed to investigate the influences of machining parameters in turning of titanium (Ti-6Al-4V) alloy. The experimental plan is based on face centered, CCD. The effects of machining parameters such as cutting υ, ƒ, d and cy, have been evaluated by using RSM. The following conclusions are drawn based on this study:
(i) The results show that the optimal combination of machining parameters are 75 m/min, 0.25 r/min, 0.25 mm and -3° for cutting υ, ƒ, d and cy, respectively.
(ii) Fz increases with d and ƒ, this is because of the fact that at larger feeds or depths of cut, larger volume of the deformed metal and consequently the resistance of the material to chip formation is greater.
(iii) Fz decreases with increase in υ and cy, this is because as υ increases, chips are thinner and shear angle increases and increase in rake angle leads to decrease in tool-chip contact area.
(iv) Increase in d or f causes the maximum chip thickness to increase, thereby formation of larger uncut ridge results in the formation of poor surface finish.
(v) The surface finish has been observed to increase with υ because of the increased temperature at high speeds. The negative rake angles also cause larger contact area resulting in higher chip volume, which both result in increased heat generation leading to decrease in Ra.
(vi) 2FI models developed using RSM are reasonably accurate and can be used for prediction within the limits of the investigated factors.
(vii) The results of ANOVA have proved that the 2FI models can complete prediction of Fz and Ra with 97% confidence interval.
(viii) Verification of the experiments carried out shows that the empirical models developed can be used for turning of Ti-6Al-4V with coated carbides within 5.36% error against an error of 6% when machined with CVD tools.
Therefore, the approach presented experimentally and statistically in this study can be considered as a proper method for the optimization of turning process.
| 1. | Donachie MJ Jr, ASM International (2000) Titanium: a technical guide, 2nd edn. Material Information Society, Materials Park, pp 79-84 |
| 2. | Ezugwu EO, Wang ZM (1997) Titanium alloys and their machinability-a review. J Mater Process Technol 68(3): 262-274 |
| 3. | Komanduri R, Von Turkovich BF (1981) New observations on the mechanism of chip formation when machining titanium alloys. Wear 69(2):179-188 |
| 4. | Hong HATJM, Riga AT, Gahoon JM, Scott CG (1993) Machinability of steels and titanium alloys under lubrication. Wear 162:34-39 |
| 5. | Kramer BM, Hartung PD (1981) Theoretical considerations in the machining of nickel-based alloys. In: Cutting Tool Materials. ASM, Materials Park, Ohio, pp 57-74 |
| 6. | Noordin MY, Venkatesh VC, Sharif S, Elting S, Abdullah A (2004) Application of response surface methodology in describing the performance of coated carbide tools when turning AISI 1045 steel. J Mater Process Technol 145(1):46-58 |
| 7. | Montgomery DC (1997) Design and analysis of experiments, 4th edn. Wiley, New York |
| 8. | Thiele JD, Melkote S (1999) Effect of cutting edge geometry and workpiece hardness on surface generation in the finish hard turning of AISI 52100 steel. J Mater Process Technol 94(2): 216-226 |
| 9. | Nesşeli S, Yaldlz S, Türkesş E (2011) Optimization of tool geometry parameters for turning operations based on the response surface methodology. Measurement 44(3):580-587 |
| 10. | Masounave J, Youssef YA, Beauchamp Y, Thomas M (1997) An experimental design for surface roughness and built-up edge formation in lathe dry turning. Int J Qual Sci 2(3):167-180 |
| 11. | Makadia AJ, Nanavati JI (2013) Optimization of machining parameters for turning operations based on response surface methodology. Measurement 46(6):1521-1529 |
| 12. | Choudhury IA, El-Baradie MA (1997) Surface roughness prediction in the turning of high-strength steel by factorial design of experiments. J Mater Process Technol 67(1):55-61 |
| 13. | Fnides B, Yallese MA, Mabrouki T, Rigal JF (2011) Application of response surface methodology for determining cutting force model in turning hardened AISI H11 hot work tool steel. Sadhana 36(1):109-123 |
| 14. | Saini S, Ahuja IS, Sharma VS (2012) Influence of cutting parameters on tool wear and surface roughness in hard turning of AISI H11 tool steel using ceramic tools. Int J Precis Eng Manuf 13(8):1295-1302 |
| 15. | Mandal N, Doloi B, Mondal B (2012) Force prediction model of zirconia toughened alumina (ZTA) inserts in hard turning of AISI 4340 steel using response surface methodology. Int J Precis Eng Manuf 13(9):1589-1599 |
| 16. | Tsourveloudis NC (2010) Predictive modelling of the Ti6Al4V alloy surface roughness. J Intell Robot Syst 60(3-4):513-530 |
| 17. | Ramesh S, Karunamoorthy L, Palanikumar K (2008) Surface roughness analysis in machining of titanium alloy. Mater Manuf Process 23(2):174-181 |
| 18. | Makadia AJ, Nanavati JI (2013) Optimization of machining parameters for turning operations based on response surface methodology. Measurement 46(1):1521-1529 |