 2013, Vol. 1
The article information
- Pei-You Li, Gang Wang, Ding Ding, Jun Shen
- Determination of accurate theoretical values for thermodynamic properties in bulk metallic glasses
- Advances in Manufacturing, 2013, 1(4): 293-304
- http://dx.doi.org/10.1007/s40436-013-0040-3
-
Article history
- Received: 2013-07-15
- Accepted: 2013-09-23
- Published online: 2013-10-31


Gang Wang, E-mail: g.wang@shu.edu.cn
2. Laboratory for Microstructures, Shanghai University, Shanghai 200444, People's Republic of China
Due to the presence of a large supercooled liquid region, bulk metallic glasses (BMGs) usually exhibit high thermal stability against crystallization. As a result, a large range of experimental time and temperatures for nucleation and crystalline growth processes exist in metallic glass forming melts. Characterization of the three thermodynamic parameters including Gibbs free energy difference ΔG, entropy difference ΔS; and enthalpy difference ΔH; are important in evaluation of nucleation and crystal growth processes in BMGs between the supercooled liquid and corresponding crystalline phases [1, 2]. Nucleation rates have been shown to have an exponential dependence on ΔG [3], acting as a driving force of nucleation. When ΔG is small, the critical nucleation work is improved, and nucleation rates are reduced [4]. As a result, the glass forming ability (GFA) of these materials is improved. The values of ΔG; ΔS; and ΔH are routinely calculated by measuring changes in the specific heat difference, ΔCp, between the supercooled liquid and corresponding crystalline phases across a range of temperatures.
The metastable nature of supercooled liquids, however, makes accurate experimental values for ΔCp difficult to determine [5]. Thus, most ΔCp values for the supercooled liquid regions of various BMGs are only rough approximations generated by fitting limited experimental data to the melting temperature, Tm, in the vicinity of the glass transition temperature Tg. Because the accurate specific heat data in the supercooled region are notably absent, the functional dependences of ΔG; ΔS; and ΔH on temperature are generally estimated theoretically [5]. Several models for calculating ΔG; ΔS; and ΔH values have been previously proposed based on different expressions for ΔCp [6, 7, 8, 9, 10, 11, 12, 13, 14]. In these expressions, Thompson et al. [12] and Hoffman et al. [13] assumed that ΔCp was constant with temperature. Whereas Mondal et al. [10] and Patel et al. [11] suggested that ΔCp value depended lineaσly or hyperbolically on temperature, respectively. Each of these expressions, however, is deduced strictly from experimental data [6, 10, 11, 12, 13, 14] without theoretical support.
Recently, Dubey et al. [7, 8] proposed a theoretical expression for ΔCp based on the hole theory of the liquid state, thus calculating more accurate values for ΔG, ΔH, and ΔS from experimental results collected among the temperature range from Tg to Tm in the Zr57Cu15.4Ni12.6Al10Nb5 BMG [8]. Furthermore, a hyperbolic expression for ΔCp was deduced that provided an optimal mathematical model for elucidating GFA based on the theoretical expression for ΔCp proposed by Dubey et al. [7, 8]. According to the hyperbolic expression for ΔCp based on the hole theory of the liquid state [15], the current study further deduced a linear expression for ΔCp. The values of ΔG; ΔH; ΔS and for BMGs in the temperature range from Tg to Tm were calculated based on the hyperbolic, linear, and Dubey's expression for ΔCp. Sixteen BMG materials [16, 17, 18, 19, 20, 21, 22, 23, 24, 25, 26] were selected as models for using in experimental evaluation of the accuracy of these 3 expressions for ΔCp (Dubey's, hyperbolic, linear). The deviations observed in thermodynamic parameters between experimental results and these three models [7, 8, 15] were comparatively evaluated. 2 Expressions for the thermodynamic parameters ΔCp, ΔG, ΔS, and ΔH
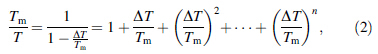
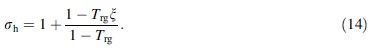
Since ΔG is vital to the study of GFA in BMGs, expressions for ΔCp used in the calculation of ΔG values are important. The authors [15] previously proposed a hyperbolic expression for ΔCp based on the hole theory of the liquid state [7, 8], shown as follows:


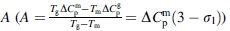 and B
and B 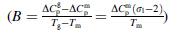 are the coefficients for linear
expression, proposed by Patel et al. [11]. Evaluation of the
parameter σl also results in a method similar to that
proposed by Dubey et al. [7, 8]. Since experimental values
of ΔCpg are usually measured in the vicinity of Tg, the ΔCpm
value can be employed in conjunction with Eq. (3) to yield
are the coefficients for linear
expression, proposed by Patel et al. [11]. Evaluation of the
parameter σl also results in a method similar to that
proposed by Dubey et al. [7, 8]. Since experimental values
of ΔCpg are usually measured in the vicinity of Tg, the ΔCpm
value can be employed in conjunction with Eq. (3) to yield
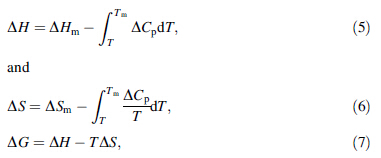
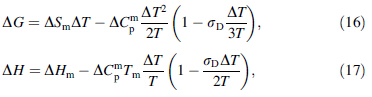
ΔG; ΔH and ΔS are the differential values between the supercooled liquid and the corresponding crystalline phase, which can be expressed as
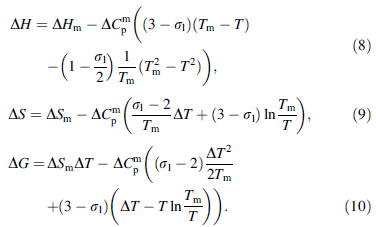
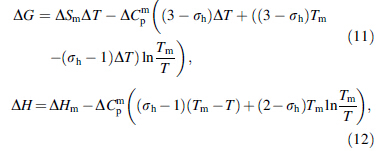
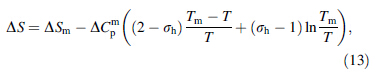
Comparative studies were conducted on the expressions for ΔG, ΔS, and ΔH produced by the hyperbolic expression and Dubey's expression for ΔCp using the framework of the hole theory of the liquid state as a basis. This technique allowed for further characterization of the thermodynamic behaviors of BMGs. Based on the hyperbolic expression for ΔCp, the expressions for ΔG, ΔS, and ΔH, respectively, are [15]
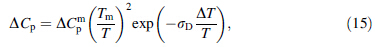
Based on the hole theory of the liquid state, Dubey et al. [7, 8] provided an expression for the ΔCp as

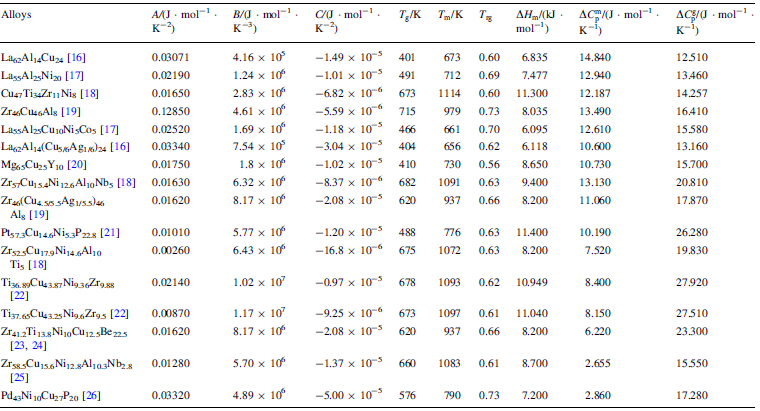
and experimental values of ΔCp in BMGs The thermodynamic behavior of BMGs is studied using expressions for thermodynamic parameters ΔCp, ΔG; ΔS; ΔH; based on experimental results from 16 different BMGs. The values of ΔG, ΔS, and ΔH are calculated using experimentally measured ΔCp values, which can be expressed as [16, 17, 18, 19, 20, 21, 22, 23, 24, 25, 26]

Figures 1 and 2 show experimentally fitted ΔCp values and calculated values deduced from the hyperbolic, Dubey's, and linear expressions. Initially, the deviations in ΔCp for these 4 BMGs increased, followed by an immediate reduction with further temperature increased from Tg to Tm. The deviations in ΔCp achieved a maximum deviation value, Dmax.; at an uncertain temperature in the range of Tg and Tm. Notably, this value was achieved approximately at the midpoint between Tg and Tm in each sample. For Zr46Cu46Al8 and La55Al25Cu25Ni5Co5, the Dmax. values of ΔCp, Dmax - ΔCp, from hyperbolic, linear, and Dubey's expressions were each smaller than 4 %, indicating that calculated values of ΔCp closely approximated experimental values, as compared with the Dmax - ΔCp values for Ti36.89Cu43.87Ni9.36Zr9.88 and Pd43Ni10Cu27P20 BMGs (see Fig. 2).
 |
| Fig. 1 Specific heat difference ΔCp a, b, and the deviation values of D - ΔCp c, d as functions of temperature derived for 2 of 16 representative BMGs, Zr46Cu46Al8 and La55Al25Cu25Ni5Co5 alloys |
 |
| Fig. 2 Specific heat difference ΔCp a, b, and the deviation values of D - ΔCp c, d as functions of temperature derived for 2 of 16 representative BMGs, Ti36.89Cu43.87Ni9.36Zr9.88 and Pd43Ni10Cu27P20 alloys |
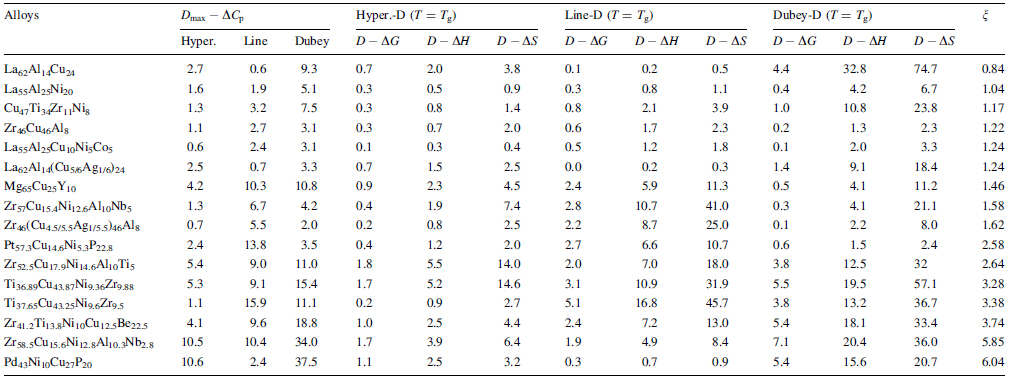
A comparison of the calculated and experimental values of ΔCp in BMGs is provided by the Dmax - ΔCp values for 16 BMGs (see Table 2). The relationship between Dmax - ΔCp values and ζ values for the 16 alloys is summarized in Fig. 3. In addition, Dmax - ΔCp values derived from the linear expression demonstrated a maximum value of 16 % of the initial value, and the values derived from Dubey's expression increased with increasing ζ value for ζ > 2. Notably, the maximum value of Dubey's expression approached 38 % of the initial value for a ζ value of 6. For the hyperbolic expression, Dmax - ΔCp values were generally less than 11 % of the initial values. Cumulatively, these findings indicated that the hyperbolic expression for ΔCp fitted well with the experimental values compared with both linear and Dubey's expressions. When ζ < 2, the Dmax - ΔCp derived from all 3 expressions was smaller than 11 % of the initial value, suggesting that all 3 theoretical models were applicable.
 |
 |
| Fig. 3 Relationships between the maximal deviation values Dmax. - ΔCp (the maximum deviation of ΔCp between the calculated and experimental values), and the ζ values for the 16 alloys in Table 2 |
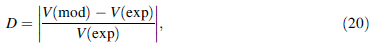
values of ΔG, ΔS, and ΔH in BMGs The deviation values D of parameters ΔG; ΔS; ΔH; D - ΔG; D - ΔS; and D - ΔH; respectively, between calculated and experimental values for 4 BMGs were determined. As shown in Figs. 4-7, the values of D - ΔG; D - ΔH; and D - ΔS exhibited maximum deviations at Tg in the temperature range from Tg to Tm. A notable exception to this trend was the deviation value of ΔG from Dubey's expression for ΔCp for Zr46Cu46Al8 (see Fig. 4d) and Mg65Cu25Y10 (not shown). Thus, deviation values for ΔG; ΔS; and ΔH at Tg could reasonably denote the degree of fit between ΔG; ΔS; and ΔH values in both calculated expressions and experimental results. D - ΔG; D - ΔH; and D - ΔS values at Tg for all 16 metallic glasses are listed in Table 2.
The D - ΔG; D - ΔH; and D - ΔS values at Tg and n values for 16 BMGs are listed in Table 2. The maximum D - ΔG values were achieved in the hyperbolic expression, whereas Dubey's and linear expression values for ΔCp were smaller than 8 % of initial values, indicating the accuracy of calculated values using these 3 expressions for ΔG relative to experimental values. The maximum D - ΔH and D - ΔS values achieved by the hyperbolic expression for ΔCp in 16 BMGs were less than 10 % and 15 % of initial values (see Table 2), respectively. The maximum D - ΔH and D - ΔS values derived from linear and Dubey's expressions for ΔCp (see Table 2) presented bigger values of 16.8 % and 45.7 %, respectively, compared with those derived from the hyperbolic expression. Thus, calculations for ΔG; ΔH; and ΔS values also suggested that the hyperbolic expression for ΔCp was the most accurate predictor of experimental values.
 |
| Fig. 4 Parameters ΔG a, ΔH b, and ΔS c as well as deviation values D - ΔG d, D - ΔH e, and D - ΔS f as functions of temperature derived for the Zr46Cu46Al8 alloy using reported experimental results and three different expressions |
 |
| Fig. 5 Parameters ΔG a, ΔH b, and ΔS c and deviation values D - ΔG d, D - ΔH e, and D - ΔS f as functions of temperature derived for the La55Al25Cu25Ni5Co5 alloy using reported experimental results and 3 different expressions |
Results and analysis of D - ΔH and D - ΔS derived from Dubey's expression for ΔCp produced similar findings to those of D - ΔCp derived from Dubey's expression. The majority of D - ΔH and D - ΔS values derived from Dubey's expression for ζ < 2 were very close to the D - ΔH and D - ΔS values derived from the linear and hyperbolic expressions, suggesting that the difference between D - ΔH and D - ΔS values in each of the three expressions was very small for ζ < 2 (see Table 2). The majority of D - ΔH and D - ΔS values derived from Dubey's expression for ζ > 2 were much larger than the D - ΔH and D - ΔS values derived from the linear and hyperbolic expressions, suggesting that most ΔH; and ΔS values derived from Dubey's expression did not accurately predict experimental values for ζ > 2.
 |
| Fig. 6 Parameters ΔG a, ΔH b, and ΔS c and deviation values D - ΔG d, D - ΔH e, and D - ΔS f as functions of temperature derived for the Ti36.89Cu43.87Ni9.36Zr9.88 alloy using reported experimental results and 3 different expressions |
 |
| Fig. 7 Parameters ΔG a, ΔH b, and ΔS c and deviation values D - ΔG d, D - ΔH e, and D - ΔS f as functions of temperature derived for the Pd43Ni10Cu27P20 alloy using reported experimental results and 3 different expressions |
Thus, the hyperbolic expression for ΔCp represents are relatively universal expression, compared to the linear expression and Dubey's expression for ΔCp which are only accurate under certain conditions. Notably, experimental values more closely fit values produced by the linear expression for ΔCp than values produced by Dubey's expression for ΔCp. Dubey's expression for ΔCp was, however, a good approximation of experimental values for ζ < 2, though not for ζ > 2. 5 Discussion
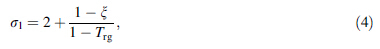
Dmax. between the calculated and experimental values for ΔCp, ΔG; ΔH; and ΔS from Tg to Tm was found to be associated with the ζ parameter according to Fig. 3 and Table 2. Equations (4), (14), and (19) showed that in addition to the effects of the ζ parameter, D values were also influenced by the Trg values, which ranged from 0.56 to 0.73 and could be expressed as a function of the n value (see Fig. 8). Thus, equidistant low, medium, and high Trg values of 0.56, 0.65, and 0.73 were selected to further characterize the effect of Trg on the value of D (or Dmax.). Figure 9a shows the relationship between the σh, σD, and σl values and the ζ values for Trg values of 0.56, 0.65, and 0.73.
 |
| Fig. 8 Relationship between Trg and ζ values |
For ζ < 2, the change in the 3 σh, σD, and σl values with Trg was negligible, suggesting that ΔCp, ΔG; ΔH; and ΔS values calculated using different models were virtually identical (see Fig. 3 and Table 2). For ζ > 2, however, the values of σh, σD, and σl at the 3 different Trg values revealed a decreasing trend. As ζ values increased from 0.5 to 7, σD values exhibited only small decreases, while larger decreases were exhibited by σh values. Moderate decreases in σl values were observed in between those of σD and σh compared with σh, σD, and σl values at Trg = 0.65. Notably, this change can be neglected to simplify analysis.
Thus the majority of BMGs Trg can be considered constant (Trg = 0.65). Figure 9b demonstrates the relationship between σh, σD, and σl values and the ζ parameter at Trg = 0.65. When Trg = 0.65, the changes in σh, σD, and σl values are revealed to be very large, leading to variation in the deviation values for ΔCp, ΔG; ΔH; and ΔS between calculated and experimental values. As shown in Fig. 3 and Table 2, the Dmax - ΔCp values can be used to reveal the fit of ΔG; ΔH; and ΔS between the calculated and experimental values (see Fig. 3 and Table 2). Due to this observation, only Dmax - ΔCp values are discussed.
 |
| Fig. 9 Relationship between σh, σD, and σl, and ζ values for different Trg a and Trg = 0.65 b |
Graphs of Cp as a function of temperature when ζ values equal to 2 and 3 (n = 2; ζ = 3) are shown in Fig. 10a, in which Cpl and Cps represent the heat capacity of the supercooled liquid and crystal, respectively. Cpl and Cps values were derived by fitting the experimental data. Figure 10b shows the ΔCp value evolution and temperature increases for n values of 2 and 3, where the ζ parameter is the change rate of DCps and ΔCpm, In order to characterize the difference in Dmax. values produced by Dubey's expression and the hyperbolic expressions for ΔCp from Tg to Tm, corresponding temperatures for Dmax - ΔCp values can be inferred.
 |
| Fig. 10 Graphs of Cp a and ΔCp b for ζ = 2 and ζ = 3, respectively (The inset shows the fit of the linear expression for ΔCp at different n values in the temperature range from Tg to Tm) |
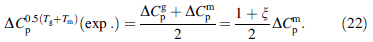
Temperatures corresponding to the Dmax - ΔCp values for Zr46Cu46Al8, La55Al25Cu25Ni5Co5, Ti36.89Cu43.87Ni9.36Zr9.88, and Pd43Ni10Cu27P20 BMGs are generally between Tg and Tm (see Figs. 1 and 2). Thus Tmax = 0.5 Tg + Tm), where Tmax is the hypothetical maximum temperature of Dmax - ΔCp. All 16 studied BMGs also exhibit trends similar to those of the 4 representative materials shown (data not shown). ΔCp values calculated using the linear expression closely approximate experimental values for ΔCp (see Fig. 3). Thus, for temperature of 0.5 Tg + Tm), a calculated value closely fits to the experimental ΔCp0.5 Tg + Tm) (exp.), can be expressed as (see Fig. 10b)
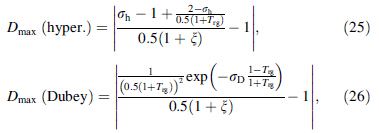
Substitution of Tmax into Eqs. (1) and (15), the hyperbolic expression and Dubey's expression for ΔCp0.5 Tg + Tm) (hyper.) and ΔCp0.5 Tg + Tm) (Dubey) can be deduced as

Thus, expressions of Dmax. (hyper.) and Dmax. (Dubey) generated by the hyperbolic expression and Dubey's expression for ΔCp between the calculated and experimental values, respectively, can be written as
 |
| Fig. 11 Relationship between Dmax. from the hyperbolic expression and Dubey's expression for ΔCp and the ζ parameter for Trg = 0.65 using Eqs. (25) and (26) |
A linear expression for ΔCp derived from the hyperbolic expression for ΔCp was deduced and used to obtain a novel expression for ΔG; ΔH; and ΔS: According to the experimentally determined thermodynamic parameters of the 16 examined BMGs in the current study, more accurate calculations of ΔCp, ΔG; ΔH; and ΔS were obtained using the linear, hyperbolic, and Dubey's expression for ΔCp. These results suggest that the hyperbolic expression for ΔCp can be applied as a universal expression for ΔCp, while linear and Dubey's expressions for ΔCp are condition-dependent. Notably, Dubey's expression for ΔCp also closely approximated experimental values when ζ < 2, though values were shown to deviate from experimental values for ζ > 2.
Acknowledgments The work described in this paper was supported by the grant from the National Natural Science Foundation of China (Grant No. 51025415).| 1. | Zallen R (1973) The physics of amorphous solids. Wiley, New York |
| 2. | Machlin E (2007) An introduction to aspects of thermodynamics kinetics relevant to materials science. Elsevier, Science or Technology Books, Amsterdam |
| 3. | Stillinger FH (1988) Supercooled liquids, glass transitions and the Kauzmann paradox. J Chem Phys 88:7818-7825 |
| 4. | Turnbull D (1950) Formation of crystal nuclei in liquid metals. J Appl Phys 21:1022-1028 |
| 5. | Paul A (1982) Chemistry of glasses. Chapman and Hall, London 6. Singh HB, Holz A (1983) Stability limit of supercooled liquids. Solid State Commun 45:985-988 |
| 7. | Dubey KS (2010) Thermodynamic and viscous behaviour of glass forming melts and glass forming ability. AIP Conf Proc 1249:211-232 |
| 8. | Singh PK, Dubey KS (2012) Thermodynamic behaviour of bulk metallic glasses. Thermochim Acta 530:120-127 |
| 9. | Jones D, Chadwick G (1971) An expression for the free energy of fusion in the homogeneous nucleation of solid from pure melts. Philos Mag 24:995-998 |
| 10. | Mondal K, Chatterjee UK, Murty BS (2003) Gibb's free energy for the crystallization of glass forming liquids. Appl Phys Lett 83:671-673 |
| 11. | Patel TA, Pratap A (2010) Study of thermodynamic properties of Pt57.3Cu14.6Ni5.3P22.8 bulk metallic glass. AIP Conf Proc 1249:161-165 |
| 12. | Thompson CV, Spaepen F (1979) On the approximation of the free energy change on crystallization. Acta Metall 27:1855-1859 |
| 13. | Hoffman JD (1958) Thermodynamic driving force in nucleation and growth processes. J Chem Phys 29:1192-1193 |
| 14. | Ji X, Pan Y (2007) Gibbs free energy difference in metallic glass forming liquids. J Non-Cryst Solids 353:2443-2446 |
| 15. | Li PY, Wang G, Ding D et al (2013) Characterizing thermodynamic properties of Ti-Cu-Ni-Zr bulk metallic glasses by hyperbolic expression. J Alloys Compd 550:221-225 |
| 16. | Jiang QK, Zhang GQ, Yang L et al (2007) La-based bulk metallic glasses with critical diameter up to 30 mm. Acta Mater 55:4409-4418 |
| 17. | Lu ZP, Hu X, Li Y (2000) Thermodynamics of La based La-Al- Cu-Ni-Co alloys studied by temperature modulated DSC. Intermetallics 8:477-480 |
| 18. | Glade SC, Busch R, Lee DS et al (2000) Thermodynamics of Cu47Ti34Zr11Ni8, Zr52.5Cu17.9Ni14.6Al10Ti5 and Zr57Cu15.4Ni12.6Al10Nb5 bulk metallic glass forming alloys. J Appl Phys 87:7242-7248 |
| 19. | Jiang QK, Wang XD, Nie XP et al (2008) Zr-(Cu, Ag)-Al bulk metallic glasses. Acta Mater 56:1785-1796 |
| 20. | Busch R, Liu W, Johnson WL (1998) Thermodynamics and kinetics of the Mg65Cu25Y10 bulk metallic glass forming liquid. J Appl Phys 83:4134-4141 |
| 21. | Legg BA, Schroers J, Busch R (2007) Thermodynamics, kinetics, and crystallization of Pt57.3Cu14.6Ni5.3P22.8 bulk metallic glass. Acta Mater 55:1109-1116 |
| 22. | Li PY, Wang G, Ding D et al (2012) Glass forming ability and thermodynamics in the new Ti-Cu-Ni-Zr bulk metallic glasses. J Non-Cryst Solids 358:3200-3204 |
| 23. | Busch R, Kim YJ, Johnson WL (1995) Thermodynamics and kinetics of the undercooled liquid and the glass transition of the Zr41.2Ti13.8Cu12.5Ni10.0Be22.5 alloy. J Appl Phys 77:4039-4043 |
| 24. | Cai AH, Chen H, Li X et al (2007) An expression for the calculation of Gibbs free energy difference of multi-component bulk metallic glasses. J Alloys Compd 430:232-236 |
| 25. | Gallino I, Shah MB, Busch R (2007) Enthalpy relaxation and its relation to the thermodynamics and crystallization of the Zr58.5Cu15.6Ni12.8Al10.3Nb2.8 bulk metallic glass-forming alloy. Acta Mater 55:1367-1376 |
| 26. | Fan GJ, Loffler JF, Wunderlich RK et al (2004) Thermodynamics, enthalpy relaxation and fragility of the bulk metallic glassforming liquid Pd43Ni10Cu27P20. Acta Mater 52:667-674 |