 2013, Vol. 1
The article information
- Bing-Ge Zhao, Ling-Hong Kong, Ting-Ting Song, Qi-Jie Zhai, Yu-Lai Gao
- Phase precipitation and isothermal crystallization kinetics of FeZrB amorphous alloy
- Advances in Manufacturing, 2013, 1(3): 251-257
- http://dx.doi.org/10.1007/s40436-013-0033-2
-
Article history
- Received: 2013-04-07
- Accepted: 2013-06-26
- Published online: 2013-07-26


2. School of Materials Science and Engineering, Shanghai University, Shanghai 200072, People’s Republic of China
In contrast to Co-based alloys with excellent magnetic properties [1], Fe-based soft magnetic alloys usually do not exhibit a good magnetic property [2, 3]. Considering the extensive applications of Fe-based soft magnetic alloys in certain fields such as transformer core and magnetic sensor [4, 5, 6], abundant endeavors were still done to explore the effective methods to improve their magnetic properties. One method is to introduce an α-Fe phase into the amorphous phase matrix. To achieve this α-Fe/amorphous dual phase structure, annealing of the amorphous precursors is a useful and easy way [4, 5]. During annealing, the crystallization process of Fe-based alloys generally proceeds in two distinct steps, i.e., a primary crystallization of α-Fe phase followed by the precipitation of Fe-B(Zr) compounds from the residual amorphous matrix [6, 7]. According to Herzer’s model [8], the interaction between α-Fe grains and amorphous matrix can average out the magneto-crystalline anisotropy, promoting the magnetic properties of the Fe-based alloys. On the other hand, the existence of Fe-B(Zr) phase can increase the magneto-crystalline anisotropy and correspondingly deteriorate the soft magnetic properties [9, 10]. Therefore it is critical to achieve excellent soft magnetic properties by enhancing α-Fe amorphous dual phase structure formed in the primary crystallization and strictly prohibiting the precipitation of Fe-B(Zr) phase. Furthermore Suzuki et al. [11] found that the coercivity (Hc) sharply increased with the growth of α-Fe grain and built up a dependence of the cubic grain size (d3) on Hc. As such, precise control of the α-Fe phase precipitation during the primary crystallization is important to optimize the soft magnetic properties in the Fe-based alloys. Besides, the understanding of the crystallization kinetics and crystallization mechanism of primary α-Fe phase can provide a significant guidance to choose an appropriate annealing process and therefore achieve the optimized soft magnetic properties.
In particular, as-annealed Nanoperm alloy with dual phase structure is widely used [12, 13]. Since 1990s, efforts have been done on improving the soft magnetic properties of FeMB system (M standing for the transition elements, such as Zr, Nb, Mo, etc.) with high iron content by doping elements [14, 15, 16, 17] and optimizing the annealing process [18, 19, 20]. Generally, two kinds of annealing processes have been employed to obtain the dual phase structure: i.e., continuously heating process and isothermal process. Johnson-Mehl-Avrami-Kolmogorov (JMAK) equation and its extension have also been developed to evaluate the isothermal and non-isothermal kinetics [21, 22, 23]. Our previous study [24] has discussed the non-isothermal crystallization kinetics of Fe78Zr7B15 alloy with high stability and high Curie temperature (Tc) in the amorphous state. To compare the crystallization kinetics of the annealing process and its corresponding effects on the phase precipitation, the isothermal crystallization kinetics of Fe78Zr7B15 alloy was investigated in this paper. Besides, the local activation energy (Ec) and Avrami exponent (n) of primary α-Fe phase were calculated to illustrate the precipitation mechanism of α-Fe phase. 2 Experimental process
Master alloy ingots with nominal composition of Fe78Zr7B15 (at%) were prepared in an arc furnace under argon atmosphere. The ingots were melted at least five times to ensure the homogeneity. Amorphous ribbons with a cross section from 0.025 mm × 4 mm to 0.045 mm × 4 mm were prepared by a single roller melt-spinning method in argon atmosphere at a linear speed of 34.5 m/s. Heat treatments were carried out in a vacuum furnace with the vacuum of 2.6 × 10⁻³ Pa. The ribbons were cut into small strips with length of 20 mm and annealed at different temperatures (Ta) for 20 min.
Differential scanning calorimetry (Netzsch DSC 404) was used to investigate the thermal behavior of the asquenched (Aq) ribbons at a heating rate of 20 °C/min. The structures of the Aq and annealed ribbons were examined by X-ray diffraction (XRD, Dlmax-2200) with Cu Ka radiation. The isothermal DSC experiments were performed in a DSC (Perkin-Elmer Diamond 3000). The Ms and Tc were measured by vibrating sample magnetometer (VSM, LakeShore 7407) under a magnetic field with a maximum of 0.5 T. The morphology of the precipitated phases was observed by scanning electron microscopy (SEM, JSM-6700F). 3 Results and discussion 3.1 Crystallization process
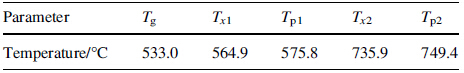
The DSC curve of Aq ribbon (see Fig. 1) exhibited two distinct steps. The crystallization characteristic parameters, including the glass transition temperature Tg, onset crystallization temperatures of the first and the second exothermic peak, Tx1 and Tx2, and the peak temperatures of the first and the second exothermic peak, Tp1 and Tp2, were listed in Table 1. Normally it was believed that the crystallization started at Tx1 [25]. However the Tx1 was not constant and shifted to a higher temperature with increasing the heating rate due to the thermodynamic effect. Therefore the crystallization actually occurred at a lower temperature than Tx1. Considering this thermodynamic effect, three different annealing temperatures (Ta) were chosen, i.e., (i) Ta = 450 °C < Tg, (ii) Tg < Ta = 550 °C < Tx1, (iii) Tx1 < Ta = 720 °C < Tx2, to explore the possible precipitation phases at different crystallization steps.
 |
| Fig. 1 DSC curves of Aq Fe78Zr7B15 ribbons at the heating rate of 20 °C/min |
 |
The XRD patterns of the Aq and annealed ribbons were shown in Fig. 2. A broad peak at around 2h = 44° confirmed the fully amorphous nature of Aq ribbons. It did not significantly change the amorphous structure because the XRD pattern of the Aq ribbon annealed at 450 °C was almost the same to that in Aq state (see Fig. 2). When Ta = 550 °C, namely Tg < Ta < Tx1, the Aq ribbon exhibited a sharp diffraction peak (corresponding to an α-Fe phase in Fig. 2) overlapping the broad peak, indicating an occurrence of crystallization. When Ta increased to 720 °C slightly below Tx2, the broad peak completely disappeared and the relative intensity of α-Fe phase diffraction peak increased, implying that much more α-Fe phase precipitated. Meanwhile, the diffraction peaks corresponding to Fe2B could be observed with low height. Based on the aforementioned discussion, the crystallization process in the whole range could be described as Am → α-Fe + Am* → α-Fe + Fe2B with Am* representing the residual amorphous matrix.
 |
| Fig. 2 XRD patterns of the Aq and annealed ribbons after annealed at 550 °C for 10 and 20 min the Ms values of |
The Ms and Tc of the Aq ribbons measured by VSM were 124.3 (A·m2)/kg and 305 °C, respectively, which were higher than those of Nanoperm alloy with high iron content [12, 13]. Some researchers pointed out that the structural relaxation could attribute to the decrease of the Ms [26]. The same phenomenon was observed in the present study that the Ms reduced to 120.7 (A·m2)/kg though the ribbon was still amorphous when the Aq ribbon was annealed at 450 °C. When annealed at a lower temperature, the alloy was transformed into a stable state from the metastable amorphous state [27]. It was deemed that the structure of the alloy slightly changed in this process. However the atomic configuration and local atomic structure were different from those in Aq state, which consequently resulted in the decrease of Ms. After being annealed at 550 °C, Ms was increased to 145.6 (A·m2)/kg, which was approximately 17 % higher than that of the Aq ribbons. It was obvious that the precipitation of α-Fe phase in the amorphous phase matrix namely the formation of dual phase structure was favorable to the improvement of Ms. Once Fe2B phase was precipitated from the residual amorphous matrix after the ribbons being annealed at 720 °C, the soft magnetic properties were deteriorated [8]. Hence, the annealing temperature must be centered at Tx1, which can avoid the deterioration of the soft magnetic properties. Figure 3 showed the precipitated dual phase structure of the FeZrB ribbons annealed at 550 °C, revealing that the nano-sized grains were embedded in the amorphous matrix. The crystallized volume fraction of α-Fe phase increased with annealing time, and Ms was closely related to the crystallized volume fraction of α-Fe phase. To shed much light on their relationship, the isothermal annealing was carried out in DSC at temperatures of 540, 550, 556, 562, 565 and 572 °C, respectively.
 |
| Fig. 3 SEM image of Fe78Zr7B15 ribbons annealed at 550 °C |
The isothermal DSC traces of ribbons at different temperatures were shown in Fig. 4. At 540 °C, it was found that the exothermic peak spread out gently and covered a large span along the x-axis. With increasing the isothermal annealing temperature, the exothermic peak got sharper and the time span become shortened, reflecting the occurrence of the violent reaction. The isothermal crystallization at 540 °C was so weak that the DSC curve lost smoothness in the amplification condition, and this result was neglected in the following discussion.
 |
| Fig. 4 Isothermal DSC curves of the Fe78Zr7B15 ribbons at different temperatures |
According to the isothermal DSC curves, the temperature- time-transformation (TTT) curves were plotted in Fig. 5. The time consisted of the onset crystallization time (ts), the peak crystallization time (tp) and the end crystallization time (tf), respectively. It could be observed that the incubation time (τ) was getting longer with decreasing annealing temperature, indicating that the reaction was slowed down at lower temperature. To further probe the crystallization mechanism, the crystallization kinetics was discussed as follows.
 |
| Fig. 5 TTT curves of the first-step crystallization |
Integrating the isothermal DSC curves up to time t, the crystallized volume fraction x as a function of time t was plotted in Fig. 6. The VSM measurement suggested that the Aq ribbon were 138.2 and 145.6 (A·m2)/kg respectively, implying that the value of Ms depends on the crystallized volume fraction of α-Fe phase. Herzer [9] described this relationship as the following formula:


 |
| Fig. 6 Plots of crystallized volume fraction (x) versus time (t) of the Fe78Zr7B15 ribbons isothermally heated at different temperatures: a 572 °C; b 565 °C; c 562 °C; d 556 °C; e 550 °C |
Figure 7 showed that Ec(x) decreased with increasing the crystallized volume fraction, which could be classified as three stages: x < 10 %, 10 % < x < 90 % and x > 90 %. In the initial stage with x < 10 %, the higher activation energy suggested a higher energy barrier of crystallization. Once the crystallization was initiated, the activation energy was dropped rapidly. Ec(x) was slightly decreased at the second stage with 10 % < x < 90 %, implying that the crystallization proceeded stably in this region. Referring to Fig. 7, the stable decrease of the activation energy was corresponding to the dramatically increasing of the crystallized volume fraction. When x > 90 % at the last stage, the energy barrier dropped rapidly. However the variation of sigmoid curves in Fig. 6 was not consistent with this tendency. The linear slope of sigmoid curves became flat again and the reaction slowed down at the end of the crystallization process. It was known that the amorphous structure was in a metastable high energy state. During the crystallization process, the structure became more stable [27]. It became more difficult for the following reaction in the residual amorphous matrix. Hence, the reaction slowed down in the final crystallization stage, and the nucleation transformed into growth gradually.
 |
| Fig. 7 Relationship between local activation energy Ec(x) and volume fraction x of the first-step crystallization |
The crystallization mechanism can be reflected by Avrami exponent n [29]. The value of n reflects the nucleation and growth modes during the crystallization process. Different nucleation and growth modes can result in distinct crystalline structures. As a result, the change of Ms is not only related to the volume fraction of α-Fe phase, but also to the crystalline structure. The n value could be deduced from the JMAK equation, which is based on the following assumptions [29]:
(i) Nucleation and growth occurs in isothermal crystallization conditions.
(ii) Homogenous nucleation or heterogeneous nucleation occurs at randomly dispersed particles of the second phase.
(iii) Growth rate of new phases is only controlled by temperature and independent of time.
(iv) Growing crystals possess low anisotropy.
JMAK equation was given by [30, 31]:


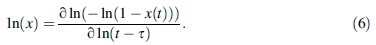
The plot of ln(- ln(1 - x(t))) against ln(t - τ) will provide the n values from the slope of curves, as shown in Fig. 8. It is found that the slope of curve mainly keeps constant in the whole crystallization process until the last stage, which indicates that the nucleation and growth of primary α-Fe phase holds the same way in the crystallization process. Furthermore, local Avrami exponent n(x) is applied to characterize the nucleation and growth behavior, which is given by [30]:
 |
| Fig. 8 JMAK plots of ln(- ln(1 - x(t))) versus ln(t - τ) at different temperatures of the first-step crystallization |
Figure 9 shows the relationship between the n(x) and the crystallized volume fraction x. It shows that the n values of the first crystallization are in the range of 1.5-2.5 in isothermal crystallization. In non-isothermal crystallization these values are in the range of 1.6-3, which reflects the different crystallization mechanism in the various annealing processes [24]. At the annealing temperature of 550 °C, the n(x) value keeps constant at 2. It clearly reveals that the crystallization mechanism is a diffusion-controlled surface crystallization mode. During this process, nucleation rate decreases with annealing time. When x increases to 98 %, the JMAK equation does not work because the abovementioned assumptions are no longer satisfied. Since the crystallization mechanism does not change at 550 °C during the whole crystallization process, the higher Ms of the ribbon annealed for 20 min than that annealed for 10 min can be attributed to the increasing volume fraction of α-Fe phase.
 |
| Fig. 9 Local Avrami exponent n(x) versus crystallized volume fraction x at different temperatures of the first-step crystallization |
The n(x) values at 556 °C were similar to those at 550 °C in the initial stage. But for other annealing temperatures, the values of n(x) were slightly higher than that at 550 °C, which implied that the nucleation rate was higher at higher annealing temperatures. With increasing crystallized volume fraction, the n(x) values decreased gently, suggesting a reduction of nucleation rate. Although the mechanism of nucleation and growth remained unchanged, the nucleation rate decreased rapidly at higher temperatures. When x approached approximately 60 %, the local Avrami exponents at different temperatures intersected at the same value point (see Fig. 9). This might indicate that the nucleation rate kept the same. The maximal reduction of n(x) was achieved at 572 °C. The value of n(x) was lower than 1.5 when x was around 75 %, reflecting that the nucleation rate was equal to zero. As discussed above, n(x) decreased with increasing isothermal annealing temperature; the crystallization process was slowed down in the final stage; the crystallization mode was changed from nucleation to growth gradually. Due to the lack of free point position for nucleation, the energy mainly supports grain growing. Therefore, the heat treatment should be carried out at lower temperature nearby Tx1. Meanwhile, the annealing time should be correspondingly shortened when the temperature increases. 4 Conclusion
The crystallization process of amorphous ribbon Fe78Zr7B15 was investigated with XRD and DSC. The crystallization mechanism of primary α-Fe phase was studied by DSC at isothermal conditions. The main results are summarized as follows:
(i) The Ms and Tc of Aq ribbon were 124.3 (A·m2)/kg and 305 °C, respectively. The crystallization proceeds in two distinct steps: amorphous (Am) τ α-Fe + residual amorphous (Am*) τ α-Fe + Fe2B. Annealing at 550 °C resulted in the increase of Ms by 17 % due to the formation of a dual phase structure.
(ii) The local activation energy Ec(x) decreased with the increase of crystallized volume fraction, implying a stronger crystallization tendency as soon as the initial crystallization occurred.
(iii) The crystallization of primary α-Fe phase was dominated by diffusion. It was initiated by surface nucleation and its growth began with a decreasing nucleation rate with a local Avrami exponent n(x) in the range of 1.5-2.5. In order to obtain the dual phase structure with excellent soft magnetic properties, the heat treatment should be carried out at a temperature about 20 °C lower than Tx1 and the annealing time should be correspondingly shortened while the annealing temperature increased.
| 1. | Hao L, Diao XG, Gu BX, Zhang LY, Wang TM (2008) Study on preparing and crystallization kinetics of melt-spun Co-based soft magnetic amorphous alloy Nanoperm. Rare Metal Mater Eng 37:1628-1632 |
| 2. | Makino A, Hatanai T, Naitoh Y, Bitoh T, Inoue A, Masumoto T (1997) Applications of nanocrystalline soft magnetic Fe-M-B (M = Zr, Nb) alloys. IEEE Trans Magn 33:3793-3798 |
| 3. | Yuan WJ, Liu FJ, Pang SJ, Song YJ, Zhang T (2009) Core loss characteristics of Fe-based amorphous alloys. Intermetallics 17:278-280 |
| 4. | Yoshizawa Y, Oguma S, Yamauchi K (1988) New Fe-based soft magnetic alloys composed of ultrafine grain structure. J Appl Phys 64:6044. doi:10.1063/1.342149 |
| 5. | Soliman AA, Al-Heniti S, Al-Hajry A, Al-Assiri M, Al-Barakati G (2004) Crystallization kinetics of melt-spun Fe83B17 metallic glass. Thermochim Acta 413:57-62 |
| 6. | Lu W, Yan B, Tang R (2006) Bulk metglas, finemet and Nanoperm soft magnetic alloys prepared by ultra-high-pressure consolidation. J Alloy Compd 425:406-410 |
| 7. | Nagase T, Umakoshi Y, Sumida N (2002) Formation of nanocrystalline structure during electron irradiation induced crystallization in amorphous Fe-Zr-B alloys. Sci Technol Adv Mater 3:119-128 |
| 8. | Herzer G (1995) Soft magnetic nanocrystalline materials. Scr Metall Mater 33:1741-1756 |
| 9. | Herzer G (1989) Grain structure and magnetism of nanocrystalline ferromagnets. IEEE Trans Magn 25(5):3327-3329 |
| 10. | Suzuki K, Cadogan JM (1998) Random magnetocrystalline anisotropy in two-phase nanocrystalline systems. Phys Rev B 58:2730-2739 |
| 11. | Suzuki K, Herzer G, Cadogan JM (1998) The effect of coherent uniaxial anisotropies on the grain-size dependence of coercivity in nanocrystalline soft magnetic alloys. J Magn Magn Mater 177-181:949-950 |
| 12. | Gorria P, Barquln LF, Prida VM, Howells WS (2003) Microstructural study of joule heated nanocrystalline alloys using in situ neutron diffraction. J Magn Magn Mater 254-255:504-506 |
| 13. | Makino A, Hatanai T, Inoue A, Masumoto T (1997) Nanocrystalline soft magnetic Fe-M-B (M = Zr, Hf, Nb) alloys and their applications. Mater Sci Eng A 226-228: 594-602 |
| 14. | Makino A, Bingo M, Bitoh T, Yubuta K, Inoue A (2007) Improvement of soft magnetic properties by simultaneous addition of P and Cu for nanocrystalline FeNbB alloys. J Appl Phys 101:09N117. doi:10.1063/1.2714676 |
| 15. | Suzuki K, Cadogan JM, Aoki K, Ringer SP (2003) Soft magnetic properties of Ge-doped nanocrystalline Fe-Zr-B alloys. J Magn Magn Mater 254-255:441-443 |
| 16. | Karolus M, Kwapuliński P, Chrobak D, Haneczok G, Chrobak A (2005) Crystallization in Fe76X2B22 (X = Cr, Zr, Nb) amorphous alloys. J Mater Process Technol 162-163:203-208 |
| 17. | Ipus JJ, Blázquez JS, Franco V, Conde A (2010) Influence of Co addition on the magnetic properties and magnetocaloric effect of Nanoperm (Fe1-XCoX)75Nb10B15 type alloys prepared by mechanical alloying. J Alloy Compd 496:7-12 |
| 18. | Tang J, Mao X, Li S, Gao W, Du Y (2004) Effects of two-step annealing on the microstructures and soft magnetic properties of nanocrystalline Fe86Zr7B6Cu1 ribbons. J Alloy Compd 375: 233-238 |
| 19. | Ito N, Michels A, Kohlbrecher J, Garitaonandia JS, Suzuki K, Cashion JD (2007) Effect of magnetic field annealing on the soft magnetic properties of nanocrystalline materials. J Magn Magn Mater 316:458-461 |
| 20. | Modak SS, Ghodke N, Mazaleyrat F, Bue ML, Varga LK, Gupta A, Kane SN (2008) Structural and magnetic investigation of gradually devitrified Nanoperm alloys. J Magn Magn Mater 320:e828-e832 |
| 21. | Minić DM, Adnadević B (2008) Mechanism and kinetics of crystallization of a-Fe in amorphous Fe81B13Si4C2 alloy. Thermochim Acta 474:41-46 |
| 22. | Tang W, Liu Y, Zhang H, Wang C (2003) New approximate formula for Arrhenius temperature integral. Thermochim Acta 408:39-43 |
| 23. | Shivaee HA, Hosseini HRM (2009) Advanced isoconversional kinetics of nanocrystallization in Fe73.5Si13.5B9Nb3Cu1 alloy. Thermochim Acta 494:80-85 |
| 24. | Kong LH, Gao YL, Song TT, Wang G, Zhai QJ (2011) Nonisothermal crystallization kinetics of FeZrB amorphous alloy. Thermochim Acta 522:166-172 |
| 25. | Rizza G, Dunlop A, Jaskierowicz G, Kopcewicz M (2004) Local crystallization induced in Fe-based amorphous alloys by swift heavy projectiles. Nucl Instrum Methods Phys Res B 226:609-621 |
| 26. | Cziráki Á, Udvardy O, Lovas A, Tichy G (2004) Some structural aspects of magnetic property evolution in finemet-type sensor material during amorphous-nanocrystalline transformations. Period Polytech Transp Eng 47:167-176 |
| 27. | Blazquez J, Conde C, Conde A (2005) Non-isothermal approach to isokinetic crystallization processes: application to the nanocrystallization of HITPERM alloys. Acta Mater 53:2305-2311 |
| 28. | Gao Y-L, Shen J, Sun J-F, Wang G, Xing D-W, Xian H-Z, Zhou B-D (2003) Crystallization behavior of ZrAlNiCu bulk metallic glass with wide supercooled liquid region. Mater Lett 57:1894-1898 |
| 29. | Málek J (2000) Kinetic analysis of crystallization processes in amorphous materials. Thermochim Acta 355:239-253 |
| 30. | Chrissafis K, Maragakis MI, Efthimiadis KG, Polychroniadis EK (2005) Detailed study of the crystallization behaviour of the metallic glass Fe75Si9B16. J Alloy Compd 386:165-173 |
| 31. | Illekovh E, Malizia F, Ronconi F (1996) The complexDSCanalysis of the first crystallization peak of Fe80Si10B10 metallic glass. Thermochim Acta 282(283):91-100 |
| 32. | McHenry ME, Johnson F, Okumura H, Ohkubo T, Ramanan VRV, Laughlin DE (2003) The kinetics of nanocrystallization and microstructural observations in FINEMET, NANOPERM and HITPERM nanocomposite magnetic materials. Scripta Mater 48:881-887 |
| 33. | Ramanan VRV (1982) Crystallization kinetics in Fe-B-Si metallic glasses. J Appl Phys 53:2273. doi:10.1063/1.330797 |