 2017, Vol. 5
The article information
- Cesar Giovanni Cabrera,Anna Carla Araujo,Daniel Alves Castello
- On the wavelet analysis of cutting forces for chatter identification in milling
- Advances in Manufacturing, 2017, 5(2): 130-142.
- http://dx.doi.org/10.1007/s40436-017-0179-4
-
Article history
- Received: 20 April, 2016
- Accepted: 25 April, 2017
- Published online: 26 May, 2017


The presence of vibrations in manufacturing processes has a tremendous impact on the quality of surface finishing and dimension precision. Additionally, mechanical vibrations also generate tool failures that represent approximately 20% of equipment downtime, according to Ref. [1].
With the aim of mitigation of the presence of mechanical vibrations in manufacturing processes, several studies have been conducted to characterise and model the dynamic behaviour of manufacturing tools. In particular, the models proposed by Tlusty and Neil [2] for end-milling and by Hanna and Tobias [3] for orthogonal cutting indicate that the mechanical vibrations in manufacturing tools are, in general, self-regenerative and commonly known as chatter.
Altintaş and Budak [4] stated that chatter initiation occurred as a natural consequence of the increase in the cutting forces. This leads to the self-excitation of one of the structural modes of the piece-tool system, and consequently reduces the surface finishing quality. Furthermore, the irregularities on the surface of the piece favour the presence of chatter. Given that the tool is not in contact with the piece all the time, this leads to an unstable cutting process. Budak and Altintaş [5] reported chatter in turning, broaching, and grinding.
In regard to the structural health monitoring strategies applied to the analysis of the tool, several contributions may be found in the literature. In Ref. [6], health monitoring of the tool was considered/classified in five categories concerning the type of analyses applied to the machining data: time-frequency analysis, signal denoising, feature extraction, singularity analysis, and wavelet analysis.
Cao et al. [7] presented an approach to detect chatter in end-milling using wavelet and Hilbert-Huang transform analyses. The latter type was also used by Fu et al. [8], considering energy aggregation characteristics for realtime chatter detection. Recently, a model-predictive control approach was used to adapt the computer numerical control (CNC) actions taking into account the process dynamics, based on the optimal control theory. This approach was subsequently applied in industry [9].
In particular, monitoring approaches based on wavelet analysis seem to be quite promising owing to the fact that they naturally allow for multi-resolution data analyses. Specific applications concerning wavelet analysis for chatter mitigation in machining are cited next. Kasashima et al. [10] proposed the analysis of force signals using the wavelet transform (WT) for real-time detection of tool defects, such as breakage, crack, and tool run out.
Suh et al. [11] and Tangjitsitcharoen et al. [12] also proposed the analysis of force signals using the WT. Based on such analyses, they were able to detect sudden changes in the force signals in real time. Furthermore, the analysis allowed identification of the transition of the tool from a stable to an unstable dynamic state. Peng et al. [13] used the wavelet energy entropy theory to extract the feature vectors using the cutting force. The present study is aligned with those articles that propose strategies to be used for real-time analysis to detect chatter based on wavelet decomposition.
In this study, the discrete WT was applied to the cutting force during milling operations. The cutting force signal was decomposed into an approximation/trend sub-signal and detailed sub-signal. The force signal was re-composed using modified sub-signals in order to minimise the measurement noise in such a way that the reference peak forces were strengthened. The sub-signal modifications were performed by applying a wavelet-based denoising procedure using a hard-thresholding method. A specific experimental set-up was properly designed in order to increase the depth of cut (DOC) along the cutting trajectory, and promote the occurrence of chatter. The correlation among the roughness of the machined surfaces, the peak strength of the force signal, and the quality of the machined surfaces, were performed under four experimental configurations, proving that the proposed procedure is able to identify chatter occurrence.
2 Dynamic forces in end-millingThe dynamics of the system composed of the end-milling tool, tool-holder, machine tool, and the workpiece, can present a complex non-linear behaviour associated with extreme conditions, such as chatter. These extreme operational conditions can severely affect the quality of the machined workpiece. Therefore, the engineering team should determine the working parameters/set-ups to avoid such conditions. In this context, modelling-based strategies can be very effective in determining optimal operational parameters. The specification of these optimal parameters should rely on analyses based on computational models that are adequately accurate to describe the cutting process.
The computational model is described as follows. The end-milling forces can be modelled considering chip loads and cutting pressures disregarding the chip load dynamics caused by tool displacements. This model is known as the ''force model'' considering the rigid end-milling tool. In this case, the dynamics of the cutting forces from the chipload dynamics are attributed only to the chip thickness function owing to the normal cutting geometry. In this case, the dynamics do not promote chatter, since there is no coupling between forces and displacement.
When there is coupling between the cutting force and the tool-tip displacement, the current chip-load value is a function of the tool stiffness, the tool tip-position, and the history of the tool-tip displacement (see Fig. 1). This model is called the ''dynamic end-milling force model''. Several authors proposed simple models to describe the tool dynamics during machining using one [14], or two degrees-of-freedom, and mass-spring-dashpot mechanical systems [15]. In accordance to a first elastic analysis, the end-milling tool is modelled as a cylindrical beam that is fixed to the tool holder at one extremity, and is forced at the other extremity, owing to its contact with the workpiece along the cutting force.

|
|
|
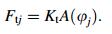
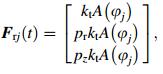
When the tool is considered to be rigid, the tangential force Ftj acting in the jth tooth can be written as a function of the chip load area A(φj), and the specific cutting force Kt as
|
(1) |
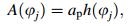
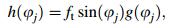
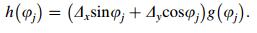
The chip-load area A(φj) is calculated considering the DOC ap in Eq. (2), and the uncut chip thickness h(φj) (see Eq. (3)), as
|
(2) |
|
(3) |
where φj is the location angle for the jth tooth tip measured with respect to the y axis, as a function of the feed per tooth ft in accordance to Ref. [2].
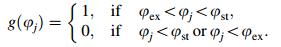
The function g(φj) indicates whether the tooth is engaged or not in the workpiece. This is accomplished by comparing φj with the entry and exit angles φst and φex (see Fig. 1), according to the relations presented in Eq. (4), where g is 1 if the tooth is engaged, or 0 if there is no contact:
|
(4) |
Assuming that the specific cutting force Kt, and the relation between the force components (pr and pz) are constants, the resultant force for each flute in the jth reference frame [4] is
|
(5) |
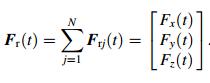
thus, the resultant tool force Fr(t) is the sum of all N flutes (j = 1, 2, ……, N), and it can be decomposed in the xyz reference frame as
|
(6) |
The tool tip displacement vector [x(t), y(t)]T relative to the holder is a consequence of the forces applied on the tool-workpiece system to produce chips, as shown in Fig. 1.
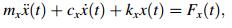
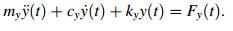
The force components Fx(t) and Fy(t) are functions of x(t) and y(t) as well as the effective mass, stiffness, and damping coefficients, mx, my, kx, ky, cx and cy [5], respectively.
|
(7) |
|
(8) |
Altintaş[16] considered the tool-tip displacement to calculate the chip thickness, including the variables △x(t)=x(t)-x0(t) and △y(t)=y(t)-y0(t), while the tool engagement considers φj and the relation between the tool-tip displacement and the workpiece position as
|
(9) |
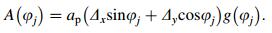
The dynamic chip load area A(φj) is calculated based on
|
(10) |
The chip load area A(φj) is a function of the displacement and the cutting force, referred to as a self-powered system that produces the chatter. In this article, the variable ap, directly connected to the chip load area and the magnification of force, and the spindle speed nf, are the chatter inductors and are related to the force periodicity (see Fig. 4).

|
|
|

|
|
|

|
|
|
Finally, it should be emphasised that the computational models presented in this section may be used to generate predictions of the system for diverse operational conditions. This can guide the user to find operational domains in which the chatter is less likely to occur. However, the reliability of these predictions depends on the accuracy of the model structures and their parameters.
3 Proposed approachThis section describes the basic characteristics of the proposed approach aimed at identifying chatter in milling. In brief, the approach relies on four main steps, as shown in Fig. 2.
The first step A refers to the determination of the experimental set-up judged as appropriate for the endmilling process. This step requires the specification of both the spindle speed nf and the DOC ap. It should be noted that this step requires some a priori knowledge concerning the end-milling process, as applied to the specific piece of interest by the engineering team. This step might be guided by the analysis provided by the computational models presented in Sect. 2.
The second step B refers to the estimation of the forces Fx(t), Fy(t), and Fz(t), generated by the end-milling process, and the computation of the magnitude of the resultant force Fr(t) in real time. The analysis of the resultant force Fr(t) is the basis for the present approach.
The third step C corresponds to the analysis of the resultant force Fr(t). It can be sequentially described as follows:
(ⅰ) Analysis of the signal Fr using the discrete WT;
(ⅱ) Application of a wavelet-based denoising scheme to the signal Fr(t) in order to mitigate data pollution that is not associated to the true physical forces. The denoised signal is denoted as 
Finally, it should be remarked that this step requires a priori knowledge of the most appropriate characteristics of the WT to be used here. This means that the engineering team has to perform some preliminary experiments in order to obtain the basic/common features of the cutting force Fr for the piece of interest. This information will provide means to choose the most appropriate WT to be used. Furthermore, it is expected that once it has been performed, one would be able, in principle, to use the same characteristics of the WT when considering the end-milling process of a new set of pieces that are similar to those used in the preliminary analysis.
The fourth step D corresponds to the decision making step itself. In this step, the engineering team decides the strategy for changing the end-milling parameters to suppress chatter.
4 Experimental force dataThe machining process and force acquisition are described in this section. This information will be used as input data for the proposed identification approach. Furthermore, this section contains information concerning the workpiece and tool dimensions, material specification, cutting parameters, machine-tool force acquisition equipment, and experimental cutting force data.
4.1 Workpiece, tool, and machine-tool specificationAn aluminium SAE 7475-T7 workpiece used in this study as industry claims that chatter can occur when end-milling is performed using this type of material. This material has high mechanical strength and it is extensively used in the aerospace industry. Concerning the workpiece itself, it was specifically designed for this research aiming to provide means to have variable depths of cut. The general view of the workpiece is shown on the right side of Fig. 3, and the characteristics of the ramp that allow for the variable DOC are described on the left. Its external dimensions are 38 mm × 65 mm × 152 mm.
The end-milling tool had a 30° helical angle, 6 mm cutting diameter D1, 4 flutes, and a maximum cutting height L2 of 13 mm. The tool was manufactured in high speed steel with cobalt (HSS/Co) without coating. The machining process was carried out on a Polares V400 CNC vertical machine from Romi manufacturers.
4.2 Machining parametersThe end-milling tool was machined in full immersion, which represents a constant radial DOC equal to the tool diameter. The spindle speed nf for each experiment is presented in Table 1.
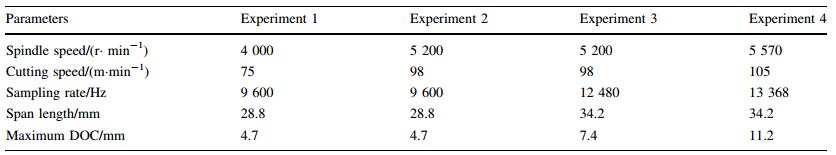
We considered different span lengths in order to obtain suitable conditions for the occurrence of chatter vibrations. For experiments 1 and 2, the tool span length was 28.8 mm. In regard to experiments 3 and 4, the span length was increased to 34.2 mm to induce chatter. Since this approach is not based on dynamic parameters, these do not affect the procedure.
The feed per tooth distance (ft = 0.02 mm/tooth) was kept the same for all four experimental configurations. Nevertheless, the DOC varied owing to the fact that the workpiece possessed an inclined surface, as shown in Fig. 3.
In the first and second experimental configurations, the maximum DOC was 4.7 mm, while in the third and fourth configurations, the maximum DOC reached 7.4 mm and 11.2 mm, respectively, as shown in Fig. 4.
It should be emphasised that the selection of these parameters was not based on experimental design strategies, as the main goal was to induce chatter vibrations. Furthermore, the present study did not require coverage of all sets of possible parameters but only some of those that led to the induction of chatter vibrations that the operator could properly identify and characterise.
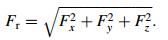
4.3 Cutting force measurementThe machining force components were measured using a piezoelectric dynamometer. The workpiece was fixed in a piezoelectric dynamometer (9257-BA by Kistler) connected to an amplifier (5233A by Kistler) and a data acquisition board (USB-6251 by National Instruments), as shown in Fig. 5. The measured force components were used to compute the resultant cutting force Fr (see Eq. (11)) that was used as the input signal for the analysis presented below.
|
(11) |

|
|
|
The complete set of data for the measured forces is presented in Fig. 6 for the four experimental configurations described in Table 1. The graphs on the left side of Fig. 6 present the raw data signals for the three components (Fx, Fy, Fz) of the measured forces, and the graphs on the right present their associated resultant forces Fr. Figure 6 shows the increase in the magnitude of the forces as the DOC increases. This set of measured data was used as input data for the chatter identification analysis as described in the next section.

|
|
|
This section briefly presents the basic characteristics of the wavelet analysis. More theoretical and applied analyses using WT can be seen in Refs. [17, 18].
Let us suppose that s:
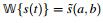
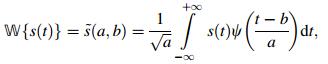
|
(12) |
where ψ(t) corresponds to the mother wavelet, a the dilation parameter, and b the location parameter. As the name itself suggests, the wavelet ψ(t) is a waveform that is localised in the time/space domain. Concerning the profile of the wavelets ψ(t), the engineering team may choose the Haar, Gaussian wave, Mexican hat, Morlet, or Daubechies (Db), represented by Db1, Db2, etc., among other profiles [17, 18]. The wavelet analysis is quite useful when transient signals s(t) are involved, as the analyst obtains information about the amount of energy within an interval It=[t0, tf] as well as its distribution at various levels/ scales.
Concerning its commonest uses, the wavelet analysis may find applications in denoising and smoothing of measured data, for example. In the present application, signals s(t) measured at a set of time instants (t1, t2, ……, tN) are considered for our applications.
This information can be represented by a vector s = [s(t1), s(t2), ……, s(tN)] for proper data treatment and analysis. A wavelet analysis uses the set of data contained in s by means of a discrete WT. Furthermore, the original signal may initially be expressed as a combination of an approximation (trend) sub-signal A(1) and a detailed subsignal D(1), as
|
(13) |
where the symbol ⊕ highlights the fact that this is a composition, not the conventional sum. In Eq. (13), the sub-signals A(1) and D(1) are obtained by means of the first-level wavelet function ψ(t) and the first-level scaling function [17, 18].
A key aspect of this analysis is that it is performed using the same type of decomposition on the first approximation sub-signal A(1), thereby leading to A(1)=A(2)⊕D(2), which in turn relies on the use of the second-level wavelet and second-level scaling functions. Moreover, this process may proceed further to the other k-level in a recursive fashion that leads to a multi-resolution scenario for analysis since each k-level is associated to a specific scale parameter a.
Let us assume that we are interested in minimising the presence of noise in some measured data s. Firstly, we consider that the relation between the measured signal s and the reference signal sref that we are interested in, may be described by the following observation model:

|
(14) |
where n describes the measurement noise with zero mean. We may obtain an estimate for the reference signal 


A feasible way to execute this strategy is: (ⅰ) to analyse the measured signal s using the multi-resolution decomposition provided by the WT; (ⅱ) to disregard or modify some components of the trend/approximation of sub-signals A
(k) and of the details of sub-signals D(k), based on a systematic fashion using the threshold λ; (ⅲ) to reconstruct the signal using the modified sub-signals 

In regard to the noise n, the probability that the k-level detailed sub-signals D(k) contain a large amount of information about it is high owing to the fact that the k-level approximation/trend signals A(k) are smoothed versions of the original signal, and are therefore associated to low frequencies. In this context, the hard-thresholding method [18] can be applied to the original detailed k-level subsignal D(k) in order to obtain the modified detailed k-level sub-signal 
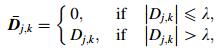
|
(15) |
where Dj, k denotes the jth component of the k-level subsignal D(k). An estimate for the reference signal 


In regard to the threshold λ, it is worth mentioning that one of the most popular and simplest thresholds is the universal threshold λu, which takes into account the number of components N of the signal s, and an estimate of the standard deviation of the noise n [17]. Nevertheless, for the present study, we propose an ad-hoc choice λah for the threshold value λ that proved to be amenable for our applications.
Finally, the choice of the most appropriate wavelet ψ(t) may be guided by the physical applications. The analysis of the original signal s in the time domain may provide some hints about the most suitable wavelets ψ(t) that can be used.
6 Results and discussion6.1 Wavelet analysis and denoisingAs mentioned in Sect. 5, the choice of the mother wavelet ψ(t) depends on the application of interest. Therefore, this choice was made based on the measured forces shown in Fig. 6. In particular, the measured resultant forces Fr for all the experimental configurations were initially analysed using the following mother wavelets: Haar, Db1, Db2, Db3, Db4, and Db5 [17, 18].
These analyses provided means for a choice concerning the most suitable mother wavelet for the intended application. Figure 7 presents the measured force and the trend/ approximation sub-signals {A(1), A(2), ……, A(5)} for some mother wavelets.
Figure 7 shows that the basic characteristics of the resultant force signal may be captured by the 5th level of the trend/approximation sub-signals when using wavelets Db4 and Db5 as mother wavelets. As the approximation signals calculated by Db4 and Db5 were quite similar, we chose to perform all the analyses using wavelet Db4.

|
|
|
Figure 8 presents the analysis of the resultant force Fr(t) measured using the first experimental configuration. It is important to note that there is increased similarity between the original force Fr(t) and the four-level approximation/trend for sub-signal A(4), as shown in Fig. 8c, for which the time interval window corresponds to a single period.

|
|
|
In regard to the estimate 

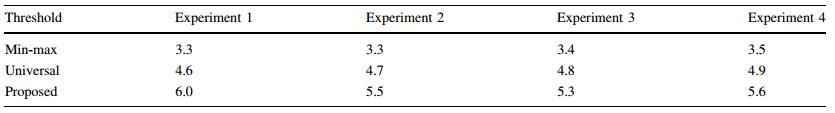
Therefore, we considered that the ad-hoc value for the threshold for each experiment was as follows: λah, exp1 = 5,
λah, exp2 = 5.5, λah, exp3 = 5.3, and λah, exp6 = 5.6. The second one is concerned with the reconstruction A(4) ⊕ D(1) that is considered to obtain the estimate
Figure 9 presents the modified first-level detailed subsignals 


|
 |
In order to analyse the machined surface, the workpiece was cut by wire-EDM in the direction aligned with the feed direction. This procedure was necessary to expose the lateral surfaces for profile measurements. The chatter was identified by the lateral marks, well known by its inclined pattern. Moreover, the surface roughness increased when chatter occurred. The slices of the workpiece are presented in Fig. 10a.

|
|
|
The machined profile was measured by a profilometer (Taylor Hobson Form Talysurf Intra 0120). The maximum measured length that is allowed in one single stylus trajectory is 50 mm. As the measurement of the complete profiles required trajectories longer than 50 mm, this procedure was performed in two steps. The measurement of the profile was re-composed with a groove/scratch that was used as a reference mark. It is important to emphasise that these groove peaks can be seen in profile measurements. Nevertheless, they were not considered in the measurement of the roughness as they were artificially induced over the surface.
The profile was filtered for roughness using 0.8 mm cutoff length for all the experiments. The average roughness Ra, and the peak-to-valley roughness Rt, are presented in Fig. 11. After wire cutting, the channel lateral surfaces were analysed. By visual inspection, the surfaces associated with experiments 1 and 2 did not present the characteristic marks/patterns identified as chatter. Additionally, the measured roughness was relatively low. The surface associated with experiment 3 did not present chatter in the channel entrance, but chatter patterns could be identified at the end parts of the machined length. In regard to the surface associated with experiment 4, it presented well defined inclined wavy marks, which were linked to the presence of the chatter. Furthermore, the Ra value was the largest, as shown in Fig. 11.

|
|
|
In the proposed method, there is no need to measure roughness in order to identify the chatter, since monitoring is performed using the cutting force signal only. However, it is important to measure the surface profiles and correlate them with the force signals measured along the end-milling process. This comparison shows the achievement of chatter identification by the large number of peaks found on the sub-signals, and by the chatter marks on the surface, in addition to increased roughness profiles.
An important aspect is that the profiles are measured along the cutting length domain, and the forces are measured along the time domain. Therefore, it was necessary to transform both of them to the same domain for proper comparisons. This was achieved by transforming all the signals to the cutting length domain, as shown in Fig. 12. In regard to the peak forces in Fig. 12, each point in these graphs corresponds to the force measured at the instant of time at which the tool is placed at that specific cutting length.

|
|
|
Figure 12 presents the roughness of the machined surface and the force peaks for the first and the fourth experimental configurations. These represent the extreme situations for the present analysis that also justify their inclusion herein.
Figure 12a presents the results for the first experiment, and Fig. 12b the corresponding results for the fourth experiment. Figure 12a shows a small number of force peaks and a surface profile with a smooth topography. On the other hand, Fig. 12b presents a greater number of force peaks and a rough surface indicating the intensity of the chatter. Complete results can be found in Ref. [19].
Finally, the identified peak densities and the values of measured roughness Ra are also highly correlated, as shown in Fig. 13.

|
|
|
This work presents an approach for real-time chatter identification. The approach relies on wavelet analysis of the cutting forces.
The approach proved effective for the four different experimental configurations analysed herein. The major contribution of this work is the fact that the peak force density is a compelling and useful feature that can be used for chatter identification, also its validation using the observation of high levels of correlation between the force peak densities and the roughness surface profiles.
Finally, the model-based analysis that is used to tune the cutting parameters is considered as the first step that needs to be executed to prevent chatter. A real-time chatter identification approach as the one proposed herein may be viewed as a powerful complement to the model-based analysis. It can continuously provide updated information about the status of the system, thereby increasing the reliability of system operations.
Acknowledgements The authors would like to express their gratitude to the National Council for Scientific and Technological Development (CNPq) for its financial support (Grant Nos.483391/2013 and 481406/2013) and to Coordenação de Aperfeiçoamento de Pessoal de Nível Superior (CAPES) for its financial support(Grant No. AUXPE 1197/2014).| 1. | Kurada S, Bradley C(1997)A review of machine vision sensors for tool condition monitoring.Comput Ind 34(1), 55-72 doi:10.1016/S0166-3615(96)00075-9 |
| 2. | Tlusty J, MacNeil P(1975)Dynamics of cutting forces in end milling.Ann CIRP 24, 21-25 |
| 3. | Hanna NH, Tobias SA(1974)Theory of nonlinear regenerative chatter.J Eng Ind Trans ASME 96, 247-255 |
| 4. | Altintaş Y, Budak E(1995)Analytical prediction of stability lobes in milling.CIRP Ann Manuf Technol 44(1), 357-362 doi:10.1016/S0007-8506(07)62342-7 |
| 5. | Budak E, Altintaş Y(1998)Analytical prediction of chatter stability in milling part Ⅰ: general formulation.J Dyn Syst Meas Control Trans ASME 120, 22-30 doi:10.1115/1.2801317 |
| 6. | Zhu K, Wong YS, Hong GS(2009)Wavelet analysis of sensor signals for tool condition monitoring: a review and some new results.Int J Mach Tools Manuf 49(7-8), 537-553 doi:10.1016/j.ijmachtools.2009.02.003 |
| 7. | Cao H, Lei Y, He Z(2013)Chatter identification in end milling process using wavelet packets and Hilbert-Huang transform.Int J Mach Tools Manuf 69(3), 11-19 |
| 8. | Fu Y, Zhang Y, Zhou H, et al(2016)Timely online chatter detection in end milling process.Mech Syst Signal Process 75, 668-688 doi:10.1016/j.ymssp.2016.01.003 |
| 9. | Bort CMG, Leonesio M, Bosetti P(2016)A model-based adaptive controller for chatter mitigation and productivity enhancement in CNC milling machines.Robot Comput Integr Manuf 40, 34-43 doi:10.1016/j.rcim.2016.01.006 |
| 10. | Kasashima N, Mori K, Ruiz GH, et al(1995)Online failure detection in face milling using discrete wavelet transform.CIRP Ann Manuf Technol 44(1), 483-487 doi:10.1016/S0007-8506(07)62368-3 |
| 11. | Suh CS, Khurjekar PP, Yang B(2002)Characterisation and identification of dynamic instability in milling operation.Mech Syst Signal Process 16(5), 853-872 doi:10.1006/mssp.2002.1497 |
| 12. | Tangjitsitcharoen S, Saksri T, Ratanakuakangwan S(2015)Advance in chatter detection in ball end milling process by utilizing wavelet transform.J Intell Manuf 26(3), 1-15 |
| 13. | Peng C, Wang L, Liao TW(2015)A new method for the prediction of chatter stability lobes based on dynamic cutting force simulation model and support vector machine.J Sound Vib 354, 118-131 doi:10.1016/j.jsv.2015.06.011 |
| 14. | Mann BP, Insperger T, Bayly PV, et al(2003)Stability of upmilling and down-milling, part 2: experimental verification.Int J Mach Tools Manuf 43(1), 35-40 doi:10.1016/S0890-6955(02)00160-8 |
| 15. | Altintaş A, Budak E(1995)Analytical prediction of stability lobes in milling.CIRP Ann Manuf Technol 44(1), 357-362 doi:10.1016/S0007-8506(07)62342-7 |
| 16. | Altintaş Y(2000)Manufacturing automation: metal cutting mechanics, machine tool vibrations, and CNC design Cambridge University Press, Cambridge |
| 17. | Addison PS (2002) The illustrated wavelet transform handbook. Taylor and Francis, Cambridge |
| 18. | Walker JS (1999) Wavelets and their scientific applications. Chapman & Hall/CRC, Cambridge |
| 19. | Cabrera CGA (2015) Chatter identification on end milling forces using wavelet analysis. Dissertation, Universidade Federal do Rio de Janeiro |