 2017, Vol. 5
The article information
- Liu Yung-Tien, Kuo You-Liang, Yan Da-Wei
- System integration for on-machine measurement using a capacitive LVDT-like contact sensor
- Advances in Manufacturing, 2017, 5(1): 50-58.
- http://dx.doi.org/10.1007/s40436-016-0169-y
-
Article history
- Received: 15 July, 2016
- Accepted: 27 December, 2016
- Published online: 18 February, 2017


Due to rapid developments in the photoelectric industry, the manufacture of high-precision optical components is more important. Usually, optical components such as consumer products of aspheric lenses are mass-producted through ultraprecision molds/dies. To ensure a qualified optical image, not only surface accuracy but also dimensional accuracy of the mold/die is required to achieve a high degree of precision. However, to precisely manufacture an ultraprecision mold/die, it usually takes several trials of compensation cuttings following the rough or first cutting for a workpiece [1, 2]. Conventionally, the machined workpiece has to be measured after unloading it from the chuck and performing a precision measurement with an expensive commercially available profiler [3, 4]. After measurement, the workpiece has to be carefully and precisely reloaded to the chuck and then the compensation cutting is conducted based on the form error obtained. However, this reloading work relies on a specially-trained technician. In addition, to obtain satisfactory form accuracy, it is likely that a number of compensation cuttings are required. To increase productivity, these kind of repetitive loading and unloading processes are hopefully avoided via an on-machine (OM) measuring system.
Regarding OM measurement, one of the most wellknown examples is the use of a vernier caliper to measure the diameter of a workpiece on a conventional turning machine. Without unloading it, the operator can compensate for the dimension of a workpiece by manually setting the necessary infeed or depth of cut according to the measured error. In reality, the work presented in this study is similar to the manual operation but with the major difference that the measurement is done automatically, and to a high-degree of precision. Since the OM measurement is very popular in conventional machining, it has been applied to recent ultraprecision machining. In early applications, an optical sensor using parallel beams was designed to measure the profile of large flat mirrors and the straightness of cylindrical mirrors [5]; a laser probe was integrated to a CNC machine to measure free-form surface profiles [6]. By means of contact measurement, a linear variable differential transformer (LVDT) equipped with air bearing was employed to construct an OM measuring system [7]. A high-precision displacement sensor with a sapphire microprobe was used to detect an aspheric grinding surface for compensation [8]. By combining both types of contact and non-contact sensors, a scanning probe measurement system was developed to achieve precise profile measurements of micro-aspheric surfaces [9]. In recent applications, the OM measurement still draws much interest in developing a measuring strategy for free-form surfaces [10]. Using the scanning type of point focus device achieves high-speed measuring performance for large free-form opticcal surfaces [11], and implements a scanning tunneling microscope-based device for measuring three-dimensional (3D) microstructures [12]. In this study, a commercially available air-bearing capacitive LVDT-like contact displacement sensor was mounted to a desktop ultraprecision machine tool to construct an OM measuring system. Compared with the non-contact measurement using optical devices, the contact measurement is inevitable for a measured target with a steep angle [3, 4]. Through the examination of a machined aspheric surface, the performance of the implemented measuring system is evaluated. In addition, technical details for constructing an OM measuring system are provided.
The OM measuring system presented in this study is a multidisciplinary engineering solution that includes aspheric machining, data filtration, and system integration of machine tool and sensor systems. In the next section, the Gaussian regression filter (GRF) used for determining the profile or mean line of measured data is introduced. Then, the system integration of the displacement sensor with the machine tool is described. A discussion is provided following the experimental examinations. Finally, the research results are summarized.
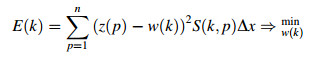
2 Gaussian regression filter 2.1 Expression of GRFFiltration is one of the essential techniques used in geometry metrology. It is the method by which the information of interest is extracted from the measured data, which usually contain the information of the high frequency of roughness, medium frequency of waviness, and low frequency of form or shape [13]. One of the popular filters is the Gaussian filter, which is capable of separating the measured information. However, the traditional Gaussian filter is subjected to drawbacks such as edge distortion, phase lag, and outlier distortion. To improve filtration performance, many modifications were reported such as using a linear filter, a polynomial regression curve, or a robust statistical estimate to eliminate the distortion [14]. In this paper, a zero-order GRF coupled with a modified weighting function is employed to obtain the form separated from the measured data. The zero-order GRF can be described by the following minimization problem [15, 16]:
|
(1) |
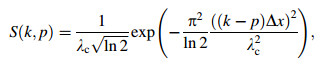
where z is the profile element, w the mean line element, n the number of points, k the index for the location of the center of the weighting function, p the index for profile points, Δx the spacing, and S the weighting function, given as
|
(2) |
where λc is the cutoff wavelength of the filter.
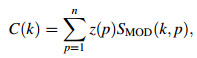
In the zero-order GRF, w(k) is simply a constant term denoted as C(k) that can be derived by minimizing E(k) in Eq. (1) and with the result as
|
(3) |
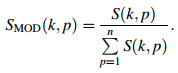
where the modified weighting function SMOD(k, p) is expressed as
|
(4) |
Therefore, the zero-order regression filter is equivalent to the convolution of the profile element z(p) and the modified weighting function.
2.2 Modification of edge distortionTo examine the filtration performances using the zeroorder GRF, the filtered result for a convex profile was compared to that obtained using the traditional Gaussian filter [17]. The weighting functions used for the traditional Gaussian filter and GRF are shown in Fig. 1, respectively. To use the Gaussian weighting function for convolution operation, the entry and exit portions in filtration process have to be truncated. As shown in Fig. 1a, the starting and ending locations of profile points for convolution operation were p=61 and p=1 114, respectively, and even the number of points was 1 237. On the other hand, the modified Gaussian weighting function shown in Fig. 1b can be used for full convolution operation without truncating the measured data, i.e., from the first point p=1 to the last point p=1 237. The filtered results using the two above-mentioned weighting functions are compared in Fig. 2. Although both results show that the mean line with small waviness could be obtained and the outlier of the measured data could be apparently removed, only the GRF shows improved performance in acquiring a complete profile without losing entry and exit data. In the filtration process, a large cutoff wavelength would miss the information of waviness and distort the mean line, whereas a small cutoff wavelength could not acquire an appropriate profile due to high noise level. The cutoff wavelength used for the filtration was λc=0.8 mm. The measure length was 12.37 mm with an equal spacing Δx=0.01 mm, thus the point number was n=1 237.

|
| Fig. 1 Gaussian weighting functions |

|
| Fig. 2 Comparison of filtered results |
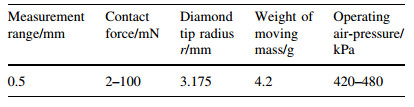
The sensor used for the OM measurement is a porous airbearing capacitive sensor with a diamond contact probe (Lion precision, USA). This device creates a highperformance, LVDT-like contact measurement system. A porous carbon bearing flows air around the probe's plunger. The air cushion provides friction-free movement and radial stiffness that minimizes side-loading effects when performing OM scanning for a target. The non-contact capacitive sensor measures position changes of a target on the internal end of the square shaft as shown in Fig. 3. The contact force ranging from 2 mN to 100 mN can be adjusted by regulating the contact air pressure. Major specifications of the capacitive-LVDT (C-LVDT) are listed in Table 1.

|
| Fig. 3 Air-bearing C-LVDT sensor (Lion precision) |
In this study, the OM measuring system was implemented with a desktop four-axis ultraprecision machine (Trider-X, from Nexsys Inc., Japan). The travel range along each linear axis (x-, y-, z-axes) is 100 mm. Each linear axis is driven by a servomotor coupled with a ball-screw transmission mechanism, and the straightness of linear guides is 2/80 lm/mm along x-and y-axes, and 7/80 lm/mm along z-axis. The feeding resolutions along the linear axes and rotational axis are 0.1 μm and 0.002 5°, respectively. To avoid disturbance from the operational environment, a passive vibration air table is fitted to the bottom of the machine tool.
3.3 System integration of machine tool and sensorFigure 4 shows the schematic of the configuration of measuring system. A field-programmable gate array (FPGA) module consisting of digital and analog input modules was employed to implement the measuring system. Since the algorithms of mathematical of operation and pulse counting are written into the FPGA module, the measuring system having high-speed performance is capable of acquiring the digital encoder signals (x-and z-axis) of the machine tool and analog sensor signal (Δz) of the C-LVDT sensor in real-time. A personal computer is linked to the FPGA module for data acquisition. The measured information is therefore recorded as (x, z + Δz) or (y, z + Δz).

|
| Fig. 4 System integration of machine tool and sensor |
The experimental setup and an aspheric mold to be measured are shown in Fig. 5. The diamond tool was mounted beside the sensor on a fixture such that the OM measurement could be conducted without unloading the workpiece. A CCD camera system was used to monitor machining and measuring processes.

|
| Fig. 5 Experimental setup and workpiece |
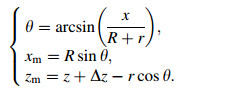
As described previously, the measured data is recorded as (x, z + Δz) or (y, z + Δz). However, to acquire an actual profile, the measured data has to compensate for the probe radius as shown in Fig. 6, where a probe having a radius r contacting with the aspheric surface z=f(x) having a curvature R is indicated. Theoretically, the measured coordinate is normal to the aspheric surface with a distance of r. For simplicity, the actual profile measured represented by (xm; zm) was derived based on the relation between the probe radius r and the curvature R of aspheric surface with the following relation

|
| Fig. 6 Compensation of probe radius |
|
(5) |
However, it is noted that the compensation would result in a substantial error for a large diameter of aspheric workpiece since the effect of aspheric coefficients is not considered in Eq. (5). Therefore, a standard sphere used for calibration is essential in practical application.
4 Experimental examinations 4.1 Fundamental examinationsTo examine noise level of the measuring environment, a fixed position and line travel measurements were tested. Figure 7 shows the measured results of fixed point and line travel measurements for an OFC workpiece with mirror surface obtained by face cutting. From the results, the noise levels were recorded as ±0.06 μm and ±0.1 μm for the fixed point and line travel measurements, respectively. However, referring to the mean line obtained by the GRF, as shown in Fig. 7b, the peak-to-valley (PV) value was only 0.055 μm. From these examinations, the best excellent measuring accuracy is expected to be ±0.1 μm. This is the same level as the feeding resolution of the machine tool.

|
| Fig. 7 Fundamental examinations for facial cutting |
To demonstrate the OM measurement, experiments were conducted for an OFC workpiece with a dimension of Φ 5 mm 9 13 mm via aspheric ultraprecision machining. The measuring process can be briefly presented in Fig. 8 and divided into the following steps:

|
| Fig. 8 Flowchart of on-machine measurement |
(ⅰ) Design a specific aspheric curve and execute ultraprecision machining.
(ⅱ) After machining, move the sensor probe to the center point of the machined surface.
(ⅲ) Make a slight contact of the sensor probe with the workpiece, and redefine the contact position as the origin of the machine tool.
(ⅳ) Perform cross scans along the x-and y-axes within a suitable range based on G-code operation.
(ⅴ) Determine the vertex of workpiece based on the results of cross scans, which will be detailed in the next section.
(ⅵ) Precisely redefine the vertex as the origin of the machine tool.
(ⅶ) Perform full range OM measurement based on G-code operation.
(ⅷ) The mean line is obtained via the GRF.
(ⅸ) The mean line is processed by tilt removal algorithm such that an aligned waveform can be obtained.
(ⅹ) The measured profile is obtained by compensating for the probe radius.
4.3 Determination of the vertex based on cross scanning methodIn reality, the scanning process of OM measurement for an aspheric surface is the same as the machining process but with different radii for G-code generations. Therefore, the moving paths for the machine tool to carry the cutting tool and the measuring probe are different. Since the cutting tool and the measuring probe are mounted at different positions on the same fixture, the reference origins for machining and measuring processes are distinct for G-code operation. Therefore, after aspheric machining, a new origin with respect to the center axis of workpiece for conducting the OM measurement has to be determined. In this study, a cross scanning method was employed to find the origin of measuring coordinate. Figure 9 shows the concept of the cross scanning method. Three separate profile scans in the neighborhood of the vertex of the workpiece were performed along the x-and y-axes. The origin was therefore defined by the average of peak values of the scanned profiles. Figure 10 shows the results of three scanned profiles obtained by the GRF. Since the peak values along the x-axis are at the absolute coordinate of (84.059 7, 84.046 5, 84.038 6) mm and at (8.891 7, 8.885 8, 8.886 0) mm along the y-axis, the new origin of workpiece for OM measurement was defined as (84.048 3, 8.887 8) mm.

|
| Fig. 9 Cross method for determining vertex |

|
| Fig. 10 Profile measurement for searching center point |
Following the measuring steps described previously, the OM measurement was carried out for a convex aspheric mold with a measured diameter of 5 mm and a curve height of 0.46 mm. The scanning speed was given as 5 mm/min. The measured result of (x, z + Δz) along the x-axis is shown in Fig. 11a with an amplitude of waviness of about 0.5 μm. The measured data were then processed by the GRF to derive the mean line determined as the measured profile. In the next step, the mean line was treated by tilt removal based on the least-square method for obtaining an aligned profile as shown in Fig. 11b. Finally, the profile measured was evaluated by compensating for the radius of probe tip. However, the evaluated diameter was reduced from 5 mm to 4 mm; therefore a large radius of 3.175 mm was adopted. This revealed the fact that a large radius of probe tip was not appropriate one for a small measured target with curvature. To improve the measuring performance, a much smaller radius of probe tip is required in further study. However, through the experimental examination, the function of OM measuring system using the airbearing C-LVDT sensor has been demonstrated.

|
| Fig. 11 Profile measurement through center point |
After examining the OM measuring function, the workpiece was unloaded from the chuck for the measurement using a commercially available profiler (Mitaka PF-60), which is a non-contact measuring device using the laser metrology and features the measuring accuracy of ±0.3 μm over the full range of 100 mm. The comparison between the OM and PF-60 measurements is shown in Fig. 12a. From the comparison, the PV deviation was calculated as 14.6 μm. In addition, the OM measured results was compared with the designed profile with the results shown in Fig. 12b. The PV form error was calculated as 19.2 μm with an error percentage of 0.48% (=19.2 × 10⁻³/4 × 100%) over the evaluated diameter of 4 mm. Referring to the form error and deviation shown in Fig. 12, it can be seen that the errors raised largely away from the center axis. This can be considered as due to the large probe radius also the method for radius compensation. Moreover, both comparisons show big deviations larger than ten microns. This implied that this process was greatly accompanied with the machining error and measurement error. Finally, the measured result obtained by the PF-60 was compared with the designed profile with a PV form error of 11.8 μm, as shown in Fig. 12c. Actually, the form error could be calculated by subtracting the deviation Zd shown in Fig. 12a from the form error Ze shown in Fig. 12b. Although all the comparisons indicated different shapes, they revealed the same concave form errors.

|
| Fig. 12 Comparisons of measurements for rough cutting |
To further examine the implemented measuring system, the measured form error obtained by the rough cutting shown in Fig. 12b was employed to perform the compensation cutting. Before compensation, the unloaded workpiece for the measurement using the commercial device was precisely reloaded to the chuck. The compensation result is shown in Fig. 13. The OM measured result was compared with that obtained from the Mitaka PF-60 with a deviation of 15.6 μm, as shown in Fig. 13a, and compared with the designed profile was with a PV form error of 9.7 μm, or an error percentage of 0.31% (9.7 9 10-3/3.1 × 100%) over the evaluated diameter of 3.1 mm, as shown in Fig. 13b. Therefore, the form error was reduced from the error percentage of 0.48% in the rough cutting to 0.31% in the compensation cutting, i.e., with a percentage improvement of 35.4% ((0.48-0.31)/0.48 9 100%) in form accuracy. In addition, the measured result obtained by the PF-60 was compared with the designed profile with a PV form error of 10.8 μm, as shown in Fig. 13c. However, significant improvement in the form accuracy could not be found since the compensation was performed according to the OM measured data. Based on the comparisons, the effectiveness of the compensation cutting was thus demonstrated through the implemented OM measuring system.

|
| Fig. 13 Comparisons of measurements for compensation cutting |
Through experimental examinations, the proposed OM measuring system using the air-bearing C-LVDT contact sensor has been demonstrated as an effective system. However, it exhibited a big deviation larger than ten microns in form accuracy compared with that obtained using the commercial device. The main reasons can be considered as follows:
(ⅰ) A large radius of the contact probe (3.175 mm) was inappropriate to measure a small target with curvature.
(ⅱ) Although the contact force of measuring probe could be adjusted as small as 2 mN, practically, it was difficult to maintain a small constant contact force due to low air pressure.
(ⅲ) Using the contact measurement for a soft OFC workpiece would prone to resulting in form error.
(ⅳ) System calibration with a standard sphere was not performed prior to the OM measurement.
Although the proposed system has been demonstrated as an effective device, further performance improvement is expected by means of reducing the radius of contact probe and measuring force, and calibrating the system using a standard sphere.
6 SummaryIn this study, the OM measuring system using the C-LVDT contact sensor was proposed. Through experimental examinations, main results can be summarized as follows:
(ⅰ) The zero-order GRF was effectively implemented to draw the profile from the measured data.
(ⅱ) The OM measuring system was successfully constructed that might acquire displacement signals of the machine tool and displacement sensor through the FPGA module.
(ⅲ) Experimental examinations for the OM measurement were performed for an aspheric mold having a diameter of 5 mm and curve height of 0.46 mm. By comparing the measured result with that using the commercial device, a deviation larger than ten microns was recorded.
(ⅳ) Compensation cutting was performed based on the OM measured data. The PV form accuracy was measured as 9.7 μm and with an improving percentage of 35.4% in form accuracy due to compensation cutting.
Although the machine tool used is with the feeding resolution of 0.1 μm only, the implemented system has been demonstrated as an effective system which can be applied to meso-machining process with less expense in measuring facility. Further performance improvement is expected to reduce the radius of contact probe and measuring force, and calibrate the system using a standard sphere.
| 1. | Liu YT, Chang WC, Yamagata Y(2010) A study on optimal compensation cutting for an aspheric surface using the Taguchi method. CIRP J Manuf Sci Technol 3(1), 40-48 doi:10.1016/j.cirpj.2010.03.001 |
| 2. | Liu YT, Zhang L(2016) An investigation into the aspheric ultraprecision machining using the response surface methodology. Prec Eng 44, 203-210 doi:10.1016/j.precisioneng.2015.12.006 |
| 3. | http://www.taylor-hobson.com/. Accessed 15 July 2016 |
| 4. | http://industrial.panasonic.com/jp. Accessed 15 July 2016 |
| 5. | Kiyono S, Gao W, Kamada O(1992) On-machine measurement of mirror profile-measurement principle and basic performance of the developed sensor. Jap J Prec Eng 58(2), 247-252 doi:10.2493/jjspe.58.247 |
| 6. | Fan KC(1997) A non-contact automatic measurement for freeform surface profiles. Comput Integr Manuf Syst 10(4), 277-285 doi:10.1016/S0951-5240(97)00020-7 |
| 7. | Suzuki H, Kodera S, Sugimoto K, et al(1995) Development of an on-machine aspherical form measurement system. Jpn J Prec Eng 61(11), 1594-1598 doi:10.2493/jjspe.61.1594 |
| 8. | Chen FJ, Yin SH, Huang H, et al(2010) Profile error compensation in ultra-precision grinding of aspheric surfaces with onmachine measurement. Int J Mach Tools Manuf 50, 480-486 doi:10.1016/j.ijmachtools.2010.01.001 |
| 9. | Arai Y, Shibuya A, Yoshikawa Y, et al(2008) Online measurement of micro-aspheric surface profile with compensation of scanning error. Key Eng Mater 381-382, 175-178 doi:10.4028/www.scientific.net/KEM.381-382 |
| 10. | Li B, Li F, Liu H, et al(2014) A measurement strategy and an errorcompensation model for the on-machine laser measurement of large-scale free-form surfaces. Meas Sci Technol 25(1), 303-309 |
| 11. | Morita S, Yamagata Y, Guo J(2014) High speed non-contact onmachine profile measurement for ultrahigh precision machining of large free-formoptical surface. J Jpn Soc Abras Technol 58, 705-709 |
| 12. | Zhu WL, Yang S, Ju BF, et al(2015) On-machine measurement of a slow slide servo diamond-machined 3D microstructure with a curved substrate. Meas Sci Technol 26(7), 075003 doi:10.1088/0957-0233/26/7/075003 |
| 13. | Raja J, Muralikrishnan B, Fu S(2002) Recent advances in separation of roughness, waviness and form. Prec Eng 26(2), 222-235 doi:10.1016/S0141-6359(02)00103-4 |
| 14. | Lou S, Zeng W, Jiang X et al (2012) Comparison of robust filtration techniques in geometrical metrology. In:Proceedings of the 18th international conference on automation & computing, 8 September, Loughborough University, Leicestershire |
| 15. | Brinkmann S, Bodschwinna H, Lemke HW(2001) Accessing roughness in three-dimensions using Gaussian regression filtering. Int J Mach Tools Manuf 41(13), 2153-2161 |
| 16. | Brinkmann S, Raja J (2009) Computational surface and roughness metrology. Springer, New York, pp 67-76 |
| 17. | Krystek M(1996) A fast Gauss filtering algorithm for roughness measurements. Prec Eng 19(2-3), 198-200 doi:10.1016/S0141-6359(96)00025-6 |