 2016, Vol. 4
The article information
- Bellmann J., Lueg-Althoff J., Schulze S., Gies S., Beyer E., E. Tekkaya A.
- Measurement and analysis technologies for magnetic pulse welding: established methods and new strategies
- Advances in Manufacturing, 2016, 4(4): 322-339.
- http://dx.doi.org/10.1007/s40436-016-0162-5
-
Article history
- Received: 6 June, 2016
- Accepted: 1 November, 2016
- Published online: 30 November, 2016


2 Fraunhofer Institute for Material and Beam Technology, Winterbergstrasse 28, 01277 Dresden, Germany
3 Institute of Forming Technology and Lightweight Construction, TU Dortmund, Baroper Strasse 303, 44227 Dortmund, Germany
Magnetic pulse welding (MPW) uses the controlled impact of two metals to create strong atomic bonded areas and was patented in 1970 by Lysenko et al. [1]. Due to the absence of external heat input, even dissimilar metals can be joined without the formation of critical brittle inter metallic phases. The acceleration of the workpiece before the impact is realized via a tool coil that generates a magnetic pressure. Compared to explosion welding (EXW), the security requirements are lower and the pro cess is clean since no explosive substances or residues are present. This offers a clean and safe way to weld cylin drical parts as well as sheets in overlap configuration. The demands on geometrical tolerances, e.g., for the acceler ation gap and sheet thickness are quite low compared to other welding techniques [2]. The equipment for this process is commercially available and reliable, which is opening up new prospects for the technology within industrial line production.
To ensure a stable impact welding process in produc tion, the impact conditions have to be adjusted. The most important parameters are the collision angle β and the impact velocity vi that can be simulated in cannon-exper iments [3] and other mechanical apparatuses [4]. These modeled impact conditions have to be transferred to the impact welding process. Since the magnetic pressure changes over time, this step is quite complex compared to EXW. Numerical simulations [5] support this adjusting procedure, but they have to be verified or calibrated by measurements. Moreover they are often simplified and not taking surface conditions [6] and coatings into account [2]. Furthermore, the correlation between the impact conditions and the weld properties requires suitable analysis methods. Although MPW is a complex multiphysic joining procedure, an all-purpose tool for recording all the relevant physical values is not available. There are certain high speed testing methods developed for MPW that are based on electrical or external optical signals [7]. Due to the very short process durations of a few microseconds, a time resolution of several million counts per second is needed. Using the example of tubular MPW, Fig. 1 depicts the specific locations, where physical values can be gathered. Most of the measuring techniques can similarly be used for sheet welding with magnetic pulses. Regardless of the joining geometry, there are three challenges remaining that prevent the detailed study of the impact and welding procedure: limited accessibility to the joining zone due to overlap configuration, interferences of the magnetic fields with any electrical output signals, and very short process durations of few microseconds.

|
| Fig. 1 Measuring points for capturing of: Ⅰ current, Ⅱ magnetic field, Ⅲ flyer movement and strain, Ⅳ optical access for imaging, Ⅴ plastic deformation, temperature, pressure and contact assessment, Ⅵ jet residues and temperature, collision angle β and collision velocity vi |
To overcome these challenges, new optical measuring methods are presented in the first half of this paper taking advantage of the impact flash and the flyer deformation velocity. In contrast to mechanical methods, these approaches do not influence the process itself and meet the requirements concerning temporal resolution. Nevertheless, new mechanical methods are introduced providing insight into the welding interface and its mechanical properties. This paper shall provide an overview of existing and new analysis methods applicable for MPW. It includes useful tools for the user to setup and monitor the MPW process and detect the most common reasons for an unsuccessful welding result. The qualification of a weld seam can be done in many different ways based on existing testing procedures [8]. These methods are often standardized and thereby not in the focus of MPW [9-11]. The intention of the second part of this paper is to describe the most suitable methods for weld seam characterization and their adaption for MPW joints, allowing for a proper process development and quality assurance.
2 Analysis of the MPW process 2.1 Review of existing technologiesIn order to investigate and monitor the physics behind the MPW process, many analysis methods were developed in the past. The following paragraph gives an overview.
2.1.1 Current measurementThe discharging current in the tool coil determines the magnetic field intensity with respect to the coil dimensions, the induced eddy currents in the conductive part nearby, and the formation of the accelerating Lorentz forces. Therefore, two characteristic values should be evaluated in order to estimate the magnetic pressure acting on the flyer part:
(ⅰ) The frequency of the damped sinusoidal current should be adapted to the material’s electrical conductivity to assure a skin depth below the flyer thickness. This guarantees a maximum pressure difference between the front and back of the flyer and thus a maximum flyer acceleration.
(ⅱ) The impact of both parts should occur around the first current peak to take advantage of the maximum magnetic pressure for the joint formation during the impact. Therefore, the charging energy of the capacitors can be adjusted affecting both the maximum current and the magnetic pressure, respectively.
“Rogowski” pickup coils with RC integrator are suitable for measuring the current in this application since they show good performance and accuracy at high frequencies and high amplitudes [12]. They require no changes in the electrical circuit and do not affect the current to be measured. The obtained current-vs.-time curves serve as input for analytical or numerical calculations. Figure 2 depicts the measured current curves for two discharge frequencies as an example.

|
| Fig. 2 Current vs. time for 7 kHz and 21 kHz discharging pulses |
The knowledge of the field intensity at different positions of the tool coil during the discharge is necessary to calculate the magnetic pressure and thus the acceleration of the workpiece. For the measurement of the magnetic field in the active zone of the coil, induction coils cannot be used due to interference effects resulting from the sensor’s electrical connections. Using a hall-sensor is an alternative with less interference problems if it is combined with a setup for the elimination of the induced voltage in the hallcircuit, as described by Dietz and Lippmann for compression coils [13]. Instead of a workpiece, they insert an aluminum cylinder into the coil with the hall-sensor placed in an axial groove. The influence to the magnetic field is negligible since the groove’s area is small compared to the isolation gaps and the slot.
2.1.3 Measurement of the displacement of the flyer partAs explained before, the flyer deformation velocity vr and especially the velocity at the time of impact vi are crucial parameters for welding success in MPW processes. For this reason, a direct measurement of the flyer deformation is desirable. However due to the process characteristics mentioned in Section 1, this task is challenging. Moreover, a simple application and evaluation is desired by users. Over the last decades, several measurement systems have been developed, each having their own advantages and drawbacks.
(ⅰ) Laser velocimeter based on shadowing
Optical measuring principles are generally suitable for application in electromagnetic forming and joining processes like MPW, because they are insensitive to the electromagnetic fields. In the 1960s, a measuring setup was presented which was based on the shadowing of parallel light by the deformation of the workpiece [14]. In tube compression, for instance, the lateral contraction at the narrowest cross section could be determined. As can be seen in Fig. 3, a laser beam is parallelized by a lens and guided through the gap between the workpieces. When the flyer gets compressed by magnetic forces, the amount of light received by a coaxially mounted position sensitive device (PSD) decreases. The PSD converts the received quantity of light into a corresponding voltage signal which is proportional to the radial compression at the narrowest cross section. In the case of MPW, the flyer tube velocity can thus be recorded before impact.

|
| Fig. 3 Principle of shadowing technology for tube compression with flyer deformation velocity vr at measuring point z=0 (according to Ref. [15]) |
The big advantage of this velocimeter is its attractive price and easy handling. Veenaas et al. [16] introduced a custom-made velocimeter which allowed the determination of the deformation velocity of laser shock stretch drawn miniature cups with an uncertainty of below 2.5%.
(ⅱ) Photonic Doppler velocimetry
The photonic Doppler velocimeter (PDV), a device for measuring the velocities of moving workpieces up to few kilometers per second, was developed at the Lawrence Livermore National Laboratory in Livermore, CA, and was first presented by Strand et al. [17]. It is a heterodyne technique based on the superposition of light signals. The basic setup can be seen in Fig. 4.

|
| Fig. 4 Setup of PDV-system (according to Ref. [17]) |
A laser source emits a coherent beam with known frequency f0. The beam can be split up into several subbeams. The light is guided through a circulator and partly sent through a probe onto the workpiece. If the workpiece moves, the frequency of the reflecting beam gets Dopplershifted. The shifted frequency fd for a specific workpiece velocity v(t) can be calculated as
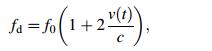
where c is the speed of light. The reflected beam is recorded by the probe and also guided through the circulator into a detector. By superposition of the original, unshifted beam and the reflected beam the time dependent beat frequency fb(t) can be calculated
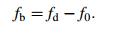
Since the frequency shift is proportional to the velocity of the workpiece, fb(t) can be converted into a functional description of the workpiece velocity v(t)
where λ0=c/f0. For the analysis of the beat frequency short-time Fourier transforms are commonly used.
The PDV technology has been presented as an alternative to velocity interferometer system for any reflector (VISAR) [18] and Fabry-Pérot [19] systems, being cheaper, easier to use, and more compact [17]. Since the PDV is based on fiber optic components, it is unaffected by electromagnetic fields, which makes it attractive for the analysis of the flyer deformation and thus the impact velocity vi in MPW processes. The laser beam must be guided perpendicularly onto the measuring surface. In early publications, such as Ref. [20], the flyer velocity in sheet MPW was measured by PDV probes integrated into the stationary parent part. For measuring the velocity of tubular flyer parts, miniature (collimator style) PDV probes can also be integrated into the concentration zone of the coil or field shaper [21]. Figure 5 shows a typical PDV raw signal and the respective velocity curve of the flyer during MPW. Disadvantages result from the fact that invisible laser light (wavelength typically 1 550 nm) is used, making it difficult to align the probes as well as being a potential health hazard. In Fig. 5a, a second weaker signal is visible besides the beat frequency. This signal, which is an integer multiple of the beat frequency, occurs due to multiple reflections of the laser beam [21]. But since the intensity of the real signal is much higher, this causes no problems for the analysis.

|
| Fig. 5 Results of PDV measurement a spectrogram of the flyer deformation during MPW, b conversion into velocity course |
High speed imaging methods have been used for the in situ evaluation of the forming behavior at high velocities for decades [22]. With this technique, the process kinematics can be enlightened. To obtain impressive visual recordings, high speed cameras with sufficient frame rate and resolution are needed, which are exceptionally expensive. Figure 6 demonstrates the sheet acceleration and the impact process with 300 000 frames per second and an illumination laser or flash, respectively.

|
| Fig. 6 a-d High speed images of the accelerated flyer sheet due to the magnetic pressure coming from the left, impacting the parent sheet (right) within time steps c and d, e experimental setup with magnetic pressure coming from below |
Watanabe et al. [23] used a charge-coupled device camera with 1 million frames per second for a process observation in steps of 1 ls. They recorded the sheet MPW process from two directions, as depicted in Fig. 7. The flash is necessary for the illumination of the picture. With the camera positioned in the welding direction (see Fig. 7a), the deformation velocity of the flyer plate before impact can be measured. The other direction (see Fig. 7b) provides information about the impact geometry between the two partners. Beginning from the central point of initial impact, the two-way movement of the collision lines can be visualized, as well as the dynamic impact angle β, as presented by Rebensdorf and Boehm [24]. However, it should be noted that the real welding process starts in the central region of the plates, which cannot be observed by a camera. The problem of accessibility of the welding zone is naturally occurring in MPW of tubular parts. Hence only the perspective in the welding direction can be chosen here, with limited information available. For all geometrical setups in MPW, the emission of flashes from the impact lines becomes visible, which is believed to be the jet consisting of surface particles from both joining partners [23]. Sometimes the glare hinders the evaluation of the pictures. For this case, Pabst and Groche [25] suggested to use optical bandpass filters and investigated the influence of surrounding media on the jet and process glare formation by high speed imaging.

|
| Fig. 7 Observation directions in sheet MPW process a in welding direction, b perpendicular to the welding direction (according to Ref. [23]) |
In pin-contactor tests [26] or during the wire contact method [15], an electrical circuit is closed by the contact of the flyer workpiece with contactor pins or wires that are distributed in the forming area. These methods have advantages for locations where optical methods are not applicable, e.g., undercuts. To generate a displacementtime curve for discrete time values, a number of repeated experiments with different geometrical setups have to be performed. Both methods are thus elaborate and time consuming. To reduce the experimental effort, Gafri et al. [7] used flexible wrappings with varnish-coated filaments that are placed on the surface of the parent part. During the welding process, the contact point travels over each electrode and cracks the insulation due to the high pressure in the joining zone. This shorts the electrical circuit to the ground and generates an electrical signal that can be referred to the starting point of the current measurement. The accuracy of this axial velocity probe is determined by the mechanical properties of the filament, since it acts as an additional layer and may influence the basic welding parameters.
2.1.6 Analysis of the jet compositionThe appearance of the material flow called “jet” is a prerequisite for the establishment of a sound weld [27]. It is a consequence of the high local pressure at the collision point which exceeds the dynamic elastic limit of the material. Under the correct impact angle, the deformation results in a material flow that causes the breakup of the contaminant surface films. The prevailing high contact pressure finally leads to atomic bonding between both virgin metal surfaces. Depending on the material’s properties and the impact conditions, the jet composition varies. Jet residues can be analyzed with optical methods directly at polished cross-sections (see Fig. 8). Stern et al. [27] expanded these methods with energy-dispersive spectrometry. Instead of enabling the jet collection by a specific sample design, Kakizaki et al. utilized a glass plate for absorbing the jet particles [28]. Bergmann found that during EXW a significant portion of material was removed [29], which was confirmed for MPW, too [27].

|
| Fig. 8 Jet residues behind the welded zone with a weld length of 4.4 mm |
Due to the mentioned advantages of optical methods for the characterization of the flyer deformation and the impact process, the authors customized several optical methods for the analysis of MPW with tubular partners. The quality of the signals was improved significantly compared to the contact measurements mentioned before. Furthermore, new mechanical measuring techniques are introduced to investigate the material flow in the welding zone.
2.2.1 Optical sensor for flash detectionHypervelocity impact flashes are well known phenomena that have been explored for several years. Using the ionization associated with the impact, the properties of cosmic dust particles or meteoroids were studied intensively [30]. Furthermore, the primary impact velocity and the projectile mass are in correlation with the light intensity and the total light energy, as suggested by Eichhorn [31]. Measurements with spectrometers to evaluate the temperature of the radiating material is also performed in Ref. [31]. All these effects can be used for observation and diagnosis of impact phenomena in different fields of research. The hypervelocity impact flash during MPW is often only described as a negative effect because it would hinder process analysis [7, 25]. In the following paragraph a new approach is described that takes advantage of the flash instead of fading it out. The recording of the light emission with a simple silicon phototransistor (SDP8405, Honeywell) is used to evaluate the temporal point of impact (see Fig. 9a). Therefore, the optical signal is submitted with a polymeric optical fiber (POF, diameter 1 mm, length 4 m, by Telegaertner Geraetebau GmbH, Germany) to the phototransistor. It acts as an optical/electrical converter and thus generates a signal that can be referred to the current signal from the tool coil on the oscilloscope. The applicability and accuracy of this setup is shown in Fig. 9b.

|
| Fig. 9 Impact flash detection via Phototransistor a schematic, b Light intensity (0 V darkness, [0 V lightning) in relation to radial flyer velocity and tool coil current-vs.-time with charging energy E=10.2 kJ |
The flash detection enables the user of MPW to monitor the most important process parameters without needing complex devices. Those parameters are
(ⅰ) Correct part alignment. If the parts are not axisymmetric (see Fig. 10), or the coil has an irregular magnetic pressure distribution, the time of impact differs around the circumference. This can be monitored with two or more measuring devices. Furthermore, the duration of the flash gives important information about the impact duration. Figure 11 illustrates the differences in the flash appearance and duration with respect to the charging energy. Therefore, the duration until the end of the flashes shown in Figs. 9 and 10 was measured.

|
| Fig. 10 Control of part alignment via phototransistors a schematic b light intensity (0 V darkness, [0 V lightning) in relation to tool coil current vs. time with charging energy E=3.9 kJ |

|
| Fig. 11 Influence of the charging energy on the flash appearance time and duration |
(ⅱ) Process development and adjustment. To ensure the correct impact conditions for MPW, experimental work is essential for the verification of analytical and numerical calculations. The impact should occur around the first current peak (see Fig. 9), as explained previously. If this is not the case, more energy or a different pulse characteristic is needed. For the detailed evaluation of the deformation behavior it is necessary to conduct a small series of experiments. While varying the gap a and recording the impact times, the flyer deformation velocity vr can be estimated (see Fig. 12a). Placing two or more phototransistors in drilled holes of the parent part generates a sequence of OFF-ON-OFF signals that are in correlation with the axial velocity of the collision front vc.

|
| Fig. 12 Measurement of deformation-vs.-time in two directions for evaluation of a flyer deformation velocity vr and b axial velocity of the collision front vc |
The integration of PDV probes into the fieldshaper and coil, as presented by Jaeger and Tekkaya [21], was expanded so that three probes could be used simultaneously (see Fig. 13). The three measuring positions are axially staggered, so that the flyer displacement at three discrete points can be recorded. Via a comparison of the times of impact, an approximation of the axial velocity of the collision front vc becomes possible.

|
| Fig. 13 One-turn coil with three integrated PDV probes |
In cases where the integration of PDV probes into the coil or fieldshaper is not possible, the access to the flyer tube surface can be provided from the inside. A focuser PDV probe, which has a much higher measuring distance than a collimator probe, is used for a periscope setup presented in Ref. [32]. The laser beam is deflected by 90° by a small gold-coated mirror (see Fig. 14b). By integrating small radial bore holes into the parent part, the laser beam can be directed onto the inner flyer surface and used for determination of its velocity. Moreover, the same system can be used for detecting deformations of hollow (tubular) parent parts (see Fig. 14a). For many applications, a reduction of the parent part diameter is unwanted, but the parent wall thickness sp should be reduced as much as possible in order to save weight. By the use of the system, elastic and plastic deformations of the parent part as well as possible inaccuracies of the relative positioning between the joining partners can easily be detected.

|
| Fig. 14 a Setup for simultaneous measuring of flyer and parent deformation, b periscope PDV setup (according to Ref. [32]) |
Another possible application of PDV for MPW purposes is the assessment of the acting pressures during compression of the flyer and the impact phase. With regard to Newton’s 2nd law, the pressure p acting on a rigid body can be estimated from its momentary acceleration
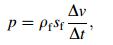
where qf indicates the mass density of the flyer material and sf is the flyer wall thickness. The acceleration Δv/Δt can be derived from the PDV-measured velocity curve (see Fig. 15). By this simplified method, the acting magnetic pressure on the flyer during the free forming phase can be accessed.

|
| Fig. 15 Analysis of the PDV curve for determination of the acting pressure |
Similarly, the pressure during impact can be analyzed with the help of the PDV. In this case, the deceleration phase has to be considered.
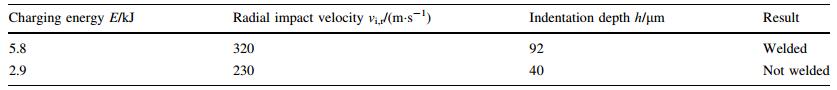
2.2.3 Indentation pin for assessment of kinetic flyer energyThe impact velocity vi is one of the key parameters for MPW and has to be sufficient for jet establishment and generation of the impact pressure. The flash measurement described above only gives information about the initial collision time and velocity, not about the evolution of the radial impact velocity vi, r along the weld front propagation, where vi, r is the component of the collision velocity vi perpendicular to the parent surface. If the energy of impact gets too small after a certain length, the welding process will stop, although the flash is still visible. To fill this knowledge gap, another simple tool was utilized and tested. This purely mechanical method presented in Fig. 16 serves to identify the local distribution of the impact energy along the joining area. Therefore, the flyer hits a pin that is positioned in a drilled hole inside the wall of the parent part. The pin gets accelerated and penetrates an indentation material that is softer than the parent. The depth h of the indentation mark can be correlated with the impact energy of the flyer using the equations proposed in Refs. [33, 34] that describe the expansion of a spherical indentation under hypervelocity impact and under constant pressure respectively.

|
| Fig. 16 Setup for evaluation of the flyer part’s local kinetic energy |
Experiments with constant impact velocity vi, r, but varied flyer thickness sf proved the assumption of deeper indentations when using thicker flyers. The mathematical correlation between the kinetic flyer energy 
|
Assuming an homogenous flyer thickness and density, the calibrated indentation marks serve to estimate the collision energy at positions that are normally difficult to access. This is primarily the area of the field shaper slot where no PDV probes can be placed. However, this point is of great importance since it determines the minimum energy that is needed to guarantee a complete circumferential weld seam [2]. The smaller indentation marks in Fig. 17 illustrate the reduced impact energy due to the slot effect for different flyer thicknesses for an exemplary tube diameter of 40 mm.

|
| Fig. 17 Influence of the coil position on the indentation depth h for different flyer thicknesses Sf with constant radial impact velocity vi, r of 350 m/s at 180° (based on experiments of Fig. 16) |
Depending on the weld front propagation [35], the impact energy also varies in axial direction. Placing the pins at positions along the potential weld zone finds the most efficient regime with respect to the applied materials and the intended weld length. Comparing the indentation depth h at specific points along the welding zone is a simple method that helps to evaluate the impact energy and to systematically detect dispositioning of the flyer or parent parts.
2.2.4 Grooves and patterns for strain measurementMPW is a joining technique based on plastic deformation. The surface enlargement enables the breaking of cover layers and reveals virgin and reactive surfaces. It is therefore important to include strain measurements in the process monitoring of MPW.
Methods of digital image correlation (DIC) have gained enormous importance for the analysis of forming processes [36]. The subsequent strain measurement of deformed specimens by optical metrology requires a reliable application of the measurement pattern onto the sheet or tube surfaces. Erlenmaier et al. [37] showed that spray coating is not suitable for the conditions of electromagnetic sheet forming, as the coating detaches during the high velocity deformation and clashes with a die. Electrolytic etching can be an alternative for steel workpieces, but for aluminum parts etching would not give a contrast sufficiently high enough for subsequent strain analysis. The authors suggest to apply the regular pattern by a marking laser. Provided the beam intensity is chosen adequately, this technique allows for a reliable and durable high-contrast patterning, suitable for the analysis of electromagnetic forming and joining processes.
A hands-on method for the visioplastic determination of the elongation during MPW is the introduction of scratch marks in defined distances into the outer flyer surface prior to the process. During free compression and impact, the distances between the marks change and can be used for measuring local elongation. In Ref. [35] the influence of the working length lw on the elongation of the outer flyer surface (see Fig. 18) and the interfacial shear stresses between the joining partners was presented. The working length lw is defined by the axial overlap between the flyer and the field shapers concentration zone.

|
| Fig. 18 a Scratch marks on outer flyer surface, b measured elongation of the flyer depending on the working length lw (according to Ref. [35]) |
The surface enlargement and material deformation is often clearly visible because of a wavy interface [27]. Since a wavy interface is no mandatory demand for a sound weld [2], other techniques have to be applied for the visualization of the material flow in planar interfaces. Bergmann [29] implemented a copper layer on one of the joining partners and analyzed the reduction of this layer due to the jetting effect. This works quite well for the combination of similar materials, but does not illustrate the material flow in the welding area of dissimilar materials, because the proper etching preparation of samples out of dissimilar materials is difficult. Therefore, a new method was applied that takes advantage of the brittleness and good visibility of anodized layers. These layers that are applied on the aluminum flyer part, get broken or moved to another location during the process and can clearly be identified afterwards. Figure 19 is a visualization of the influence of the radial collision velocity vi, r on the anodized layer. The material flow in Fig. 19b in the aluminum end section and the surface enlargement due to jetting is distinctive compared to a lower radial collision velocity vi, r (see Fig. 19a). Using colored anodized layers will also help to match the movement depending on the axial position of the coating. Although welding is hard to obtain with an anodized layer [2], this method is suitable for the monitoring of the material flow and fosters a deeper understanding of the MPW process.

|
| Fig. 19 Joining zone between anodized aluminum EN AW-6060 and steel C45 for different radial collision velocities vi, r with welding direction from left to right |
Like in most industrialized processes, the correlation of the process parameters and the process result should preferably be performed without interrupting the process. In Section 2, several ideas on how this correlation can be done by measurement technology were presented. Nevertheless, the subsequent evaluation of the welding result needs to be done. The respective methods can be divided into two groups: destructive (DT) and non-destructive (NDT). Mostly, only a combination of different DT and NDT methods allows a reliable assessment of the weld quality.
3.1 Review of existing destructive testing technologiesIn order to gain reliable information about the joint quality, destructive testing methods are applied, which lead to irreversible damage to the tested specimen. Depending on the geometry of the welded specimens, a broad variety of testing methods have been developed. The choice of the appropriate test depends on the loading of the part or structure in service life. Currently no standardized testing procedures for MPW joints exist, so that researchers refer to tests for conventionally joined specimens. Selected widespread methods are described in the following.
3.1.1 Burst testThe burst test is a DT testing method for hollow parts filled with gases or liquids, similar to those specimens described for the leakage test, see Section 3.3.1. However, in case of burst testing, the capability of the part and thus the weld seam of bearing high internal pressures is checked. The inner pressure is raised until a failure in the base material or the weld seam occurs [38]. The same setup can be used for long term alternating pressure tests.
3.1.2 Lap shear testAs explained previously, MPW can only be applied in overlap configuration. That is why lap shear testing by tension is a common test method. Lap shear testing is a standardized test for adhesives, the principle can be seen from Fig. 20a. The weld seam undergoes a shear load, which is usually applied in a standard tensile testing machine. An offset in the centerline of the welded zone and the acting force has to be leveled during the clamping of the specimen, e.g., by spacers. The maximum force is divided by the shear area, defining the maximum shear stress. A design allowing for enduring maximum shear load guarantees the highest joint quality. A fracture in the base material, as shown in Fig. 20c, is evidence of a sound weld seam.

|
| Fig. 20 Lap shear test a principle, b failure in the weld seam due to prepared notch, c failure in the base material aluminum, d failure in the weld seam due to low strength -P403 according to DIN EN ISO 6520-2 [39] |
The peel test is a standard test for the determination of the joint strength of adhesive joints or spot welds. A multitude of testing setups exist. They differ in the angle and the way one layer is peeled off the other [40, 41]. One example is shown in Fig. 21. Small kerfs are cut into one joining partner and material strips are peeled off the other joining partner. Very often peel tests are used as simple, non instrumented “workshop” tests, applied with pliers on a bench vise (see Fig. 21b). In advanced setups, the peeling force or torque is recorded. This test is mostly used qualitatively in order to compare different specimens or to access, if the weld is stronger than the base material [42]. Moreover, peel tests are applied to check the uniformity of the weld formation around the circumference of cylindrical specimens (see Fig. 21b).

|
| Fig. 21 Peel test a according to DIN 53 281 [41], b tested MPW specimen |
For welded tubular specimens, the capabilities of bearing axial forces are of importance for the design of structures. Hence, pull-out and push-out tests, which only differ in the direction of the force transmission, are reasonable DT methods for those parts. Figure 22a is the principle of the pull-out test. The force is applied until failure of the connection due to either rupture of the weld seam (e.g., Fig. 22b) or damage of the base material. The recording of the force-displacement curve allows a detailed analysis.

|
| Fig. 22 Pull-out test a principle, b pulled specimen -insufficient weld strength P403 according to DIN EN ISO 6520-2 [39] |
Two general principles exist, how torsion loading can be used to characterize the weld seam. For tubular parts designed for torque transmission (shafts), the whole structure should be tested regarding its load bearing capabilities. Figure 23 illustrates two possible failure types that both indicate a good weld quality: buckling of the tube and cracking next to the welded zone.

|
| Fig. 23 Welded shafts after static torsion testing a buckling (Al-Al) or b crack next to the welded zone (Al-St) |
Raoelison et al. [43] presented a torsion-based method allowing the determination of the welded length. Small strips are cut axially from the specimen. The strips are then subjected to manual torque in the overlapped plane leading to a break of the interface (see Fig. 24). The quality of the weld can be assessed from the amount of residue sticking to the parent part and the length of the weld seam can be measured. In the case of poor welding, no residual flyer material sticks to the parent part.

|
| Fig. 24 Torque test in the overlapped plane of magnetic pulse welded metal strips (according to Ref. [43]) |
Microscopic investigations use sectional views of the weld seam, which are prepared by mechanical (e.g., grinding, polishing) and chemical (e.g., etching) methods. A broad variety of microscopes with different physical operating principles and specific advantages are commercially available and can be applied for the analysis of MPW specimens [44]. Starting from simple surveying of weld seam lengths and an investigation of the appearance of the weld zone (see Fig. 25a), a multitude of analysis methods have been developed. Those methods comprise enhanced examinations of the grain size at the interface and in the base materials [44] or the determination of the chemical composition of interlayers [45]. For MPW, especially the characteristic wavy appearance of the interface has attracted the interest of metallographers [46, 47] (see Fig. 25b). Moreover, researchers look for indications to prove or disprove the hypothesis that the weld formation during MPW is governed by local melting processes at micro-and nano-scales [45, 48].

|
| Fig. 25 Microscopic images of an MPW aluminum-steel-interface with a weld length of 5.1 mm |
Hardness testing methods have been used for the characterization of materials for more than a century. Most experimental methods are based on the indentation of the sample material by a hard tool under predefined conditions. Depending on the size of the indentation, the hardness of the sample material can be determined. Besides macroscopic indentors for the determination of the global hardness, the microhardness can be determined by smaller indentors. The hardness of a material can be used as an indicator for the strength of a metal [49]. Moreover, the strength is closely related to the grain size (hall-Petch relationship): finer grains lead to an increase of the strength. Zhang et al. [50] joined two parts of EN AW-6061-T6 via MPW and found a hardened interface region with a width of about 50 lm, which was probably the result of strong heating and rapid cooling or severe plastic deformation. In contrast to the heat affected zones that are known from fusion welding, the welding interface of an MPW joint does not reduce the joint efficiency since it is almost universally stronger than the weaker base material [2, 51].
3.2 Adapted destructive testing methodsThe testing methods described above cover different sample geometries and load cases. MPW of tubes is one of the main fields of application due to the higher process efficiency and longer lifetime of the coil compared to sheet welding. Especially the welding of aluminum tubes on steel parts is a promising production technology for lightweight driveshafts [52]. Therefore, the evaluation of the mechanical properties is extended with adapted DT methods.
3.2.1 Peel testPeel loading is the most severe loading on a welded structure. In order to standardize the procedure, a peel test setup for the integration into a standard tensile testing machine was designed and manufactured (see Fig. 26). With this setup tubular as well as flat sheet specimens [53] can be tested. The setup consists of a runner-rail-system which allows a 90° force transmission by a redirected wire. The clamp for the specimen can be tilted so that conical specimens can be tested. A bent strip of the flyer with known thickness and width is clamped in a grip which has an integrated load cell for the determination of the peel force. Moreover, the displacement of the grip is recorded. Apart from determining the strength until fracture, the position of the failure of the specimen is also of interest. During an experimental study on the influence of selected coatings on the MPW process it was found that the position of the failure differed significantly depending on the type of coating and the characteristics of the electromagnetic pulse leading to a different welded length [2].

|
| Fig. 26 Schematic of peel test setup |
The shear strength of the magnetic pulse welded seam determines the maximum loading for many load cases such as torsion, tension, and compression. Testing complete parts is important for the global performance of the part, but not sufficient for ensuring the regularity of the seam. Furthermore, force and form fits interfere and hinder the evaluation of the pure bonding strength. To overcome these problems, local tests are necessary. As described for lap shear testing, the failure often occurs in the weaker base material due to the hardened material in the welded zone. The torque testing of metal strips [43] solves this problem, but is a purely qualitative method. For the sound evaluation of the shear strengths, strips of metals should be tested in the style of DIN 50162 [54]. The method is presented in Ref. [2] and illustrated in Fig. 27.

|
| Fig. 27 Shear test with a sample preparation and b recording of force F vs. displacement x and c welded area Ashear |
Due to the pure shear loading, the shear strength can be calculated by dividing the maximum force by the evaluated size of the welded area. Finally, the regularity of the seam strength can be checked to identify the seam quality for example at the field shaper’s slot.
3.2.3 Fatigue testThe appearance of cyclic loading conditions on magnetic pulse joined parts requires the evaluation of their fatigue strength. Barreiro et al. [55] found for electromagnetic compressed tubes on mandrels that the cyclic strength was higher than the static strength. They estimated the friction in the force fit joining zone during the cyclic testing to be responsible for diffusion welding. For MPW specimens, the welded zone naturally exists before the tests and no relative movement is apparent. If the welded zone is longer than the thickness of the weaker base material, the failure will be supposed to start next to it, as shown in Fig. 28. Due to the time consuming testing procedure, static tests should be done first in order to analyze the weld quality. If the bonding between the two materials breaks without any residues on the stronger part, the welding process is not well adjusted and the performance of cyclic tests is not worthwhile.

|
| Fig. 28 Failed aluminum-steel sample (weld length 4.6 mm) after torsion fatigue test |
Welded hollow parts that are supposed to be filled with gases or liquids or are evaquated, have the requirement of leak tightness. This parameter can be tested both qualitatively and quantitatively. The first can simply be done by filling the structure with pressurized air and immersing it under water. If bubbles form, the weld seam is not tight. Alternatively, a vacuum can be applied on the welded specimens. With this method, a quick first impression of the weld integrity can be obtained, and the specimens do not have to be cleaned afterwards; the severity and the location of defects, however, cannot be defined. In order to quantify the tightness of a welded structure, the pressure drop over time can be measured by a pressure gauge [42]. Figure 29 shows a potential setup. The function of the coupling is the filling of the joint component with gas. Apart from pressurized air, the pressure medium can also be an inert gas like helium.

|
| Fig. 29 Leak test system (according to Ref. [42]) |
For ultrasonic (US) testing methods, sonic waves with frequencies between 2 and 5 MHz are used for the detection of errors in the material or weld seam. Normal or angle transducers emit mechanic waves which are coupled via a medium into the specimen. The waves propagate linearly in the specimen and get reflected at the back plane of the part or earlier at inhomogeneities. The reflected waves are detected by the probe and processed electronically [56].For the evaluation of MPW specimens, normal transducers are used. When tubular specimens are to be tested, the diameter should not be too small, so that a complete coupling of the US waves is possible. Especially non-welded areas can be detected, particularly when the joining partners are made of the same material. For multi-material joints, the interface layer between the materials can lead to measuring errors, because the reflection at this zone might superpose reflections due to incomplete fusion. Another source of error can be the interface zones that are pressed together without voids, but not welded, which might not be detected by the US-test. This leads to the fact that up to 25% of defects are not detected by US-methods [57]. Nevertheless, those techniques are the most frequently applied testing methods for explosion welded parts [42].
3.3.3 Radiographic testing-computed tomography (CT) scansRadiographic testing is based on the interaction of shortwave electromagnetic radiation (X-or gamma rays) with solid matter. Dependent on the density and thickness of the specimen, the absorption of the radiation differs, which can be made visible in shadowgraphs. In case of an X-ray CT scan, three-dimensional images of the inside of the tested specimen can be generated, which visualize any errors in the weld seam [56]. In order to detect even the smallest defects, high-performance CT scanners with a high image resolution are needed. If this requirement is met, highquality scans even reveal the wavy structure of impact welded surfaces [42].
3.3.4 Eddy current testingEddy current testing is a very common testing method used for the surface flaw detection. A coil probe induces eddy currents into the sample material. Defects like cracks or inclusions change the eddy current density and can be detected by a sensor. Eddy current testing is a contactless, safe, and easy applicable method. By a variation of the characteristics of the primary current, the penetration depth of the eddy current changes, allowing for a change of testing conditions [58].
The determination of the electrical conductivity by eddy current probes has proven to be another NDT method capable of identifying the welded zone of metallic materials for friction stir welded specimens [59]. The authors conclude that a correlation between the electrical conductivity and the hardness profile could be established for various metals welded by fusion and solid-state processes. The measurement principle is faster than conventional hardness measurements and provides additional information with increased resolution [59].
4 Conclusions and need for further researchThis paper presents several methods to gain insights into the complex multiphysics of the MPW process. The main drawbacks are limitations in the accessibility of the overlap welded zone, high costs, complex evaluation, and interferences with the process specific magnetic fields. To overcome these challenges, especially optical and mechanical methods are developed and improved since they are not influenced by the electromagnetic fields. The most promising new methods are
(ⅰ) Flash detection for process development and monitoring. The impact flash that naturally occurs during MPW, is monitored to characterize the impact time in relation to the tool coil current as well as the radial flyer impact velocity vi, r and the velocity of the propagating welding front vc. This simple method is also suitable for the detection of inhomogeneities in the magnetic field distribution or misalignments of the parts. Based on a literature study with a focus on hypervelocity impact phenomena, other analysis procedures are conceivable in the future: detection of impact mass and flyer velocity, chemical jet composition and temperature. Furthermore, the future work will include the detailed study of the flash duration and intensity in correlation with the weld seam formation.
(ⅱ) Advanced PDV measurements. Collimators are directly implemented in the field shaper to monitor the flyer velocity over time. Furthermore, a mirror is used in combination with another PDV probe to evaluate the deformation speed of the parent part after impact simultaneously. This is of special interest when welding tubes on tubes. Moreover, the PDV technology offers possibilities for the analysis of the working pressure during flyer compression and impact.
(ⅲ) Indentation pins for the assessment of the kinetic flyer energy. A purely mechanical method is introduced to evaluate the distribution of the kinetic flyer energy at any point in the impact zone. It is strongly coupled with the impact pressure that is essential for the weld seam formation. Until now, the method can be used to detect inhomogeneities in the magnetic field distribution or misalignments of the parts. The planned extension of the method will also cover the quantitative evaluation of the flyer impact velocity vi, taking the flyer properties into account.
(ⅳ) Grooves and patterns for strain measurements. This principle monitors the global flyer deformation that is of great importance for MPW. It illustrates the influence of the workpiece position within the coil on the deformation behavior and offers estimations regarding the weld seam formation. Therefore, the outer flyer surface is structured and compared before and after the MPW process. In future work it will also cover a further development to use patterns as an NDT method correlating the flyer deformation with the welding result.
(ⅴ) Anodized layer for material flow analysis. This method demonstrates the material flow very close to the weld interface, even if there is no waviness apparent. Therefore, a brittle cover layer is applied onto the flyer surface. After the MPW process, the location of the fragmented layer is studied using metallographic techniques. This method will be extended by using different colored bands of coatings on the flyer surface that allows for piecing together the material flow in the entire welding zone.
The presented methods and procedures assist the process development which is strongly coupled with the determination of the weld quality. Therefore, certain testing methods specifically for MPW joints are presented. Starting with a review of existing DT methods, some of them were adapted and extended concerning the needs of the MPW process. Finally, the most common NDT methods are described, which serve to verify the weld quality in industrial production. Due to the wide range of possible joining geometries and materials, this publication almost abstains from quantitative facts. However, it should emphasize the great potential of MPW for dissimilar and similar metal joining.
Acknowledgements This work is based on the results of Subproject A1 of the Priority Program 1640 (“joining by plastic deformation”); the authors would like to thank the Deutsche Forschungs gemeinschaft (DFG) for its financial support. Furthermore, the authors would like to thank “Bmax” (Toulouse, France) for preparing the samples for the torsion tests and “Telegaertner Geraetebau GmbH” (Hoeckendorf, Germany) for providing the fiberoptic components. Joerg Bellmann was supported by Deutsche Forschungsgemeinschaft through Grant No. BE 1875/30-2. Joern Lueg-Althoff was supported by Deutsche Forschungsgemeinschaft through Grant No. TE 508/39-2.| 1. | Lysenko D, Ermolaev V, Dudin A (1970) Methods of pressure welding. US 3520049 |
| 2. | Bellmann J, Lueg-Althoff J, Goebel G et al (2016) Effects of surface coatings on the joint formation during magnetic pulse welding in tube-to-cylinder configuration. In:Tekkaya AE, Kleiner M (eds) Proceedings of the 7th international conference on high speed forming, p 279-288 |
| 3. | Botros K, Groves T Fundamental impact welding parameters:an experimental investigation using a, 1980, 76-mm powder cannon. J Appl Phys |
| 4. | Groche P, Wagner M, Pabst C, et al(2014) Development of a novel test rig to investigate the fundamentals of impact welding. J Mater Process Technol, 214(10), 2009-2017 doi:10.1016/j.jmatprotec.2013.10.008 |
| 5. | Cuq-Lelandais J, Ferreira S, Avrillaud G et al (2014) Magnetic pulse welding:welding windows and high velocity impact simulations. In:Huh H, Tekkaya AE (eds) Proceedings of the 6th international conference on high speed forming, p 199-206 |
| 6. | Geyer M, Rebensdorf A, Boehm S (2014) Influence of the boundary layer in magnetic pulse sheet welds of aluminium to steel. In:Huh H, Tekkaya AE (eds) Proceedings of the international conference on high speed forming, p 51-60 |
| 7. | Gafri O, Izhar A, Livshitz Y et al (2006) Magnetic pulse acceleration. In:Kleiner M (ed) Proceedings of the 2nd international conference on high speed forming, p 33-40 |
| 8. | Shribman V (2008) Magnetic pulse welding for dissimilar and similar materials. In:Kleiner M, Tekkaya AE (eds) Proceedings of the 3rd international conference on high speed forming, p 13-22 |
| 9. | Mori K, Bay N, Fratini L, et al(2013) Joining by plastic deformation. CIRP Ann Manuf Technol, 62(2), 673-694 doi:10.1016/j.cirp.2013.05.004 |
| 10. | Groche P, Wohletz S, Brenneis M, et al(2014) Joining by forming:a review on joint mechanisms, applications and future trends. J Mater Process Technol, 214(10), 1972-1994 doi:10.1016/j.jmatprotec.2013.12.022 |
| 11. | Kapil A, Sharma A(2015) Magnetic pulse welding:an efficient and environmentally friendly multi-material joining technique. J Clean Prod, 100, 35-58 doi:10.1016/j.jclepro.2015.03.042 |
| 12. | Power Electronic Measurements Ltd.(2002) CWT current probe-application notes. http://pemuk.com/products/cwt-current-probe/cwt.aspx. Accessed 10 May 2016 |
| 13. | Dietz H, Lippmann H(1969) Messung der magnetischen Induktion in einer Magneform-Kompressionsspule. Elektrotech Z, 90(3), 51-54 |
| 14. | Bauer D (1967) Ein neuartiges Messverfahren zur Bestimmung der Kraefte, Arbeiten, Formaenderungen, Formaenderungsgeschwindigkeiten und Formaenderungsfestigkeiten beim Aufweiten zylindrischer Werkstuecke durch schnellveraenderliche magnetische Felder, Dr.-Ing.-Dissertation, Technische Hochschule Hannover, Hannover |
| 15. | Beerwald C (2004) Grundlagen der Prozessauslegung und-gestaltung bei der elektromagnetischen Umformung. Dissertation, Technische Universitaet Dortmund |
| 16. | Veenaas S, Vollertsen F, Krueger M et al (2016) Determination of forming speed at a laser shock stretch drawing process. In:Tekkaya AE, Kleiner M (eds) Proceedings of the 7th international conference on high speed forming 2016, p 105-114 |
| 17. | Strand OT, Goosman DR, Martinez C, et al(2006) Compact system for high-speed velocimetry using heterodyne techniques. Rev Sci Instrum, 77, 83108 doi:10.1063/1.2336749 |
| 18. | Barker LM, Hollenbach RE(1972) Laser interferometer for measuring high velocities of any reflecting surface. J Appl Phys, 43(11), 4669-4675 doi:10.1063/1.1660986 |
| 19. | Goosman DR(1996) The multibeam Fabry-Pérot velocimeter:efficient measurement of high velocities. Sci Technol Rev(7), 12-19 |
| 20. | Zhang Y, L'Eplattenier P, Taber G et al (2008) Numerical simulation and experimental study for magnetic pulse welding process on AA6061-T6 and Cu101 sheet. In:The 10th international LS-DYNA users conference, Dearborn |
| 21. | Jaeger A, Tekkaya AE (2012) Online measurement of the radial workpiece displacement in electromagnetic forming subsequent to hot aluminum extrusion. In:Tekkaya AE, Daehn GS, Kleiner M (eds) Proceedings of the 5th international conference on high speed forming 2012, p 13-22 |
| 22. | Winkler R (1973) Hochgeschwindigkeitsbearbeitung:Grundlagen und technische Anwendung elektrisch erzeugter Schockwellen und Impulsmagnetfelder. VEB Verlag Technik, Berlin |
| 23. | Watanabe M, Kumai S, Hagimoto G, et al(2009) Interfacial microstructure of aluminium/metallic glass lap joints fabricated by magnetic pulse welding. Mater Trans, 50(6), 1279-1285 doi:10.2320/matertrans.ME200835 |
| 24. | Rebensdorf A, Boehm S (2016) Increase of the reproducibility of joints welded with magnetic pulse technology using graded surface topographies. In:Tekkaya AE, Kleiner M (eds) Proceedings of the 7th international conference on high speed forming, p 125-136 |
| 25. | Pabst C, Groche P (2014) Electromagnetic pulse welding:process insights by high speed imaging and numerical simulation. In:Huh H, Tekkaya AE (eds) Proceedings of the 6th international conference on high speed forming 2014, p 77-88 |
| 26. | Poynton WA, Travis FW, Johnson W(1968) The free radial expansion of thin cylindrical brass tubes using explosive gas mixtures. Int J Mech Sci, 10, 385-401 doi:10.1016/0020-7403(68)90004-0 |
| 27. | Stern A, Becher O, Nahmany M, et al(2015) Jet composition in magnetic pulse welding:Al-Al and Al-Mg couples. Weld J, 94, 257-284 |
| 28. | Kakizaki S, Watanabe M, Kumaji S(2011) Simulation and experimental analysis of metal jet emission and weld interface morphology in impact welding. Mater Trans, 52(5), 1003-1008 doi:10.2320/matertrans.L-MZ201128 |
| 29. | Bergmann OR (1984) The scientific basis of metal bonding with explosives. In:The 8th international ASME conference on high energy rate fabrication 1984, p 197-202 |
| 30. | Friichtenicht JF, Slattery JC (1963) Ionization associated with hypervelocity impact. In:Eichelberger RJ, Dittrich WH, Atkins WW (eds) Proceedings of the sixth symposium on hypervelocity impact, vol 2, p 591-612 |
| 31. | Eichhorn G(1976) Analysis of the hypervelocity impact process from impact flash measurements. Planet Space Sci, 24(8), 771-781 doi:10.1016/0032-0633(76)90114-8 |
| 32. | Lueg-Althoff J, Schilling B, Bellmann J et al (2016) Influence of the wall thicknesses on the joint quality during magnetic pulse welding in tube-to-tube configuration. In:Tekkaya AE, Kleiner M (eds) Proceedings of the 7th international conference on high speed forming, p 259-268 |
| 33. | Pond RB, Mombley C, Glass CM (1963) Energy balances in hypervelocity penetration. In:Eichelberger RJ, Dittrich WH, Atkins WW (eds) Proceedings of the sixth symposium on hypervelocity impact, vol 2, p 401-419 |
| 34. | Hill R(1950) The mathematical theory of plasticity. Oxford , Clarendon Press |
| 35. | Lorenz A, Lueg-Althoff J, Bellmann J, et al(2016) Workpiece positioning during magnetic pulse welding of aluminum-steel joints. Weld J, 95(3), 101-109 |
| 36. | Sutton MA, Schreier HW, Orteu JJ (2009) Image correlation for shape, motion and deformation measurements:basic concepts, theory and applications. Springer, New York |
| 37. | Erlenmaier W, Kappes J, Tatarczyk A et al (2014) Efficient punching using integrated flattening. In:Liewald M (ed) Neuere Entwicklungen in der Blechumformung. Fellbach, p 81-97 |
| 38. | Hokari H, Sato T, Kawauchi K, et al(1998) Magnetic impulse welding of aluminium tube and copper tube with various core materials. Weld Int, 12(8), 619-626 doi:10.1080/09507119809452024 |
| 39. | DIN Deutsches Institut fuer Normung e.V.(2013) Welding and allied processes-classification of geometric imperfections in metallic materials-Part 2:welding with pressure (DIN EN ISO 6520) |
| 40. | DIN Deutsches Institut fuer Normung e.V.(1982) Testing of sandwiches; climbing drum peel test (DIN 53295) |
| 41. | DIN Deutsches Institut fuer Normung e.V.(1979) Testing of adhesives for metals and adhesively bonded metal joints; test specimens; manufacturing (DIN 53281) |
| 42. | Broeckhove J, Willemsens L (2010) Experimental research on magnetic pulse welding of dissimilar metals. Master Thesis, Universitaet Gent |
| 43. | Raoelison RN, Rachik M, Buiron N et al (2012) Assessment of gap and charging voltage influence on mechanical behaviour of joints obtained by magnetic pulse welding. In:Tekkaya AE, Daehn GS, Kleiner M (eds) Proceedings of the 5th international conference on high speed forming 2012, p 207-216 |
| 44. | Sharafiev S, Wagner MF, Pabst C et al (2016) Microstructural characterisation of interfaces in magnetic pulse welded aluminum/aluminum joints. In:Lampke T, Wagner G, Wagner M (eds) Tagungsband zum 18. Werkstofftechnischen Kolloqium, p 294-298 |
| 45. | Ben-Artzy A, Stern A, Frage N, et al(2008) Interface phenomena in aluminium-magnesium magnetic pulse welding. Sci Technol Weld Join, 13(4), 402-408 doi:10.1179/174329308X300136 |
| 46. | Ben-Artzy A, Stern A, Frage N et al (2010) Wave formation mechanism in magnetic pulse welding. Int J Impact Eng. doi:10.1016/j.ijimpeng.2009.07.008 |
| 47. | Raoelison RN, Sapanathan T, Buiron N, et al(2015) Magnetic pulse welding of Al/Al and Al/Cu metal pairs:consequences of the dissimilar combination on the interfacial behavior during the welding process. J Manuf Process, 20, 112-127 doi:10.1016/j.jmapro.2015.09.003 |
| 48. | Goebel G, Kaspar J, Herrmannsdoerfer T et al (2010) Insights into intermetallic phases on pulse welded dissimilar metal joints. In:Babusci K, Daehn G, Marré M et al (eds) Proceedings of the 4th international conference on high speed forming 2010, p 127-136 |
| 49. | Tekkaya AE(2000) An improved relationship between Vickers hardness and yield stress for cold formed materials and its experimental verification. Ann CIRP, 49(1), 205-208 doi:10.1016/S0007-8506(07)62929-1 |
| 50. | Zhang Y, Babu S, Prothe C et al (2010) Application of high velocity impact welding at varied different length scales. J Mater Process Technol. doi:10.1016/j.jmatprotec.2010.01.001 |
| 51. | Kore SD, Date PP, Kulkarni SV, et al(2011) Application of electromagnetic impact technique for welding copper-to-stainless steel sheets. Int J Adv Manuf Technol, 54, 949-955 doi:10.1007/s00170-010-2981-z |
| 52. | Bmax (2016) Magnetic pulse welding-the ultimate solution for driveshaft manufacturers. Accessed 2 March 2016 |
| 53. | Hahn M, Weddeling C, Lueg-Althoff J, et al(2016) Analytical approach for magnetic pulse welding of sheet connections. J Mater Process Technol, 230, 131-142 doi:10.1016/j.jmatprotec.2015.11.021 |
| 54. | DIN Deutsches Institut fuer Normung e.V.(1978) Testing of plated steels; determination of shearing strength between cladding material and base material in shearing test (DIN 50162) |
| 55. | Barreiro P, Schulze V, Loehe D et al (2006) Strength of tubular joints made by electromagnetic compression at quasistatic and cyclic loading. In:Kleiner M (ed) Proceedings of the 2nd international conference:ICHSF 2006 |
| 56. | Fahrenwaldt HJ, Schuler V, Twrdek J (2014) Praxiswissen Schweißtechnik:Werkstoffe, Prozesse, Fertigung, 5th edn. Springer Vieweg, Wiesbaden |
| 57. | Shaw RE(2002) Ultrasonic testing procedures, technician skills, and qualifications. J Mater Civ Eng, 14(1), 62-67 doi:10.1061/(ASCE)0899-1561(2002)14:1(62) |
| 58. | Hellier C(2013) Handbook of nondestructive evaluation. 2nd edn. New York , McGraw-Hill |
| 59. | Santos TG, Sorger G, Vilaça P, et al(2014) A non-conventional technique for evaluating welded joints based on the electrical conductivity. Key Eng Mater, 611 |