 2015, Vol. 3
The article information
- Nejah Tounsi, Tahany El-Wardany
- Finite element analysis of chip formation and residual stresses induced by sequential cutting in side milling with microns to submicron uncut chip thickness and finite cutting edge radius
- Advances in Manufacturing, 2015, 3(4): 309-322
- http://dx.doi.org/10.1007/s40436-015-0128-z
-
Article history
- Received: 10 May 2015
- Accepted: 30 October 2015
- Published online: 7 December 2015


2 United Technologies Research Center, East-Hartford, CT, US
Residual stresses (RS) in the machined components are of great industrial importance,since they can affect their fatigue life. They are generally induced by the plastic deformations, the thermal stresses,and the phase transformations of the machined layer. RS distribution on and beneath the machined surface is affected by the history of the successive cuts and all the manufacturing processes preceeding the machining operations. This paper will focus solely on the machining aspects and will assume that the part is exempt from any RS prior to machining. The final surface of a machined component is generally obtained by the material removal of several layers during the roughing,semi-finishing and finishing operations. The material removal in a single layer might also include sequential cuts due to the machining strategies,the successive cuts by the numerous inserts of the cutter,etc.
Limited number of numerical studies was published on the influence of the cutting sequence on the machininginduced RS [1, 2, 3, 4, 5, 6, 7, 8, 9, 10]. Sasahara et al. [10] investigated the effect of sequential roughing and finishing on RS in brass material through the use of finite element method (FEM) and X-ray diffraction techniques. Tensile residual stresses were found after roughing with an uncut chip thickness t = 0.25 mm and cutting velocity Vc = 13 mm/min. These RS become compressive after applying finishing conditions with t = 0.10 mm. Repetition of the finishing conditions does not cause any more compressive RS.
Liu and Guo investigated the effect of two sequential cuts on RS under dry orthogonal cutting conditions of stainless steel 304 through the use of a thermo-elastic viscoplastic FEM [9]. Under the single set of machining conditions (Vc = 3 m/s,t = 0.25 mm) and the assumption of continuous chip formation and sharp cutting edge,the first cut slightly affects the chip thickness,cutting forces,and temperature of the machined layer,but significantly affects the RS distribution induced by the second cut. These conclusions have been further confirmed by setting t equal to 0.21 mm for the first cut and {0.21,0.11,0.05, 0.03} mm for the second cut [8].
Ee et al. developed an FE model to investigate the effect of sequential cuts on RS in a machined layer of AISI 1045 steel under orthogonal cutting conditions with cutting edge radius re equal to 60 μm [7]. They found that the RS decayed quickly with distance from the surface to zero in the second cut compared to that of the first cut,although the RS at surface did not change.
Outeiro et al. [7] conducted experimental and numerical investigation of the effects of cutting sequence on the RS distribution in the machined surface of AISI 316L steel through the use of the X-ray diffraction technique and FEM of dry orthogonal cutting with re of 30 μm,Vc of 100-200 m/min and t of 0.1-0.2 mm [6]. The sequential cut tends to increase the superficial RS and the thickness of the tensile layer. These results are opposite to those found by Ee et al. [7],Guo and Liu [8, 9] when machining AISI 304 and AISI 1045,respectively.
Li et al. [5] proposed a 2D thermo-mechanical coupled FE model based on the effective rake angle and the variable uncut chip thickness t to study RS induced by high speed end milling of hardened steel SKD11 (~60 HRC) during two consecutive cuts. The variation of t is assumed to be linear starting from the value of 70 μm down to zero. The RS tends to increase after the first cut. The predicted and experimental RS profiles have the same trend,being compressive on the machined surface with similar values then become tensile after a certain depth.
Schulze et al. [4] suggested a method to forecast the component state by using FE simulations of sequential cuts done by broaching of SAE 5120 low alloy steel,using a tool with multiple cutting edges. The cutting conditions,Vc and t,are in the ranges of 30-90 m/min and 0.04-0.08 mm, respectively. Both FEM and experimental results show high tensile stresses at the surface,and a decrease of stresses to become compressive at a depth lower than approximately 20 μm. RS induced by different tool starting temperatures have a local minimum at 3-6 μm of depth.
Dehmani et al. [1] developed a multi-steps model for dry orthogonal cutting of AISI 4140 using cutting edge radius equal to 30 μm in order to study the influence of the cumulated strain and temperature induced by three consecutive cuts on the RS. For the single set of cutting conditions (Vc = 478 m/min,t = 0.15 mm),tensile peaks are located on the machined surface and their magnitude increases with the number of cuts. The peaks of the compressive RS are located at a depth of approximately 50 μm and their magnitude decreases with the number of cuts.
Zhao et al. [2] used the smooth particle hydrodynamic (SPH) method to investigate the effect of two sequential cuts on chip formation,cutting force and the RS in orthogonal micro-machining of oxygen-free high-conductivity copper (OFHC) with t of 0.3,0.6 and 0.9 μm. The cutting velocity was not reported. The chip curled severely and the minimum chip thickness decreased in the second cut. The cutting force in the second cut was smaller than the first cut,while the thrust force was nearly the same during two cuts. In addition,the tensile residual stress beneath the machined surface layer would change to compressive stress after the second cut.
Most of these reported numerical research works deal with pure orthogonal cutting with relatively large values of constant chip thickness (10-300 μm) to simulate turning or broaching of brass,medium carbon steel,low alloy steel, hardened steel,stainless steel,and OFHC. A single investigation was found to simulate the milling process as an orthogonal cutting process with linear variation of the uncut chip thickness [5]. Another publication was found about the modeling of the effect of sequential cut on RS distribution for constant t in the sub-micron range [2].
It is suggested in this paper to study the effect of four sequential cuts on RS distribution induced in side milling of the difficult-to-machine material Ti6Al4V with submicron uncut chip thickness and finite cutting edge radius. The variable chip thickness will be the result of the kinematics of the down milling process considering two successive engagements of the cutting edge displaced by the feed per tooth. FE method is adopted in this work to model the machining induced RS due to its versatility in dealing with complex tool and part geometries and in handling different tool-part kinematic arrangements and different physical phenomena,such as friction,elastic-plastic and thermal deformations,heat transfer,etc. The FEM software package DEFORM 2D is used to implement the model [11]. The remainder of this paper is organized as follows. Section 2 describes the FE modeling approach for sequential cuts in side milling operation of Ti6Al4V under micro-cutting conditions. Section 3 provides a discussion of the modeling results and an experimental validation. Concluding remarks are given in the final section with an outlook of further activities.
2 FE modeling of sequential cuts in side millingThe side milling process with zero helix angle and constant axial depth of cut (adoc) can be considered as a 2D plain strain problem when the axial depth of cut is very large compared to the uncut chip thickness. A 2D FEM is developed to simulate 4 sequential cuts by successive inserts in a side milling process under down milling configuration. The FE model includes accurate material,friction, and heat exchange input models to obtain reliable results. It requires also appropriate selection of the object geometries,their mesh density,their boundary conditions, and their relative kinematics. These aspects are described in the following sections.
2.1 Material,heat transfer and tribological requirementsThe rheology of the workpiece material was described by a phenomenological approach where the material was considered as a homogeneous and isotropic material, which could be described by common constitutive models. The effects of the microstructure on the force fluctuation are not considered. The modified version of the Johnson-Cook (JC) constitutive equation,as suggested by Calamaz et al. [12, 13],was found to be the most suitable to describe the behaviour of the Ti6Al4V. It allows more realistic prediction of segmented chip morphology and the corresponding cyclic force signals. This formulation is therefore adopted in the current manuscript. In addition to the effects of strain hardening,strain rate hardening and thermal softening described by the generic JC constitutive model,it includes a temperature-dependent strain softening effect and strain softening at high strain values,as given by
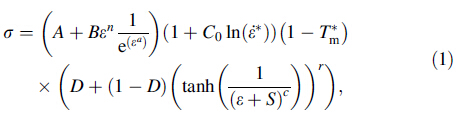
where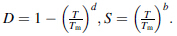
The variable r is the material flow stress. A,B,n,C0 and m are five material constants; ε is the equivalent strain. The variables ε* and T* are the homologous strain rate and temperature, respectively. The melting temperature Tm of Ti6Al4V and the reference strain rate are equal to 1 560 ℃ and 1,respectively. Typical coefficients of JC model for Ti6Al4V (340Hv) are A = 968 MPa,B = 380 MPa,n = 0.421,C0 = 0.0197, m = 0.577 [13]. The set of coefficients (a,b,c,d,r) has been adopted from Ref. [14] and is equal to (2,5,2,1,0.05). In this study,no damage criterion was applied. The effect of the application of a damage criterion on the RS and chip formation when machining sub-micron uncut chip thicknesses will be investigated in a separate publication.
The elastic behaviour and physical properties of the workpiece material should be temperature-dependent in order to accurately simulate the machining-induced residual stresses. These properties are composed of the Young’s modulus E (MPa),the coefficient of linear thermal expansion α (10-6 K-1),the thermal conductivity K (W/(m • K)),the specific heat capacity Cp (J/(kg • K)),the Poisson ratio v and the material density q (kg • m-3). The sets of characteristics {E,v,a,q} and {K,Cp} have been adopted from Refs. [15, 16],respectively
where is the temperature in degrees Celsius. The physical and thermal properties of the uncoated carbide tool are ρ = 11 900 kg/m3,E = 534 GPa,v = 0.22 and Cp = 400 J/(kg•K) [12]. Since the insert deformation was not an objective of this investigation,the insert material type is set to be rigid in all simulations.
The shear stress at the tool-chip interface sint is assumed to be proportional to the shear stress of the chip material Kchip,through the coefficient mfriction,which is set equal to 0.8 for the combination of workpiece material Ti6Al4V and a carbide insert [17]. The heat transfer coefficient at the tool-chip interface lies between 100-300 kW/(m2•K) and it is assumed here to be equal to the 100 kW/(m2•K) to allow rapid temperature rise in the tool [18]. The fraction of plastic deformation converted into heat energy is assumed to be equal to 0.9.
2.2 Object geometries,mesh and kinematicsThe carbide insert 2D geometry is characterized by a rake angle a = 5°,a clearance angle c = 7°,a tool edge radius re = 10 μm and a flank wear land VB = 0. To reduce the computing time,only a portion of the insert is modeled. It is circumscribed in a 30 μm 9 30 μm square.
The main geometric parameters that define 2D down milling operation are composed of the tool diameter (D = 19 mm),the radial depth of cut (rdoc = 0.0125 mm), and the feed per tooth (Fz = 0.035 mm),as illustrated in Fig. 1. When the feed per tooth is very small compared to the tool diameter,the trochoidal path of each cutting insert can be approximated by a circular path. The successive paths are displaced by the feed per tooth. For each cut,the insert was positioned on the appropriate circular path relative to the stationary workpiece and then animated with a rotary motion around the tool axis. The cutting velocity used is 150 m/min. No built-up edge formation was observed in the experiment.
 |
| Fig. 1 Schematic of down milling operation when Fz << D |
To reduce the computational load required by FEM,the pre-formed workpiece geometry includes an arc simulating the swept envelope of an initial cut. The length of the workpiece is set to accommodate 4 successive cuts. To avoid edge phenomena at the entry and exit of the inserts,it is suggested to extend the workpiece profile along the x direction by dx = 0.02 mmbeyond the point of the insert exit for the initial cut and before the point of the insert entry for the fourth cut. Consequently,the length and the height of the machined workpiece are set equal to L = 0.65 mm and H = 0.15 mm, respectively. Since the radial depth of cut is at least one order of magnitude smaller than the workpiece size,a schematic of the workpiece geometry to scale would not allow clear illustration of the different features of theworkpiece. Therefore,an illustrative geometry profile is provided in Fig. 2 for the following factious conditions: D = 6 mm,Fz = 1 mm, rdoc = 3 mm,L = 7.5 mm,H = 2 mm,and dx = 0.25 mm.
 |
| Fig. 2 Illustrative 2D FE model for down milling process |
To increase the resolution/accuracy of the prediction of thermal and mechanical loads on the insert,a higher mesh density is defined in the region where the tool-chip interface and insert-workpiece interface are expected to form. This was made possible by using a mesh window with FE size (relative element size W = 0.05) around the tip of the insert and another mesh window with coarse element size (W = 1) for the rest of the insert. The workpiece mesh is proposed to allow primarily the prediction of the residual stresses in addition to the chip geometry,thermal and mechanical loads.
Two cases of orthogonal cutting with constant uncutchip thicknesses h have been considered,specifically h = 4 μm and h = 0.9 μm. The remaining cutting conditions are those specified in this manuscript. The mesh sizes have been varied in the deformation zones (primary,secondary and tertiary deformations zones) from 0.6 μm to 1.8 μm in case h = 4 μm and from 0.3 μm to 0.9 μm for the case of h = 0.9 μm. It was found that the force signals stabilized starting from the mesh size of 1.2 μm for h = 4 μm and from h = 0.6 μm for h = 0.9 μm. Reducing the mesh size further,would not enhance significantly the results for these uncut chip thicknesses while it will incur higher computation cost. It was concluded therefore that a mesh size of 0.6 μm in the deformation zone would be reasonable to cover the variation of the uncut chip thickness lower than 4 μm. It should be noted that despite the fact that the uncut chip thickness (h = 0.9 μm) is only 1.5 times the mesh size (0.6 μm),the number of elements across the chip is approximately 6,owing to the large chip compression ratio that characterizes the micro-machining, which in turn leads to large contact area between the toolchip and the tool-workpiece,and consequently reduces,to a certain extent,the sensitivity of the forces to the mesh size.
To maintain,throughout the simulation of the four cuts, a near-constant mesh size in a sub-layer of 0.05 mm along the machined surface and in the region where the chip is expected to form,fine mesh is set along the full machined surface,by defining 3 nested and stationary mesh windows, as shown in Fig. 2. The first mesh window is characterised by high mesh density with a relative element size W = 0.005. Since the uncut chip thickness varies from the maximum value of 1.94 μm toward 0,the mesh size in the machined layer is set to the value identified in the sensitivity analysis of the FEM predictions to the mesh size, which is approximately 0.6 μm. The machined layer includes the chip that will form and enclose the top of the workpiece including a surface layer of 0.020 mm to capture the residual stresses. The second window is a window of transition between high and low mesh density windows where W = 0.1 and the absolute mesh size is approximately 1.2 μm. The third window is for coarse mesh where W = 1 and the absolute mesh size is 5 μm. It encloses the full workpiece and the chip that will form. The total number of the mesh elements is in the neighbourhood of 16 000 for the workpiece and 700 for the tool.
2.3 Boundary conditionsAn initial temperature of 20 ℃ was assumed for both the insert and the workpiece for the first cut. Considering the high pressure flood cooling,the convection coefficient toward the environment and the sink temperature were set equal to 3 kW/(m2•K) and 20 ℃,respectively,for the material removal phase and the stress relaxation phase. The heat exchange with the environment was defined on the top surface and both sides of the workpiece,and on the rake and clearance faces of the insert. The temperature on the other sides of the workiece and the insert was set to 20 ℃. The bottom surface of the workpiece was fixed in both x and y directions. These boundary conditions are illustrated in Fig. 2.
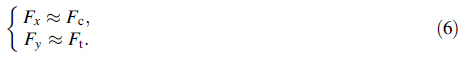
2.4 FE strategy for sequential cuts and residual stress predictionIn this work,sequential cutting was simulated by using one workpiece and one insert in the model while keeping an accurate track of the evolution of the physical states of the workpiece and the tool during the successive operations. At the end of each cut k,the insert was repositioned at the start of the next tool path k + 1 relative to the workpiece. Then, the tool and the workpiece were cooled down for a period of time equal to the time lag between two successive inserts,which are rotating with the specified velocity r/min. The simulation of machining for the cut k + 1 follows. The physical states of the tool and the workpiece obtained at the end of the cut k were used as an initial state for the cooling phase. The resulting physical states from the cooling phase were used as the initial conditions for the subsequent cut. In order to predict RS residual stress after each cut,the tool was released from the machined surface. The workpiece was left to cool down to room temperature,with a temperature change rate of 2 ℃/step. Residual stresses in the machined layer were then extracted from the model. Residual stresses from phase transformation and cutting tool wear were neglected. The workpiece is assumed to be RS free before the first cut.
3 Discussions 3.1 Chip morphologyThe simulated chip root formations obtained for the first three cuts are shown in Fig. 3 for two cutting lengths of 120 μm and 425 μm. These cutting lengths correspond to the nominal uncut chip thicknesses of 1.39 μm and 0.25 μm,respectively. The total cutting length for each cut is 490 μm. To prevent the contact between the chip and the workpiece,which might cause serious numerical problems, and to prevent the mesh element leakage through long chip, the chip is systematically cut during the simulation to reduce its length. The reduction of the chip length is made far away from the chip root to avoid any disturbance to the chip root formation mechanisms and the subsequent alterations of chip morphology.
 |
| Fig. 3 Chip morphologies after cutting length of 120 μm and 425 μm for each of the first 3 cuts |
The simulated chips have continuous chip morphology for the different cuts. This might be explained by the ductile machining regime. The maximum uncut chip thickness,which is equal to 1.8 μm,is very small compared to the cutting edge radius of 10 μm. It is therefore below the critical uncut chip thickness for which the material removal mechanism changes from a ductile crackfree mode to a brittle mode as t increases. Under the high compressive plastic deformation experienced in the chip root formation area when t values are below the critical uncut chip thickness,the micro cracks experience closure and this effectively prevents or postpones crack formation and propagation until the conditions are reached where plastic deformation does not occur,leading to continuous chip formation.
The chip curvature and its orientation constitute the main distinction between the chip morphology in the first cut and in the subsequent cuts when the uncut chip thicknesses are in the micron and submicron range,as shown in Fig. 3. These results are opposite to those found by Guo and Liu [8, 9],when machining AISI 304 with t in the range of 10-300 μm. For the first cut,the chip curls toward the tool as it forms and its curvature increases with a decrease of the nominal t. The curvature is very small at the start of the cut when the nominal t is in the neighbourhood of 1.4 μm,leading to an aμmost straight chip. The chip curvatures for the second,third and fourth cuts are very similar. The chip curls toward the workpiece as it forms and its curvature increases with a decrease of the nominal t. A physical explanation for these qualitative observations would require the analysis of the competing effects of the temperature field and the plastic deformation field in the chip root formation on the chip curl,which is beyond the scope of this paper.
The chip thickness was evaluated by averaging three measurements inside the area delimited by the circle,as shown in Fig. 3. Due to the variable uncut chip thickness t, which characterises the down milling process,the evaluated chip thickness corresponds to a range of the nominal t and does not correspond to a particular value of t. When the t is in the neighbourhood of 1.39 μm,the average chip thickness increases with the number of cuts and it is equal to 4.3,4.9, 5.3 and 5.7 μm for the consecutive cuts,respectively. The corresponding chip compression ratios vary from 3 to 4. However,for lower nominal t in the neighbourhood of 0.25 μm,the chip thicknesses generated by the different cuts are aμmost identical and equal to 3.1,2.9,3.1 and 3.1 μm for the consecutive cuts,respectively. The corresponding chip compression ratios are approximately equal to 12.
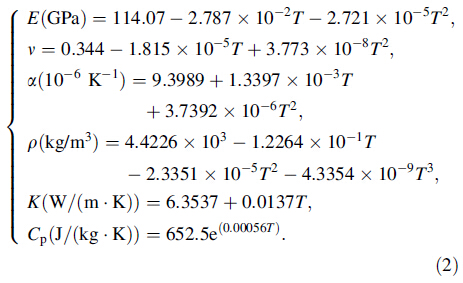
3.2 Machining forcesThe machining force components Fx and Fy applied on the tool and obtained for the four cuts as function of the tool angular positions are shown in Figs. 4 and 5,respectively. Their magnitude is given as Newton per 1 mm of axial depth of cut. The components Fx and Fy are related to the thrust force Ft and cutting forces Fc through the following relations:

 |
| Fig. 4 Cutting force Fc ≈ Fx (The magnitude is given as Newton per 1 mm of axial depth of cut.) |
 |
| Fig. 5 Thrust force Ft ≈ Fy (The magnitude is given as Newton per 1 mm of axial depth of cut.) |
Since the cutting sector  is less than 3° wide,the
following approximations are made:
is less than 3° wide,the
following approximations are made:

Consequently,the cutting force is the main contributor to the force component Fx and the thrust force is the main contributor to the force component Fy
Both of the cutting and thrust forces are decreasing as the uncut chip thickness decreases due to the rotation of the cutting edge in the down milling operation,which conforms to the expected output. The small oscillations of the force profiles are due to node separation,inherent to the FE model.
Away from the insert entry and exit areas,the magnitude of the thrust force is approximately two times higher than the cutting force. This is in agreement with all reported results when machining with tool edge radius and an uncut chip thickness,which is lower than the critical one. There was no significant difference in the cutting force for all four cuts. However,the magnitude of the thrust force for the first cut is significantly higher than that of the subsequent cuts. The thrust force profiles and levels are aμmost identical for the second,third and fourth cuts. The observed force profiles are correlated with the chip curl and orientation. In the first cut,the insert is cutting a fresh material, which is exempt from any prior deformation,resulting in a chip curl toward the tool. However in the subsequent cuts, the insert is cutting already strain hardened material, leading to a chip curl toward the workpiece. Consequently, the tool-chip interface is reduced compared to the one for the first cut,which in turn results in reduced thrust force for the cuts subsequent to the first one.
The differences in the cutting and thrust force profiles at the insert entries and exits might be explained by the variations in the ploughing and prow formation,which are the main physical phenomena at these locations. These phenomena might alter the machining length from one cut to another. For example,the formation of a prow toward the end of the cut requires a longer path of the insert in order to remove that prow. Furthermore,the machining length in the second cut is longer compared to the first one, since the insert has to exit the material after the formation of a cusp on the machined surface.
3.3 Plastic deformation in the machined layerThe equivalent plastic strains εp have been adopted as a measure for the plastic deformation in the machined layer. They are extracted from the FEM results at the end of each cut as a function of the depth beneath each machined surface resulting from a given cut at different positions along that surface. These positions are defined as an arithmetic sequence with common difference equals to the feed per tooth and the initial term equals to the workpiece extension of 20 μm (see Fig. 6). The areas of the insert entry and insert exit are referred to as ‘‘Entry’’ and ‘‘Exit’’, respectively,in the different plots.
 |
| Fig. 6 Measurement positions along the machined surface |
The maximum values of εp are found on the machined surfaces. They are plotted in Fig. 7 as function of the measurement positions along the machined surface for the different cuts.
 |
| Fig. 7 Maximum effective plastic strain along the machined surface for different cuts |
Figure 7 shows that the magnitude of the maximum plastic strain εp increases with the decrease of t. As the uncut chip thickness t decreases to a very low value and approaches zero,the material will be removed through extreme plastic deformation rather than through the shearing mechanism which takes place with relatively large t. This trend is therefore opposite to the one reported for conventional cutting conditions of AISI 304 where t is in the order of dozens of microns [8]. Figure 7 also shows that the magnitude of the maximum plastic strains εp increases with the number of cuts. While they are approximately equal to 3 in the first cut,they reach up to 13 in the fourth cut. Consequently,there is a significant increase of the strain hardening of the machined layers with the number of cuts. The strain-hardened material in the previous cuts still has the ability to strain harden further in the subsequent cuts. This trend differs from machining with large uncut chip thicknesses,ranging from dozens to hundreds of microns. For large uncut chip thicknesses,the strain hardening of the machined layer will quickly reach a stable level after two or three sequential cuts. Some studies have shown that the magnitude of the effective plastic strain decreases with the number of cuts of AISI 304,due to a reduced ability of the material to deform with the number of cuts [8, 9]. Consequently,the effect of the strain-hardened machine layer in the first cut is profound. However,for small uncut chip thicknesses in the range of microns and sub-microns,large number of successive cuts seem to be needed to reach a saturation of the strain hardening of the machined layer. The first cut might not have a profound impact on the strain hardening of the material. The loads are very small to have a great effect on the strain hardening for the first cut.
This observation should be taken with precaution due to the unbounded strain hardening of the material,which is assumed in this work. Following this assumption,the material will have the ability to deform indefinitely,which is physically incorrect. The effect of the application of a damage criterion on the chip formation when machining sub-micron uncut chip thicknesses,is beyond the scope of this paper. The profiles of maximum εp distributions as function of measurement positions are skewed toward the insert exit positions,defined by x = 55,90,125 and 160 μm for the four successive cuts,respectively. In the vicinity of these locations,the machining process is reduced to a pure ploughing process,since the uncut chip thickness is in vicinity of zero and its well below the critical uncut chip thickness. The distributions of the equivalent plastic strains as function of the depth beneath the surface are plotted in Figs. 8,9 for the different cuts and for the positions x = 160 μm and 475 μm,respectively. Through Figs. 7,8 and 9,the cumulative effect of the strain hardening due to the successive cuts is demonstrated by higher pic values of effective plastic deformation εp on machined surface,higher values of εp through the depth of the workpiece,and wider and deeper affected area as the number of cuts increases.
 |
| Fig. 8 Effective plastic strain profile along the depth beneath machined surface at x = 0.160 mm |
 |
| Fig. 9 Effective plastic strain profile along the depth beneath machined surface at x = 0.475 mm |
The temperatures are extracted from the FEM results at the end of each cut as a function of the depth beneath each machined surface and at different positions along that surface. The maximum values of temperature are found to be on the machined surface. They are plotted in Fig. 10 for different cuts.
 |
| Fig. 10 Temperature profile along the machined surface for different cuts |
Figure 10 shows that the temperature profiles are skewed toward the end of the cuts,where temperatures are higher compared to those at the start of the cuts in the vicinity of the positions 440-475 μm. This may be partly explained by the cumulative effect of the heat generation during the cut,leading to higher temperatures toward the end of the cuts. The gradient of heat dissipation toward the environment between the start and the end of the cut might also contribute to this difference in temperatures. The area of the insert entry has longer time of heat exchange with the environment compared to the area of the insert exit, leading to higher heat dissipation and lower temperatures at the area of the insert entry. Another source of this difference in temperatures between the start and the end of cuts might be attributed to the difference of the chip formation mechanisms,where a chip formation occurs at the start of the cut where there is a sizable uncut chip thickness while pure ploughing takes place at the end of the cut where the uncut chip thickness is practically zero.
The common section of the machined surfaces resulting from the different cuts is located between the positions 125 μm and 440 μm. In this section,the maximum temperatures induced by the second,third and fourth cuts are aμmost identical. Consequently,the initial temperature state of the workpiece is approximately similar for the third and fourth cuts. The cutting temperature has achieved steady state value. The undeformed chip thickness is extremely low and identical for the third and fourth cuts. Therefore,any change in the temperature generated would be negligible and could be ignored. However,the maximum temperatures induced by the first cut are 10 ℃ lower than those for subsequent cuts. The low plastic deformation levels and affected area in the first cut explain the lower levels of temperature in the machined surface.
The depths of the heat-affected zone decrease with the uncut chip thickness as shown in Figs. 11 and 12. It is approximately equal to 60 μm and 110 μm at the measurement positions of 160 μm and 440 μm,which correspond to the uncut chip thickness of 0.6 μm and 1.6 μm, respectively. The temperature distribution in the workpiece results from both the plastic deformation and the friction between the workpiece and the tool,due to the large impact of the ploughing phenomena with small uncut chip thicknesses.
 |
| Fig. 11 Temperature profile along the depth beneath machined surface at x = 160 μm |
 |
| Fig. 12 Temperature profile along the depth beneath machined surface at x = 475 μm |
Due to the low conductivity of titanium material compared to carbide,the diffusivity of the heat to the workpiece is much shallower in this case that is why for micro-machining of titanium the generated high temperature is localized at the tool tip and the chip is not in the finished surface. The maximum temperatures during the four machining cuts are located in the chip root. They are in the neighbourhood of 300 ℃,which is much below the temperature of phase transformation for Ti6Al4V. Therefore,the assumption that the RS are due mainly to the plastic deformation and secondary to the thermal stresses holds in this particular application.
3.4 Machining-induced residual stressesThe iso-lines of the distribution of residual stress component σxx in the cutting direction are shown in Fig. 13 for the different cuts. Figure 13 shows that the RS component σxx is compressive near the machined surface for all cuts. Machining Ti6Al4V leads to localized low thermal loads and high mechanical loads,which affect greater area of the workpiece through plastic deformation and result in compressive RS. In machining titanium,it is well known that the material conductivity is very low compare to the carbide tool. It is expected that the heat generated during machining will be diffused to the tool and to the chip faster than to the workpiece. Consequently,the thermal load, which is the cause of tensile residual stress on the workpiece, will be small,while the mechanical load,which is the cause of the compressive residual stress,will be dominant.
 |
| Fig. 13 Iso-lines of RS component σxx (A = –300 MPa, B = –200 MPa, C = –100 MPa, D = 0, and the x- and y- scales are mm.) |
The depth and width of the compressive residual stress region increase with the number of cuts,mainly toward the insert exit area,that is x = 55 μm to 160 μm for the four cuts. It underlines the cumulative effect of sequential cuts on plastic deformation and on the strain hardening effect of the material,which in turn has a significant effect on the pattern of machining-induced residual stress,as demonstrated in Refs. [19, 20]. With the significant increase of strain hardening of the material at the surface and aμmost steady temperature level,the flow stress of the material increases,leading to higher mechanical load,which in turn results in higher compressive RS and deeper RS-affected area.
The RS component σxx is extracted from the FEM results at the end of the cooling stage following each cut as a function of the depth beneath each machined surface and at different positions along that surface,as shown in Fig. 13. They are plotted in Figs. 14 and 15 for the different cuts and for the positions x = 160 μm and 475 μm, respectively. The experimental data for the same cutting conditions are also included in both figures. Although the experimental RS data are the average of three measurements at three different locations on the machined surface of the real part,it is assumed herein to be the same at the different positions along the machined surface. This assumption is referred to by a star,which is added as a superscript to the term ‘‘Exp.’’ in the legend of the different plots.
 |
| Fig. 14 RS component σxx along the depth beneath machined surface at x = 160 μm |
 |
| Fig. 15 RS component σxx along the depth beneath machined surface at x = 475 μm |
The maximum compressive RS is on the machined surface for all cuts. It approaches the experimental value of -600 MPa,as the number of cuts increases. The magnitude of σxx and the depth of the compressive RS region, which is expressed as the distance from the machined surface to the point where σxx becomes zero,increases with the number of cuts. Beyond the compressive residual stress zone,a low level of tensile RS exists in the bulk of the workpiece material. The RS profile is therefore balanced. The predicted RS profile tends toward the experimental RS profile as the number of cuts increases,but at different rates,depending on the position of measurement along the machined surface. It converges faster toward the experimental RS profile in the area of the insert exits at x from 55 μm to 160 μm,compared to the area of the insert entries at x from 405 μm to 510 μm for the four cuts.
Further analysis of the data confirms previous observations. The maximum values of σxx and the depth of the compressive RS zone are plotted in Figs. 16 and 17, respectively,along with the corresponding experimental data and for the different cuts. Figure 16 shows that the maximum value of RS component σxx converges toward the experimental value all over the machined surface after the forth cut. The percent error δ of the predicted response value y to the experimental response value y is evaluated using the following formula,where the term ||•|| is the Euclidean norm
 |
| Fig. 16 Maximum value of RS component σxx along the machined surface for different cuts |
 |
| Fig. 17 Maximum depth of the compressive RS component σxx for different cuts |
The percent error of the distribution of the maximum value σxx over the machined surface compared to the experimental data decreases from 35% for the first cut to 13% for the fourth cut. Figure 17 shows that the maximum depth of the compressive RS component σxx converges toward the experimental data in the area of the insert exits, while it is still far in the area of the insert entries,even after four cuts. Simulation of additional cuts is required to allow the accumulation of plastic deformation in the area of insert entries,resulting in an increase of the depth of compressive RS and in more uniform RS profile across the part. The exorbitant computing time does not allow the simulation of additional cuts. The predicted RS profile should therefore be extracted in the area of the insert exits for down milling operation.
It is also suggested to study the distribution of σxx as function of the depth beneath the machined surface through the zero and first order statistical moments of these distributions. The fundamental idea is to compare two different distributions by comparing their moments. These moments are measures of the shape of a set of points. The zero order statistical moment is a measure of the area under the curve. The first order moment is a measure of the distribution of the area of a shape in relation to an axis. Given a function y(x),the zero and first order statistical moments are defined by Eqs. (8) and (9),respectively

Due to the discrete format of the function y(x),the definite integrals are approximated using the trapezium rule. For the N data points within the integration range, 0 = x1<x2<…xk<…xN = xp,the approximation to the integrals becomes
When applied to the spatial distribution of σxx,the units of the moments I0 and I1 are (N/mm) and (N),respectively. Multiplying these moments by the width of cut b,assumed to be equal to 1 mm,results in modified moments I0* and I1* whose units are (N) and (N•mm). I0* and I1* are equivalent to force and torque,respectively. The modified moments I0* and I1* are plotted in Figs. 18 and 19,respectively,along with the experimental data and for the different cuts. Figure 18 shows that the modified zero moment I0* tends toward the experimental value faster in the area of the insert exit compared to the area of the insert entry. It confirms the necessity to extract the predicted RS σxx, which is representative of the experimental data,in the area of insert exit. Although the maximum value of σxx on the surface and the depth of compressive RS generated by the fourth cut are close to the experimental data in the area of the insert exit,as demonstrated in previous paragraph,the 40% discrepancy between the predicted and experimental I0* indicates that the predicted and experimental area under the RS curve are still different. This underlines that the maximum value of σxx on the surface and the depth of compressive RS are necessary to characterize the RS profile, but they are not enough. The area under the curve or I0* is another characteristic that should be considered to characterize the RS profile. Furthermore,different RS profiles could exist for a given triplet (the maximum value of σxx on the surface,depth of compressive RS,area under the curve). It is therefore important to use I1* as an additional characteristic of the RS profile,to measure the distribution of the area under the curve in relation to an axis. Figure 19 shows that,although the modified first order moment I1* tends toward the experimental value faster in the area of the insert exit compared to the area of the insert entry,70% discrepancy still exists between predicted and experimental values. It clearly indicates that the predicted RS profile is still different from the experimental profile, even after the fourth cut,as shown in Fig. 14. For the fourth cut and at the insert exit position x = 160 μm,the percent error δ of the different characteristics of the predicted RS profile σxx compared to the experimental data are evaluated using Eq. (7). They are equal to 6%,20%,40% and 72% for the maximum values of σxx on the machined surface,the depth of the compressive RS zone,the modified moment I0* and I1* ,respectively. These errors might be considered reasonable and acceptable,given the large errors induced by the measurement techniques of RS. Assuming that the experimental data are very accurate, further reduction of the discrepancies between prediction and experimental data would require the simulation of additional cuts,leading to the accumulation of the plastic deformation and the enhancement of the RS profile. However,the exorbitant computing time would be the price to pay.
 |
| Fig. 18 Zero order statistical moment of compressive RS component σxx distributions |
 |
| Fig. 19 First order statistical moment of compressive RS component σxx distributions |
In this paper,the effects of four sequential cuts in side milling of Ti6Al4V on chip formation and RS have been investigated using FEM. This study has the uniqueness of dealing with variable uncut chip thickness in the sub-micrometre range. Since the uncut chip thickness is very small compared to the cutting edge radius,it is below the critical uncut chip thickness leading to a ductile machining regime,which is characterized by a continuous chip formation. The chips curl toward the tool for the first cut than toward the machined surface for the subsequent cuts. The thrust force in the first cut is higher than those obtained during the subsequent 3 cuts. The magnitude of the thrust force is aμmost two times higher than that of the cutting force. The sequential cuts have no noticeable effect on the cutting force. The machining-induced temperatures are much below those for phase transformation and consequently there are no RS due to phase transformation. It is found that the mechanical loads are the dominant factor on the residual stress distributions. The depth of the layer affected with plastic deformation increases with the number of cuts. The magnitude of compressive RS in the cutting direction and their depth beneath the machined surface increase with the number of cuts and tends toward the experimental profile. The predicted RS in the fourth cut,which are measured in the area where the insert exits the workpiece,are in reasonable agreement with the experimental results. It is concluded therefore that the RS should be measured toward the area where the insert exits the workpiece in down milling process. The simulation of a number of sequential cuts due to the consecutive engagements of the insert is required in order to capture the gradual accumulation of the RS before reaching a stabilized RS level.
As further development,it is suggested to control the machining-induced RS through the optimization of the selection of the cutting parameters (feed,velocity) for consecutive cuts. It is also important to study the effect of the roughing process on the depth of RS. Another aspect could be the effect of the plowing and prow formation at the insert exit area in down milling process and its effects on the surface integrity. Finally,developing enhanced techniques and approaches for reducing the exorbitant computing time is required.
| 1. | Dehmani H, Salvatore F, Hamdi H (2013) Numerical study of residual stress induced by multi-steps orthogonal cutting. The 14th CIRP conference on modeling of machining operations, Turin |
| 2. | Zhao HW, Liu C, Cui T et al (2013) Influences of sequential cuts on micro-cutting process studied by smooth particle hydrodynamic (SPH). Appl Surf Sci 284:366-371 |
| 3. | Schulze V, Osterried J, Strauß T et al (2012) Analysis of surface layer characteristics for sequential cutting operations. J Heat Treat Mater 67(6):347-356 |
| 4. | Schulze V, Osterried J, Strauß T (2011) FE analysis on the influence of sequential cuts on component conditions for different machining strategies. Proc Eng 19:318-323 |
| 5. | Li JL, Jing LL, Chen M (2009) An FEM study on residual stresses induced by high-speed end-milling of hardened steel SKD11. J Mater Process Technol 209(9):4515-4520 |
| 6. | Outeiro JC, Umbrello D, M'Saoubi R (2006) Experimental and FEM analysis of cutting sequence on residual stresses in machined layers of AISI 316L steel. Mater Sci Forum 524-525:179-184 |
| 7. | Ee KC, Dillon OW Jr, Jawahir IS (2005) Finite element modeling of residual stresses in machining induced by cutting using a tool with finite edge radius. Int J Mech Sci 47:1611-1628 |
| 8. | Guo YB, Liu CR (2002) FEM analysis of mechanical state on sequentially machined surfaces. Int J Mach Sci Technol 6(1):21-41 |
| 9. | Liu CR, Guo YB (2000) Finite element analysis of the effect of sequential cuts and tool-chip friction on residual stresses in a machined layer. Int J Mach Sci Technol 42:1069-1086 |
| 10. | Sasahara H, Obikawa T, Shirakashi T (1996) FEM analysis of cutting sequence effect on mechanical characteristics in machined layer. J Mater Proc Technol 62:448-453 |
| 11. | DEFORM 2D®. FEM software package, revision 10. Scientific Forming Technologies Corporation |
| 12. | Calamaz M, Coupard D, Girot F (2008) A new material model for 2D numerical simulation of serrated chip formation when machining titanium alloy Ti-6Al-4V. Int J Mach Tools Manuf 48:275-288 |
| 13. | Calamaz M, Coupard D, Nouari M et al (2011) Numerical analysis of chip formation and shear localisation processes in machining the Ti-6Al-4V titanium alloy. Int J Adv Manuf Technol 52:887-895 |
| 14. | Ozel T, Thepsonthi T, Ulutan D et al (2011) Experiments and finite element simulations on micro-milling of Ti-6Al-4V alloy with uncoated and CBN coated micro-tools. CIRP Ann Manuf Technol 60:85-88 |
| 15. | Queheillalt DT, Choi BW, Schwartz DS et al (2000) Creep expansion of porous Ti-6Al-4V sandwich structures. Metall Mater Trans A 31:261-273 |
| 16. | Chen L, El-Wardany TI, Harris WC (2004) Modelling the effects of flank wear land and chip formation on residual stresses. CIRP Ann 53(1):95-98 |
| 17. | Alvarez R, Domingo R, Sebastian MA (2011) The formation of saw toothed chip in a titanium alloy: influence of constitutive models. J Mech Eng 57:739-749 |
| 18. | Özel T, Sima M, Srivastava AK (2010) Finite element simulation of high speed machining Ti-6Al-4V alloy using modified material models. Trans NAMRI/SME 38:49-56 |
| 19. | Matsumoto Y, Barash MM, Liu CR (1986) Effects of hardness on the surface integrity of AISI 4340 steel, ASME. J Eng Ind 108:169-175 |
| 20. | Wu DW, Matsumoto Y (1990) The effect of hardness on residual stresses in orthogonal machining of AISI 4340 steel. J Eng Ind 112(3):245-252 |