 2015, Vol. 3
The article information
- Jian-Bo Qi, Guang-Xin Wu, Jie-Yu Zhang
- Mechanical properties of U-0.95 mass fraction of Ti alloy quenching and aging treatment: a first principles study
- Advances in Manufacturing, 2015, 3(3): 244-251
- http://dx.doi.org/10.1007/s40436-014-0090-1
-
Article history
- Received: 2014-03-10
- Accepted: 2014-10-23
- Published online: 2014-11-26


2 China North Nuclear Fuel Co. Ltd., Baotou 014035, People's Republic of China
Uranium alloys have wide applications in the nuclear power, aerospace and medicalindustries. In addition,they can be used as special constructional materials because of high density. Uranium exists in three solid polymorphs at different temperatures:aphase (face-centered orthorhombic,<667.7º C),b phase (body-centered tetragonal,667.7-774.8º C) andcphase (body-centered cubic,774.8-1 132.3º C). The three polymorphs are of low strength and high chemic activeness. Alloying method can improve the strength,stiffness,corrosion resistance and toughness of uranium efficiently,while reactive activeness decreases obviously in atmosphere phenomena. Element Ti has high solubility inc-uranium (γ-U) but it hardly dissolves ina-uranium (X-U). Therefore it can be added in uranium as a promising element to improve the mechanical properties of uranium through heat treatment [1, 2].
It is well known that U-Ti alloys can form a wide variety of metastable structures [1, 3, 4, 5, 6] after quenching to room temperature,which improves the strength on account of no diffusion martensitic phase transformation. After quenching,the U-0.95 mass fraction of Ti alloy is acicular orthorhombicaphase [5]. It precipitates and forms Guinier-Preston (G.P) zones simultaneously while two Ti layers are formed [6] during the initial stage of aging. Overaging occurs at higher aging temperature and with longer aging time,and quenched acicular martensite is decomposed into equilibrium phases ofa-U and U2Ti in the process. The orientation relationship between the precipitate U2Ti and matrixa-U is described in Refs. [7, 8, 9, 10, 11]. There are three relationships including (0001)U2Ti//(100)U, (0110)U2Ti//(010)Uand (2110)U2Ti//(010)U. The (0110)U2Ti //(010)Uorientation is selected to set up interface structure, and the following calculation is also based on the structure of (0110)U2Ti//(010)Uinterface.
First principles based on quantum mechanics are appropriate for explaining the differences of the mechanical properties including elastic and rupture properties. There have been lots of reports about first principles calculating crystal structure and elastic constants of pure uranium [12, 13, 14, 15]. However,there is limited investigation about strengthening mechanism for quenching and aging treatment of U-Ti alloy. Previously,some basic parameters ofc-U and a-U structures have been calculated,including lattice constants and elastic modulus [16],etc. In this paper,the elastic modulus,ideal tensile strength and Griffith rupture energy of heat treatment U-0.95 mass fraction of Ti alloy are calculated based on first principles method. 2 Computational methods
The total energy of the interface was calculated with the density functional theory (DFT) and plane wave pseudopotential methods [17]. The convergence of results with respect to energy cutoff and k-point was carefully considered. A plane wave basis set was used to represent the Kohn-Sham wave functions with an energy cutoff of 400 eV. Calculation was implemented in the Vienna ab initio simulation package (VASP) code [18] based on DFT. In this paper,we employed the generalized gradient approximation (GGA) as well as Perdew Burke and Ernzerhof (PBE) [19] function for electron exchange and correlation. The interaction between the ion core and valence electrons of the atoms was described by the Vanderbilt ultrasoft pseudopotential [20].
The quenching martensite of U-0.95 mass fraction of Ti alloy is still orthorhombic crystal,thus the elastic properties can be evaluated by means of mechanical stability criteria and Voigt-Reuss-Hill (VRH) [21] approximation.
The ground state structure of the alloy lattice was optimized until the total force on each ion converged within 0.1 eV/nm. With respect to 16 atoms U-0.95 mass fraction of Ti solid solution,G.P zones and U2Ti/U interface layers, the numerical integration of the Brillouin Zone (BZ) was performed using a discrete 4×5×2,4×7×1and 3×4×1 Monkhorst-Pack [22] k-point sampling,respectively. Each cleaved surface contained 12 atom layers that constructed an interfacial layer. 3 Results and discussion 3.1 Atomic position preference
The solid solution supercell and G.P zones structure with two Ti atom layers were set up with the actual atom occupation methods during initial stage of orthorhombic U-0.95 mass fraction of Ti alloy (see Fig. 1). The different atom site interfaces between hexagonal U2Tiand orthorhombica-U during overaging stage are shown in Fig. 2.
 |
| Fig. 1 Schematic representation of U-0.95 mass fraction of Ti alloy a solid solution structure,b G.P zones structure of aging (The blue and red spheres indicate U and Ti atoms,respectively.) |
 |
| Fig. 2 According to the distinct occupying sites of atoms,1,2,3 and 4 set different U2Ti/U interfaces during overaging (The blue and red spheres indicate U and Ti atoms.) |
The total energies of different layer intervals for G.P zones and U2Ti/U interfaces were calculated and presented in Table 1. It can be seen that the enrichment Ti atoms form the G.P zones and the layer interval is about 0.17 nm. The energy is lower compared with the energies in other sites. The U-U interval closer than 0.18 nm indicates that U-Ti atoms interaction is stronger,which makes G.P zones strength higher.

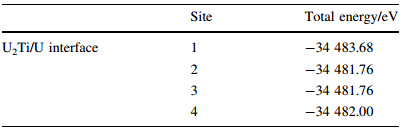
From Table 1,it also can be seen that the reasonable distance is 0.15 nm between U2Ti slab and U slab. The total energies of U2Ti/U interface with different occupation sites are presented in Table 2. It is shown that site one has the most negative energy,which means that it is the atomic optimal position. Therefore,this structure was usually selected to calculate the elastic property and Griffith fracture energy of interface.
Assessing the ideal tensile strength of a constructional material is very important for its engineering applications, which is closely related to both the fractural origin and toughness in a defect-free crystal. Using first principles approaches,the ideal strength can be determined as the inflexion on the stress-strain curves for the materials under the process of tensile strain step by step. The ideal tensile strength was calculated for uniaxial stress in tension. The lattice vectors increased slightly,which led to deformation in the direction of the imposed stress. At each step,both other two vectors perpendicular to the strain relaxed simultaneously with the iteration calculation until the orthogonal stress vanished,which meant that the maximum stress was less than 0.05 GPa [23, 24]. Meanwhile,all the internal freedoms of the atoms were fully relaxed at each step. At each next cycle step,the starting atomic positions were taken from the previous step,which ensured that the stress-strain curves were continuous.
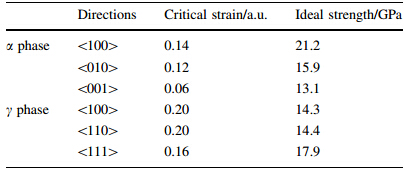
The γ phase in U-Ti alloy before quenching and quen-cheda x' phase in U-Ti alloy were selected to calculate the stress-strain curves for the crystal under tensile strains. c phase crystal orientations including <100>,<100> as well as <111> and orthorhombica x' phase orientation <100> are representative for tensile strength. Therefore,tensile strains are of four main axial directions,i.e.,<100>direction for orthorhombic,and <100>,<110>as well as <111> directions for cubic structure. When the curve reaches a maximum stress point,it can be defined as the ideal strength. Figure 3 shows the stress-strain behaviors of γ-UTi and a-UTi alloy,in which tension is selected along the low index orientation. For thea-UTi alloy,stress-strain curve is shown in Fig. 3a and its anisotropy can be obviously revealed. The \100[orientation ideal tensile strength is 21.2 GPa as the strain is 14 %,which is high strength direction. The <010>orientation ideal tensile strength is 15.9 GPa as strain is 12 %. The strain is bigger than 34 % when fracture occurs. This direction possesses well toughness. The <001>orientation ideal tensile strength is 13.1 GPa as the strain is 6 %,which is the easiest split direction under tensile strain in the engineering applications. Therefore material design for high mechanical performance should be considered. As shown in Fig. 3b,γ-UTi alloy <100> and <110> directions are ‘‘soft’’ crystal orientation. The stress is negative at the beginning of the strain changing. The negative value corresponds to the crystal lattice vector mutation for both directions perpendicular to the tensile direction. This phenomenon has a close relationship with structure changing during deformation of γ-UTi alloy. When the strain values of\100[and\110[orientations reach 20 %,the ideal tensile strength values are 14.3 GPa and 14.4 GPa, respectively. Then thecphase is still not ruptured until the strain values in <100> and <110> directions reach 24 % and 56 %,respectively. It shows that the toughness is relatively well.
 |
| Fig. 3 Ideal tensile strength of U-0.95 mass fraction of Ti alloy |
Table 3 summarizes the ideal strength values before and after quenching UTi alloy in several common low miller index crystallographic directions,along with the corresponding critical strain.
 |
Elastic modulus is an important physical quantity,which can characterize mechanical property and represent stiffness of a solid material. In fact,elastic modulus essentially reflects the magnitude of interatomic force.
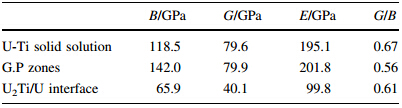
First principles method was used to calculate the elastic properties for U-0.95 mass fraction of Ti alloy,and the results are shown in Table 4.The G/B ratio can be used to describe the brittle or ductile behavior for a solid material. Furthermore,it is correlative to the microhardness. The lower G/B value denotes the better ductility. According to Pugh’s empirical rule,a critical value of G/B =0.57 is applied to distinguish the ductile and brittle materials. In general,the better brittleness (larger G/B value) and the higher Vickers hardness result in the worse toughness. The aging production of G.P zones with fine precipitation has larger modulus. It can be seen from Table 4that G.P zones possess relatively large elastic modulus,low G/B value, well strength and toughness. Over aged decomposed equilibrium phasea-U and U2Ti precipitation form loose structure,which results in the decrease of the strength and toughness. Simultaneously,the U-Ti solid solution is strong in nature according to Pugh’s empirical rule after quenching and aging heat treatment. Therefore,the excellent mechanical properties could be obtained by reasonable quenching and aging treatment.
 |
Interaction levels of electrons among atoms determine the mechanical properties of the interface in nature. Hence it is necessary to investigate the electronic structure of G.P zones and U2Ti/U interface. We used the density of states (DOS) to illuminate valence electronic hybridization of U and Ti atoms. On the basis of above calculation,the changes of the mechanical properties were investigated. According to the DOS during the heat treatment,as shown in Fig. 4b,before adding Ti atoms,the electronic DOS peaks ofa-U atom on both sides of the Fermi energy level are sharp and narrow,which indicates that the valence electrons of the U atoms have strong localization property. After adding Ti atoms,as shown in Fig. 5,the DOS peaks of U matrix become broaden and mild close to the Fermi energy level,which indicates that the localization property seems to weaken while covalent character trends to increase. Comparing Fig. 4a with Fig. 5a,the material strength increases with the decrease of the toughness. When Ti content rises,this trend is more obvious. As a result,the strength of the U matrix could be improved effectively by adding a small amount of alloy elements and using heat treatment.
 |
| Fig. 4 DOS image |
 |
| Fig. 5 DOS image of U-0.95 mass fraction of Ti alloy |
For aging process to divide,in the initial stage of aging,Ti atoms gather in certain crystallographic plane of U matrix. Due to the relative high energy for U(010) plane,Ti atoms are easy to gather in this process and form the solute atom segregation,referred to G.P zones. As shown in Fig. 5a,it is a coherent relationship between G.P zones anda-U matrix, which has the coherency strain zones to improve the resistance to deformation and allow higher strength and hardness for the alloy. With the aging temperature rising and aging time increasing,Ti atoms segregations proceeding continues and ordering will occur. It is still called G.P zone which remains the coherent relationship. It is shown that the lattice distortion gets to enlarge around the reaction zones due to higher distortion energy. Therefore,the effect of aging reinforcement seems to be more significant and reaches the maximum strengthening phase of alloy. With the further development of the aging process,when the segregation ratio of Ti atoms to U atoms is from 1 to 2,the transition phase formation is similar to U2Tistructure. Because of the larger changes in the lattice constants,the coherent relationships with matrix begin to destroy,namely the coherent distortion abates in surrounding matrix. The impediment effect of dislocation movement decreases and the reflection on the hardness declines. Thus it can be seen that the presence of coherent distortion is an important factor that can cause the strengthening for aging alloy. An independent U2Ti stable phase forms,namely the formation of U2Ti/U interface when U2Ti is completely precipitated from U matrix solid solution. The coherent relationship with the matrix is completely destroyed,and precipitations have their own independent lattices. Thereby the lattice distortion will disappear. With the increase of aging temperature and time,U2Ti phase particles aggregate and grow up,and the strength,hardness and toughness of the alloy drop further. This process refers to as ‘‘over aged’’,as shown in Table 4 and Fig. 5b. U2Ti precipitations gather to grow up and become thick. The lattice distortion energy can be calculated as follows:

As shown in Fig. 5,valence electronic orbits are 3d24s2 with Ti atom and 5f3 6d1 7s2 with U atom. It can be seen that the influence of U-5f orbital electrons cannot be neglected. Comparing the DOS images of G.P zones and U2Ti/U interface in which the region range is from-21.3 eV to-15.5 eV under the Fermi energy,DOS value is mainly dominated by U-6porbital electrons. Because of U-5fand Ti-3delectrons, the G.P zones have the relatively higher eigenvalue (79.7 states/eV) of the DOS at the Fermi energy and the peak value nearest to Fermi energy is up to 84.3 eV when the energy is -0.09 eV. It shows the stronger localization character for valence electrons. After emerging tiny precipitation and forming coherent interface layer,the peak value nearest to Fermi energy (67.9 states/eV) shifts to lower energy (-0.42 eV) and becomes mild close to Fermi energy ranging from -5 eV to 0 eV,which shows strong covalent bond character. U-5f/7sand Ti-3d/4sorbital hybridization increases to some extent,which indicates that the valence electrons localization decreases and interaction effect increases. Meanwhile the material has stronger adhesion performance and higher strength. There are peaks on both sides of Fermi level,and Fermilevel DOS appears atthe bottom. Itis bonding among atoms that possess strong covalent bond characteristic, which can lead to the increase of strength and decrease of toughness. When U2Ti structure appears and U2Ti/U interface is formed,valence electrons hybridization decreases; covalent bond proportion increases; the strength and toughness decline. According to above analysis,we can conclude that strength increases and toughness declines during the aging process. With the development of U-Ti alloy aging process,bonding effects variation between Ti and U atoms can affect alloy strength and toughness because of the change of bulk electronic structure. Consequently,electronic structure can affect mechanical properties of whole bulk material. 3.4 Griffith rupture energy
Griffith rupture energy WGrif is a rough approximation to the mechanical properties of an interface. It is defined as the energy needed (per unit area) to reversibly divide an interface into two free surfaces. G.P zone is the layer of Ti enrichment surface with U surface. The overaging layer is U2Ti surface with U surface. According to this definition, the Griffith rupture energy (WGrif) of materials crystal plane can be estimated as 2γ,where γ is surface energy obtained by Eq. (2). The WGrif of G.P zones and U2Ti/U interface can be obtained by Eqs. (3) and (4)[25, 26],respectively.
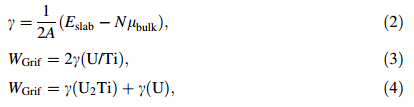
The results show that the values ofWGriffor G.P zones and U2Ti/U interfacial structures are 4.67 J/m2 and 3.83 J/m2 , respectively. It means that the G.P zones exhibit a larger value than the equilibrium structure of U2Ti/U interface, thereby the G.P zones structure results in the stronger interfacial strength. 3.5 Experimental verification
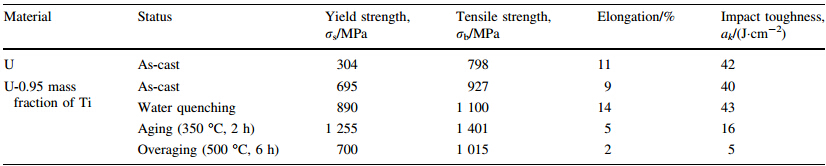
U-0.95 mass fraction of Ti alloy was prepared by 20 kg vacuum induction melting furnace. Impurity components of the selected uranium are shown in Table 5. Uranium and sponge titanium were put into induction melting furnace,in which the vacuum degree was 0.1 Pa and the temperature rose to 1 350º C. Pouring was proceeded after heat preservation for 10 min. Then mechanical test samples were made after solidification,as shown in Fig. 6. Heat treatment process included solid solution treatment (830º C,2 h) and water quenching,then 350º C,2 h and 500º C,6 h aging, respectively. By means of image analyzer,microscopic morphologies are shown in Figs.7-9. It can be seen clearly that there is acicular martensite in quenching organization, and there is also no obvious change of microscopic morphology after 350º C,2 h aging,as shown in Figs.7 and 8. Overaging occurred after 500º C,6 h aging treatment,and tiny U2Ti precipitation was separated from U-Ti alloy matrix,as shown in Fig. 9. The mechanical performances were tested via mechanical testing & simulation (MTS) universal testing machine (see Table 6). It can be seen that the strength and toughness of quenched U-0.95 mass fraction of Ti alloy are better than as-cast. The strength increases further while toughness declines for over aged U-0.95 mass fraction of Ti alloy. When overaging occurs,both strength and toughness trend to drop. Therefore,the experimental conclusion is consist with previous computational results.

 |
| Fig. 6 Sample dimension scheme of U and U-0.95 mass fraction of Ti alloy |
 |
| Fig. 7 Microscopic morphology of quenched U-0.95 mass fraction of Ti alloy |
 |
| Fig. 8 Microscopic morphology of 350℃,2 h aged U-0.95 mass fraction of Ti alloy |
 |
| Fig. 9 Microscopic morphology of 500℃,6 h aged U-0.95 mass fraction of Ti alloy |
In conclusion,first principles method was performed to investigate the mechanical properties of U-Ti alloy with quenching and aging treatment. The geometric configurations and total energy of the U-0.95 mass fraction of Ti alloy were optimized in the process of quenching and aging. The results show that the aging treatment can improve the mechanical properties with emerging of G.P zones,coherent lattice precipitation and a small quantity of like U2Ti structure preprecipitation. The overaging would occur with long aging time or at high aging temperature,and the quenching state U-Ti alloy was decomposed to generate equilibrium phasea U and U2Ti precipitation with strength decreasing. It is mainly because of generating a U2Ti new phase and losing the coherent relationship of U/U2Ti,which leads to the drop of the cohesion force. In addition,the analysis of electronic DOS and the value ofWGrifcan also get this conclusion.
Acknowledgments Computational resources were supported by Shanghai Supercomputer Center and High Performance Computing Center,Shanghai University. The work described in this paper was supported by the National Natural Science Foundation of China (Grant Nos. 51074103 and 51104098) and Shanghai Scientific Selection and Cultivation for outstanding young teachers in special fund and Innovation Program of Shanghai University (Grant No. SDCX2012011).| 1. | Baschwitz R, Colombie M, Foure M (1968) Etude du revenue des phases orthorhombiques metastables d'all-iages uranium-titane tetrant 4, 8 et 9, 5 at% de titane. J Nucl Mater 28:246-256 |
| 2. | Federer JI (1969) Effect of alloy additions and heat treatments on the mechanical properties of U-0.5Ti alloy. U. S. Atomic Energy Commission Contract Report, Tenn, Report No. ORNL-TM-2482 |
| 3. | Harding AG, Waldron MB (1958) Transformation in uranium alloys with high solute solubility in the B. C. C. gamma phase, part I. Preliminary observations on the “banded structure” produced by non equilibrium transformations in uranium alloys. Atomic Energy Research Establishment, Harwell, Report No. AERE-M/R-2673 |
| 4. | Anagnostides M, Colombie M, Monti H (1964) Metastable phase in the alloys uranium-niobium. J Nucl Mater 11:67-76 |
| 5. | Douglass DL (1961) The structure and mechanical properties of uranium-titanium martensites. Trans ASM 53:307-319 |
| 6. | Anagnostidis M, Baschwitz R, Colombie M (1966) Phase metastables dans les alliages uranium-titane.MemSci Rev Met 63:163-168 |
| 7. | Speer JG, Edmonds DV (1999) Aging of αa ' martensite in U-0.77Ti. Acta Mater 47(7):2197-2205 |
| 8. | Yakel HL (1969) A Fortran-language program for plotting stereographic projections of lattice plane normals and directions. U. S. Atomic Energy Commission Contract Report, Tenn, Report No. W-7405-ENG-26 |
| 9. | Hatt BA, Roberts JA (1960) The ω-phase in zirconium base alloys. Acta Mater 8:575-584 |
| 10. | Hatt BA (1966) The orientation relationship between the gamma and alpha structures in uranium-zirconium alloys. J Nucl Mater 19:133-141 |
| 11. | Stelly M (1972) Precipitation isotherme dans des alliages d'uranium- cinetique de precipitation. Commissariat a l'Energie, Atomique, Centre d'Etudes Nucleaires, Saclay, Report No. CEA-R-4326 |
| 12. | Skriver HL, Andersen OK, Johansson B (1978) Calculated bulk properties of the actinide metals. Phys Rev Lett 41:42-45 |
| 13. | Wills JM, Eriksson O (1992) Crystal structure stabilities and electronic structure for the light actinides Th, Pa and U. Phys Rev B 45:13879-13890 |
| 14. | Söderlind P, Eriksson O, Johansson B et al (1994) Electronic properties of f-electron metals using the generalized gradient approximation. Phys Rev B 50:7291-7294 |
| 15. | Söderlind P (2002) First-principles elastic and structural properties of uranium metal. Phys Rev B 66:085113 |
| 16. | Hohenberg PC, Kohn W (1964) Inhomogeneous electron gas. Phys Rev 136:B864-B871 |
| 17. | Kohn W, Sham LJ (1965) Self-consistent equations including exchange and correlation effects. Phys Rev 140:A1133-A1138 |
| 18. | Kresse G, Furthmuller J (1996) Efficient iterative schemes for ab initio total-energy calculations using a plane-wave basis set. Phys Rev B 54(16):11169-11186 |
| 19. | Perdew JP, Burke K, Ernzerhof M (1996) Generalized gradient approximation made simple. Phys Rev Lett 77:3865-3868 |
| 20. | Vanderbilt D (1990) Soft self-consistent pseudopotentials in a generalized eigenvalue formalism. Phys Rev B 41:7892-7895 |
| 21. | Hill R (1952) The elastic behaviour of a crystalline aggregate. Proc Phys Soc 65:349-354 |
| 22. | Monkhorst HJ, Pack JD (1976) Special points for Brillouin-zone integrations. Phys Rev B 13:5188-5192 |
| 23. | Krenn CR, Roundy D, Morris JW (2001) Ideal strengths of bcc metals. Mater Sci Eng A 319-321:111-114 |
| 24. | Clatterbuck DM, Chrzan DC, Morris JW (2003) The ideal strength of iron in tension and shear. Acta Mater 51:2271-2283 |
| 25. | Chatterjee A, Niwa S, Mizukami F (2005) Structure and property correlation for Ag deposition on α-Al2O3: a first principle study. J Mol Graphics Model 23:447-456 |
| 26. | Gong HR (2009) Electronic structure and related properties of Pd/ TiAl membranes. Intermetallics 17:562-567" |