 2015, Vol. 3
The article information
- Harald Rødseth, Terje Skarlo, Per Schjølberg
- Profit loss indicator: a novel maintenance indicator applied for integrated planning
- Advances in Manufacturing, 2015, 3(2): 139-150
- http://dx.doi.org/10.1007/s40436-015-0113-6
-
Article history
- Received: 2015-02-20
- Accepted: 2015-05-06
- Published online: 2015-06-18


2 Department of Technology, Sør-Trøndelag University College, Trondheim, Norway
In a production system where raw materials are being transformed into final products,both production and maintenance planning are fundamental parts of production. Furthermore,an essential part in planning is to implement the Deming cycle which follows the logic Plan-Do-Check- Act [1]. The most important reason for following this logic is to ensure continuous improvement of the planning process and generate better results in terms of improved production assurance and reduced costs. However,a significant challenge in planning today is "silo thinking". This phenomenon may occur when an asset with several disciplines and departments performs activities that affects each other, and an unwanted result leads to sub-optimal results in the business. This challenge requires a more integrated plan and is called integrated planning (IPL) [2]. In particular this is a crucial research topic at the Center for Integrated Operations in the petroleum industry [3]. There exist several proposed models for IPL,but each has some specific shortcomings in being scoped to a specific batch production and not considering a more generic framework [4, 5, 6, 7, 8, 9]. Therefore,a more generic IPL framework has been developed and elaborated [10]. Based on research,both asset management and the measurement of the hidden factory are essential in order to operate the IPL framework [1].
Today,the measurement of the "hidden factory" is performed through a key performance indicator (KPI) in several industries that produce a product. A KPI is defined as a metric measuring how well the organisation or an individual performs an operational,tactical or strategic activity that is critical for the current and future success of the organisation [11]. This KPI is denoted overall equipment effectiveness (OEE) and measures different aspects of time losses in production. Hence,a high OEE value represents high effectiveness. OEE can be applied for different activities:
(i) Operational activities: measuring OEE in daily operation.
(ii) Tactical activities: a deviation of OEE may trigger a root cause analysis (RCA) where the root cause is identified and improvements are implemented in order to eliminate the root cause.
(iii) Strategic activities: investment in new machines may not be necessary if the value of OEE for existing equipment is too low and can be improved.
The strength of OEE is that this tool is shared between the production and maintenance teams and could therefore work as a KPI for IPL [12]. Still,a fundamental question in IPL would be what would be the profit loss in the company due to the hidden factory? Although OEE has proved to be a successful tool in industry,the weakness of this indicator is the lack to be expressed as a financial indicator. This will be important in order to perform a multidisciplinary decision based on profit loss indicator (PLI),where a low value for PLI indicate a good financial position and is expressed in a relevant monetary form,e.g USD. Furthermore,high value in OEE does not necessarily lead to a low PLI value. For example low number of quality defects of final product may result in a high OEE value,but could also result in high PLI value if it is expensive.
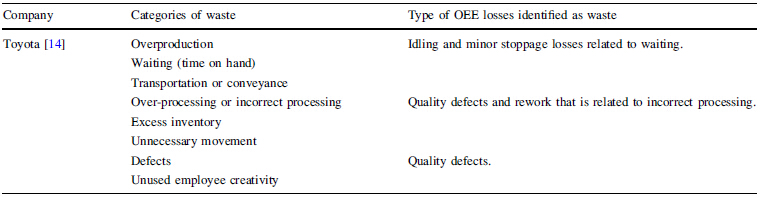
In addition to OEE,PLI will also calculate lost profit due to waste. The term waste includes both the contexts of waste treatment and disposal,and waste in manufacturing based on the principles from Toyota Production System (TPS) [13, 14]. In this article,waste treatment will focus on how raw material is extracted in a best manner and minimizing unextracted raw material,while TPS will for example focus on eliminating overproduction. Thus PLI will calculate what is the lost profit due to these two types of waste.
The objectives of this article are to: (i) propose a deviation approach for analysis of PLI; (ii) clarify important aspects regarding time losses and waste in production; (iii) develop a concept of PLI; (iv) demonstrate PLI through calculation in a case study in the saw mill industry.
An assumption of PLI is that it can be widely used in different industry branches. Therefore,the PLI concept is not only applicable in the saw mill industry but also in other industry branches such as process industry,oil&gas industry and manufacturing industry. The research method applied in this article includes both literature study and case results from earlier research. In addition,the demonstration of PLI is performed through a case study in the saw mill industry.
To achieve the objectives,the further structure is as follows. In Sect. 2 the deviation approach is studied and proposed for PLI. In Sect. 3 the time losses and waste in production are clarified and summarized. After these concepts are clarified,in Sect. 4 we propose a concept for PLI calculation. In Sect. 5 we suggest how to operationalize the PLI concept within IPL. Further in Sect. 6 we present results of PLI calculations from the case study,before discussions of results and drawing final conclusions in Sect. 7 2 Deviation analysis applied for PLI
In maintenance management it is vital to have properly identified and implemented maintenance performance in the organisation [15]. According to Al-Najjar,the maintenance performance is according to Al-Najjar defined as the indicator that provides the information required for mapping and judging the performance level of maintenance technically,financially or combined. In addition, KPIs for maintenance management seem to have the same meaning since it is defined to be a metric measuring how well the organisation or an individual performs an operational, tactical or strategic activity that is critical for current and future success of the organisation [11]. Such KPIs have been identified and evaluated through a case study for a Norwegian automotive supplier [16]. The objective was to propose a holistic framework for integrating KPIs based on the findings from the case study and important trends of increased integration in different industry branches. The result was a cause-and-effect relationship between both leading and lagging KPIs with respect to time losses in production. However,this framework does not elaborate how to detect a deviation and does not include waste in production,nor can it be expressed as a financial KPI.
When considering reliability theory,the terms "failure," "fault" and "error" are used. According to the IEC 60050-191 standard failure is the event when a required function is terminated [17]. Furthermore,fault is defined by this standard as "the state of an item characterized by inability to perform a required function,excluding the inability during preventive maintenance or other planned actions,or due to the lack of external resources". Finally, error is a "discrepancy between a computed,observed or measured value or condition and the true,specified or theoretically correct value or condition." In this article we will use the term "deviation" instead of "error." Furthermore, not all unacceptable performance measured from KPIs should be comprehended as a failure in the production system. For example,a high raw material cost can lead to an unacceptable value in PLI,but is not defined as a failure of the production system. Instead the term "required performance" is used which is not directly related to the term "failure" that is the case for the term "required function." Therefore,required function is a part of the required performance.
The KPI framework of deviation analysis is shown in Fig. 1. The deviation is measured for both leading and lagging KPIs. At a point in time t1 a status check is performed. Based on a combination of the measured value and trend,the KPI is evaluated to be acceptable. At a later point in time at t2 the same measurement is performed. Now,the measurement is out of the acceptable range of deviation. In order to obtain an acceptable deviation in the future, countermeasures must be implemented at operational, tactical or strategical levels.

The author also considered approaches for developing early warning indicators (EWIs) was established [19]. This approach consists of several steps where one decides how to detect deviation in measurement. Based on expert judgement and a fixed rule for deciding the deviation,traffic-light colour logic is used in order to evaluate a deviation. For EWIs,the following rules are used in order to evaluate a deviation based on expert judgement in industry:
(i) Green area: no warning. The technical condition is under control. Only further monitoring is necessary.
(ii) Yellow area: early warning. Further analysis should be performed in order to ascertain technical condition.
(iii) Red area: alarm. The technical condition is unacceptable and immediate action must be taken.
A case study of GDF SUEZ E&P Norway was performed demonstrated how this deviation logic was used in terms of measuring backlog of preventive maintenance [19]. In addition, the proposed framework for EWIs also measured production output. Therefore,PLI should be understood as an EWI. Amore holistic structured approach seems to be needed according to Al-Najjar [15]. The five steps in this deviation approach have been adapted for PLI and are shown in Fig. 2. The first step is to decidewhat to analyse. In this step,variables for PLI are measured leading to calculation and trending of PLI. Based on the value of PLI,it is evaluated if a deviation exists. If a negative deviation exists,the PLI value will be greater than 0 USD. In steps 2 and 3 in the deviation approach shown in Fig. 2,both tactical and strategic activities are performed which results in suitable RCA analysis. In step 4 operational,tactical and strategic activities are performed.
 |
| Fig. 2 Structured approach for deviation analysis adapted from [20] |
In the deviation approach there exist two types of deviations:
(i) Norm deviation. A deviation between what is "expected day" in production in order to meet the production plan.
(ii) Ideal deviation. A deviation from what is regarded as an "ideal day" in production. This view is used in TPS today where an ideal machine is,e.g.,defect free,can deliver on request at a time without wasting materials [14].
These types of deviations are shown in Fig. 3 as an annual accumulation of PLI. The norm value of PLI is based on the production plan and includes among others:
 |
| Fig. 3 Deviation roadmap for one year |
(i) Estimated prices for purchased material and sales price of processed material;
(ii) Planned production time and stop times due to planned maintenance.
Consideration of deviation from,an ideal perspective,is regarded by some companies as a time loss when the equipment is not producing due to planned stop or when no customer is asking for the product. If the ideal is no time losses during production,then the ideal deviation will be much greater.
The norm values of PLI will be used at an operational level whereas the ideal values of PLI will be used on a tactical or strategic level. 3 Hidden factory and waste elimination
The PLI is a monetary form which endorses the hidden factory with respect to both time losses and waste in production. The metaphor "the hidden factory" can be traced from the quality management field from the 1950s with Juran who challenged the industry by asking what present costs would disappear if all defects disappeared [21]. The methaphor "the hidden factory" was first introduced and documented in the maintenance field through the OEE measurement by Nakajima [22]. 3.1 Overall Equipment Effectiveness
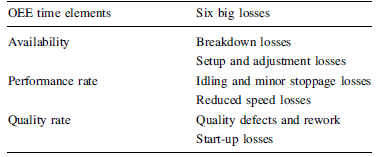
A tangible approach for measuring the hidden factory is measuring the KPI denoted OEE. The OEE value measures the hidden factory in terms of time losses as "the six big losses" [22]. In addition,the OEE is divided into measurements of a time parameter,or time elements,namely, availability,performance rate and quality rate (see Table 1).
The calculation of OEE is thoroughly elaborated by Nakajima and revitalized in more recent time thorough industry standards and user guides [12, 22, 23, 24]. In addition,we also consider practice and experience from industry which has successfully implemented OEE as a concept. By considering these sources there should be a sufficient and sound basis for the industry to implement and operationalise the OEE indicator with accurate calculations. Further in this section the calculation of OEE is explained more specifically. In overall,OEE is calculated by multiplying the availability (A),performance rate (PR),and quality rate (Q):

Definition of availability is based on reliability theory and is found in IEC 60050-191 for dependability and quality service [17]. A harmonized standard within maintenance terminology denoted as NS-EN 13306 defines availability to be [25]:
"Ability to be in a state to perform as and when required,under given conditions,assuming that the necessary external resources are provided"
In addition three notes are specified for this definition. First,it is specified that ability depends on the combined aspects of the reliability,maintainability and recoverability of the item and the maintenance supportability. Second,the standard outlines that required external resources,other than maintenance resources,do not affect the availability of the item although the item may not be available from the user's viewpoint. The third note specifies that availability may be quantified using appropriate measures or indicators and is then referred to as availability performance.
The calculation for availability rate is
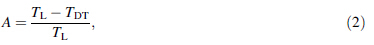
Downtime includes several time elements: breakdown, setup and adjustment losses,both preventive and corrective maintenance during loading time,breaks,changeover and cleaning,waiting for raw materials,and other reason for idling. Some time elements are also excluded from downtime such as unscheduled time,maintenance performed during unscheduled time and test production. Unscheduled time occurs as a result of no orders from customers. In addition,reasons such as no personnel and resources available,are also excluded from downtime. Maintenance performed during unscheduled time has several disadvantages,such as,artificial high OEE value and relating the pressure to reduce this type of time loss. 3.1.2 Performance rate
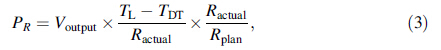
Performance rate in OEE calculations specifies both minor stoppages and reduced speed of production equipment. In the case study,a minor stoppage is considered to be under 0.5 min and is not specified with a failure code. If the saw is fully automated,all "minor stoppages" will be defined to be availability loss and the performance rate will be denoted as "speed rate" where the saw is only running with reduced speed compared with a reference speed.
The calculation for performance rate is:
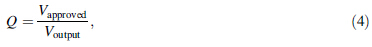
Quality is defined according to ISO 9000 to be the degree to which a set of inherent characteristics fulfil requirements [26]. One concrete measure for the quality losses in production measures both scrap and rework [12]. A generic term for these products would be defects or non-approved volume. An approach that focuses on minimizing these process failures is the method denoted as Six Sigma. One definition of Six Sigma is "an organised and systematic method for strategic process improvement and new product and service development that relies on statistical methods and the scientific method to make dramatic reductions in customer defined defect rates" [27]. This method was first introduced by Motorola in the 1980s and had a quality goal of only 3.4 defects per million opportunities (DPMO). Small DPMO can be more difficult to achieve in some industry branches than in others. However,some will claim that it is not the goal itself that matters,but more the systematic method offered through Six Sigma to improve the quality rate.
The calculation for quality rate is
The term "waste" is an essential principle in TPS. This is emphaized by a statement by Taiichi Ohono who is considered to be a key person within TPS [14]:
"All we are doing is looking at the time line from the moment the customer gives us an order to the point when we collect the cash. And we are reducing that time line by removing non-value-added wastes."
Based on this statement it is of interest to identify and measure "non-value-added wastes" as a financial number through the PLI. Table 2 compares waste described by the TPS concept and the time losses in OEE.
Another perspective of waste is from waste treatment and disposal [20]. Here waste is defined as "any substance or object which the holder discards or intends to discard". For PLI this will be measured through considering the extraction of raw material. 4 Development of PLI 4.1 Earlier PLI calculations in industry
This Section address the Challenge: What value would be realised in the business if the hidden factory was eliminated and resulted in 100% OEE? Based on an earlier case study in smelting plants,values for PLI are calculated,as shown in Table 3 [1].
For example 1,PLI for minor stoppages has been considered. This time loss was calculated for only one department in the plant. Thus,other PLI values such as availability losses and extraction of raw material losses had not been included. Extraction of raw material as the amount of mass in product left after processing. The interest of this example is that minor stoppages in general were not neccessarily regarded as significant since they occurred frequently but with small durations. However, when accumulating them on an annual basis this turned out to be a significant financial amount.
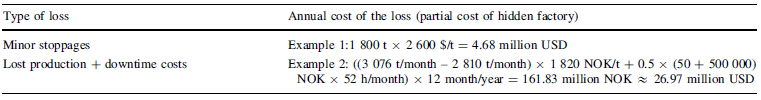
For example 2,both lost production and downtime costs were included for one department. The lost production was calculated by first finding the deviation between the sales price of the product and the raw material costs. Since this is an energy intensive production branch,both raw material costs and energy costs were included as raw material cost. This contribution was then calculated with the lost volume production which was found by comparing actual and planned production volume. For the downtime costs,the company included both preventive and corrective maintenance when calculating PLI. Since the downtime fluctuated with respect to duration of downtime and consumable costs for tool,labour and spareparts,the company calculated an average of these costs and distributed it over the year. The PLI value in this example also fluctuated frequently between 3% and 42% of the turnover from month to month. 4.2 Construction of PLI as model
Profit can be calculated by subtracting the costs from turnover in production. Based on this consideration PLI would be the sum of loss in turnover and loss in extra costs which is influenced by both the hidden factory and waste in production.
When calculating the PLI,the concept of life cycle profit (LCP) must be understood and relevant elements for PLI must be identified [28] (see Fig. 4). Another calculation concept is life cycle costing (LCC) and is found both in a standard within dependability management (IEC 60300-3- 3) and systems engineering [29, 30]. There seems to be some overlap of the concepts of LCC and LCP. In particular in the IEC standard,it is shown in Fig. 4 that costs regarding unavailability should be included in the LCC as loss in revenue. Furthermore,Wilson states that the unavailability costs should be included in the maintenance costs [31]. Since the unavailability includes loss due to both planned and unplanned maintenance,LCC has some similarities with the LCP concept.
 |
| Fig. 4 Illustration of LCP [28] |
In this article,we will distinguish between loss in turnover and extra costs modeled in the PLI models shown in Figs. 5 and 6. In Fig. 5,three categories have been established. The first category occurs when the customer is not willing to pay the same price for the product anymore. The cause of the price reduction is found in production as follows:
 |
| Fig. 5 Profit calculation during one day |
(i) The product is delivered too late or with defects to the customer due to production problems. This will result in penalty from the customer and should be regarded as reduced price of product.
(ii) The quality of the product delivered to the customer is degraded.
(iii) The original product has been changed to another purpose (e.g. from human food to animal food).
The second category considers volume loss in production to the market. The volume losses (availability loss, performance loss and quality loss) are caused by the time losses found in OEE. The third category is the extra costs in production. Examples of these cost elements could be raw material costs,CAPEX costs in terms of rental or investment in machines,production costs due to downtime, corrective maintenance costs,and preventive maintenance costs.
The term "gross profit" is here based on definitions from accounting theory and is explained to be sales revenue minus cost of sales [32]. In the case study we consider the gross profit to be the difference between sold volume from the end product and the costs of raw material. In this article the term "gross profit" is more simplified than the term used in accounting theory [32].
The calculation of all PLI elements for both turnover loss and extra costs is shown in Fig. 6. It divides the PLI elements into three dimensions. The first dimension is about the physical asset. The second dimension is about the accounting where it is possible to distinguish between turnover loss and extra costs. The last dimension is about the categories for time losses and waste where the user can analyse them separately. This cube is denoted as the PLI cube and is inspired by the concepts identified at the conceptual framework in GERAM which is a framework for enterprise engineering and enterprise integration and the cost element concept in the IEC standard for LCC [29, 33] (see Fig. 6). The purpose for this concept in PLI is to have a structured approach for tracing the elements within turnover losses and extra costs,rank these elements in a priority list,and also see the causality between the elements.
 |
| Fig. 6 PLI cube |
The dimension "process level" is partly calculated in the case study where the sawing process is analysed. However,it should be also possible to measure specific equipment in this process or system. In addition,it is possible to measure the PLI for the whole plant. In the accounting dimension it is possible to trace whether the financial loss is due to loss in turnover or extra cost. The third dimension is evaluating the specific time losses and waste in production. The waste consideration is found both in category of "utilisation","raw material" and "resource consumption". Furthermore,the utilisation is a balance between overproduction which is an extra cost and time loss due to overcapacity which is then regarded as a turnover loss. Resource consumption comprises tools and spare parts and use of consumables in production. For the case study,the element turnover loss due to time losses in availability (PA,T) and performance (PP,T) and raw material (PRM,T) is demonstrated in PLI calculation.
This cube will support an RCA and recommended actions. In order to calculate these indicators accurately and efficiently,it is necessary to have a suitable ICT structure. Open Platform Communications (OPC) is an important enabler for this ICT structure and regarded to be the technological basis for efficiently linking automation components with control hardware and field devices [34]. Furthermore,it also links management systems such as enterprise resource planning (ERP) and manufacturing execution systems (MESs). In addition,it should have several characteristics such as high performance and scalability
when PLI is measured. Furthermore,it should provide support for connecting information from computerized maintenance management system (CMMS) and financial numbers and visualising the PLI value in a dashboard. 5 IPL as a framework for PLI in a saw mill case study 5.1 IPL as a concept for PLI
For the case study we only focus on the sawing process at one production line,as shown in Fig. 7. In this case study a specific volume of raw material is being processed in the sawing process and results in sawn timber.
 |
| Fig. 7 Production line in the case study |
When measuring PLI value,a concept of IPL is proposed. When constructing a framework for IPL from maintenance management perspective,this concept will produce and conduct an integrated plan for technical condition. The proposed framework starts with the relevant production system and the environment in a macro model [10] (see Fig. 8).
 |
| Fig. 8 IPL framework for Oil & Gas Industry [10] |
Figure 8 divides the system into three levels. Level 1 describes the control through regulators restrictions and requirements. In addition,the market is positioned at this level and controlled through supply from the production system and demand from the customer. In Level 2,the production system onshore is modelled and in Level 3 the production system offshore is modelled. For a manufacturing system the Levels 2 and 3 should be aligned with the value chain. The "heart" of the IPL framework is the IPL loop. This loop is built on the Deming cycle and is outlined in Fig. 9 [10].
 |
| Fig. 9 IPL loop [10] |
This loop will ensure that the organisation has its own IPL business process where the Deming cycle encourages continuous improvement (see Fig. 9). Furthermore,it is expected that asset management as a concept will ensure the capability of IPL. When considering the case study from the saw mill,some updates in Fig. 8 are necessary. Firstly,the product is not oil or gas and therefore should be changed to the term "good product". Furthermore,Level 2 includes a processing plant. This might be valid for the smelting plant, but not for the saw mill since it delivers its products to a wholesaler,for example. Thus it is proposed to merge Levels 1 and 2 which are parts in the value chain and governed with a market mechanism with demand and supply and restrictions and requirements from regulatory,owners and management. Finally,it is uncertain to what degree saw mill industry applies external planning with other saw mill industry companies. However,this is not removed since it is valid for the oil and gas industry. Figure 9,however should not be modified since the principles for the following Deming cycle are also valid in this case study. 6 Results from PLI calculation of case study
This chapter presents the results from the saw mill industry. The industry addresses the time in the production with ideal, norm and actual values denoted as T*. These time contributions are time in sawing,availability and performance losses during the production period. All the norm input values are provided from the industry,whereas the ideal input variables are assumed values decided by the authors.
Further in Table 5 the extractions of raw material into different products are shown as percentages. The reason for this distribution is partly due to the raw material (raw timber) itself and that degree,to which the production can utilize the raw material. The main product and the byproducts, except for water,can be sold and have been given a financial sales value,Fsale. The financial value of the raw material,Fraw_material,is decided to be 76.9 USD/m3 and is the same for ideal,norm and actual value. We assume that 1 USD = 7.54 NOK.
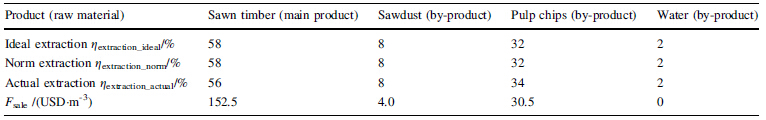
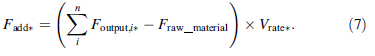
The volume of the raw material is denoted as Vraw_material. Based on the information of the extraction values and the sale value of the products,it is possible to find the value of each product when extracting the raw material. The financial value of the output,Foutput,i,in production of each product i, where * denotes if the values are ideal,norm or actual.

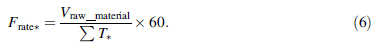
Furthermore the volume rates in production,Vrate/ (m3· h-1) is then calculated as follows:
The value adding rate from production,Vadd/(USD· h-1) is then:
The gross profit (G) in the production is

The profit loss due to deviation in raw material extraction is as follows:

The profit loss due to deviation in raw material extraction is
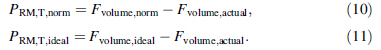
Finally the PLI is then as follows,with results in Table 6.
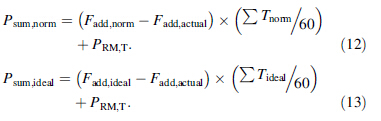
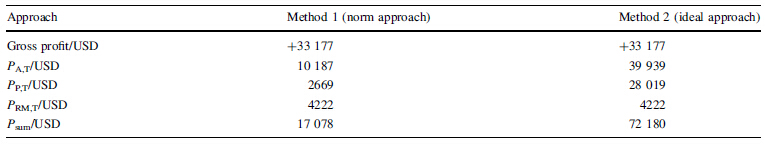
In this article we have developed an approach and framework for PLI and demonstrated it through a case study for an operation activity where a specific volume is produced from timber to sawn timber in the sawing process. In particular,we find out that the PLI is significantly different when comparing the two methods of deviation from norm and deviation from ideal. Comparison of method 1 and method 2 is possible but it requires caution and expertise within PLI. It is important to understand that these two methods are based on different premises. Method 1 will consider norm values from what is expected during production while method 2 will look for what can be improved when time losses and waste have been eliminated. Based on future research in this case study it will also be of interest to consider tactical and strategic actions based on the PLI value.
Furthermore,it is possible to use PLI for benchmarking between different companies and compare the PLI results. Here caution is also required. Since industry branches operate under different contexts and premises,both high degree of competence and experience in the industry and calculation of PLI is required from the benchmarking team.
In future the PLI should be demonstrated further including operational,tactical and strategic uses and applied through IPL. In particular it will be of interest to develop a financial KPI of maintenance backlog which can be used as a supplement for PLI. This can then be an important consideration when performing IPL. Also it is planned to perform future research about the PLI concept in several industry branches.
As a conclusion,we have developed a PLI concept which should be regarded to be novel with respect in contribution to both practice and theory. We see a huge potential for implementing this in the industry and also to contribute with theory of maintenance KPIs which are novel and applicable for IPL. As a final remark,we intend through further research and case studies to be in forefront in the PLI concept.
Acknowledgments We thank Center for Integrated Operations in the petroleum industry (IO Center) for funding this research. In addition,we sincerely thank the saw mill company Kjeldstad Trelast AS for making the case study possible; in particular,the support and important input from the Chief Engineer Frode Edvardsen in this company in order to perform the PLI calculations.| 1. | Rødseth H, Schjølberg P (2014) The importance of asset management and hidden factory for integrated planning. Adv Mater Res 1039:577-584 | |
| 2. | Powell D, Rødseth H (2013) ICT-enabled integrated operations: towards a framework for the integration of manufacturing- and maintenance planning and control. Paper presented at the advances in production management systems: sustainable production and service supply chains, Penn State University,2013-09-09-2013-09-12 | |
| 3. | Center I (2013) Annual Report 2013-Center for integrated operations in the petroleum industry | |
| 4. | Aghezzaf EH, Najid NM (2008) Integrated production planning and preventive maintenance in deteriorating production systems. Inf Sci 178(17):3382-3392 | |
| 5. | Kovács A (2005) Novel models and algorithms for integrated production planning and scheduling. Budapest University of Technology and Economics, Budapest | |
| 6. | Portioli-Staudacher A, Tantardini M (2012) Integrated maintenance and production planning: a model to include rescheduling costs. J Qual Maint Eng 18(1):42-59 | |
| 7. | Iravani SMR, Duenyas I (2002) Integrated maintenance and production control of a deteriorating production system. IIE Trans (Inst Ind Eng) 34(5):423-435 | |
| 8. | Kazaz B, Sloan TW (2013) The impact of process deterioration on production and maintenance policies. Eur J Oper Res. doi:10.1016/j.ejor.2012.11.052 | |
| 9. | Najid NM, Alaoui-Selsouli M, Mohafid A (2011) An integrated production and maintenance planning model with time windows and shortage cost. Int J Prod Res 49(8):2265-2283 | |
| 10. | Rødseth H, Schjølberg P (2014) Integrated planning: a novel concept for maintenance management. Paper presented at the EuroMaintenance 2014, Finland | |
| 11. | Kerzner H (2011) Project management metrics, KPIs, and dashboards: a guide to measuring and monitoring project performance. International Institute for Learning, Hoboken | |
| 12. | Koch A, Oskam A (2007) OEE for the production team: the complete OEE user guide. FullFact, Lieshout | |
| 13. | Williams PT (2005) Waste treatment and disposal. Wiley, Chichester | |
| 14. | Liker JK, Meier D (2006) The Toyota way fieldbook: a practical guide for implementing Toyota's 4Ps. McGraw-Hill, New York | |
| 15. | Al-Najjar B (2006) A model to diagnose the deviation in the maintenance performance measures. In: Proceedings of the 1st world congress on engineering asset management,WCEAM2006, pp 87-93 | |
| 16. | Rødseth H, Langeland C, Myklebust O (2012) Integrated key performance indicators-a tool for smarter decision making. In: Proceedings of IWAMA 2012-the second international workshop of advanced manufacturing and automation. NTNU Engineering Series, Tapir Akademisk Forlag, pp 259-266 | |
| 17. | IEC (1990) IEC 60050-191: international electrotechnical vocabulary. Chapter 191: dependability and quality of service. International Electrotechnical Commission, Geneva | |
| 18. | Rausand M, Høyland A (2004) System reliability theory: models, statistical methods, and applications. Wiley-Interscience, Hoboken | |
| 19. | Rødseth H, Andersen B (2013) Early warning indicators for integrated planning. Paper presented at the PMAA 2013 Conference, New Zealand | |
| 20. | Al-Najjar B (1996) Total quality maintenance: an approach for continuous reduction in costs of quality products. J Qual Maint Eng 2(3):4-20 | |
| 21. | Juran JM (1951) Quality control handbook, 1st edn. McGraw- Hill, New York | |
| 22. | Nakajima S (1989) TPM development program: implementing total productive maintenance. Productivity Press, Cambridge, Mass | |
| 23. | BLOM (2003) OEE Industry Standard: version 2.0 August 2003. Blom Consultancy, The Nederlands | |
| 24. | Shirose K (1996) TPM total productive maintenance new implementation program. Japan Institute of Plant maintenance, Tokyo | |
| 25. | NS-EN 13306 (2010) Maintenance: maintenance terminology. European Committee for Standardization (CEN), Brussels | |
| 26. | ISO (2005) ISO 9000 qualitative management systems—fundamentals and vocabulary. ISO, London | |
| 27. | Linderman K, Schroeder RG, Zaheer S, Choo AS (2003) Six Sigma: a goal-theoretic perspective. J Oper Manag 21(2):193-203 | |
| 28. | Rolstadås A, Andersen B, Schjølberg P (1999) Produksjons—og driftsteknikk. Tapir, Trondheim | |
| 29. | IEC 60300-3-3 (2004) Dependability management - application guide: life cycle costing. International Electrotechnical Commission, Geneva | |
| 30. | Blanchard BS, Fabrycky WJ (2011) Systems engineering and analysis. Pearson, Boston | |
| 31. | Wilson A (2002) Asset maintenance management: a guide to developing strategy & improving performance. Industrial Press, New York | |
| 32. | Leiwy D, Perks R (2013) Accounting: understanding and practice. McGraw-Hill, Maidenhead | |
| 33. | Myklebust O (2002) Enterprise modelling supported by manufacturing systems theory. Dissertation, Norwegian University of Science and Technology, Trondheim | |
| 34. | Lange J, Iwanitz F, Burke TJ (2010) OPC: from data access to unified architecture. VDE Verlag, Berlin | |