 2015, Vol. 3
The article information
- Børge Sjøbakk, Ottar Bakås, Oksana Bondarenko, Tara Kamran
- Designing a performance measurement system to support materials management in engineer-to-order: a case study
- Advances in Manufacturing, 2015, 3(2): 111-122
- http://dx.doi.org/10.1007/s40436-015-0109-2
-
Article history
- Received: 2015-02-23
- Accepted: 2015-04-22
- Published online: 2015-05-27


2 Department of Production and Quality Engineering, NTNU, Trondheim, Norway
The engineer-to-order (ETO) production situation is receiving increased attention from both researchers and practitioners as customer preferences are shifting from standard, high-volume products to more complex and customized products [1]. In ETO, products are manufactured to meet a specific customer's needs by carrying out unique engineering or significant customization [2]. All activities in the manufacturing value chain, i.e., design/ engineering, procurement and fabrication, final assembly and shipment, are initiated by the customer order [3]. Failing to supply the required materials in right quantities and at the right time may interrupt work further downstream in the manufacturing value chain, which increases the risk of breaching due date agreements and ultimately losing customer satisfaction [1]. Materials management, i.e., management of the flow of materials and information to match supply and demand in the manufacturing value chain [4], is therefore considered to be imperative within production planning and control in ETO [5].
The conventional maxim of "what gets measured gets done" bears testimony of performance measurement being a traditional way of bringing attention to important areas of a company's operations [6]. Due to the importance of materials management in ETO companies, ETO companies could arguably benefit from measuring how well the activity is carried out [1]. The term performance measurement system (PMS) is used for the set of metrics used to quantify the efficiency and effectiveness of such activities [7]. When designing a company's PMS, it is generally agreed that the company's strategic objectives should be taken as a starting point [8]. As these are largely dictated by the company's production situation and vice versa, the design of a company's PMS varies with its production situation. A PMS for ETO should in some way differ from a PMS for make-to-stock (MTS), assemble-to-order (ATO) or make-to-order (MTO) [6]. After being approached by a Norwegian ETO company requesting a PMS to support its materials management, the authors set out to identify what was already written on the topic. A number of performance indicators for materials management were identified. However, none of these explicitly refers to the ETO production situation. As most of the published research has focused on other production situations than ETO [2], such as MTS and construction, the identified indicators need to be assessed against characteristics of ETO in order to assure their applicability.
The purpose of this paper is to suggest a PMS for materials management in ETO. The PMS has been developed on the basis of literature reviews and case study of a Norwegian ETO company, utilizing the action research approach. 2 Research method
In developing the PMS the authors utilized the action research method. In action research the researchers and the problem holder (in this case the Norwegian ETO company) collaborate in solving problem in real life situations while maintaining a research interest [9, 10]. It is different from many other research methods in that the researchers actively take part in the context of their research area. This creates a mutual dependence on the researchers' and the problem holder's skills and competences, which in turn generates new knowledge for both parties [9, 10]. Initially, the researchers carried out semi-structured, focused interviews with a number of department managers in order to understand the company's existing PMS. Subsequently, workshops with core departments in the company generated discussions around the identified performance indicators for materials management. The researchers synthesized the discussions and sent them out to the management and other parts of the company, such as information and communications technology (ICT) support and finance, for feedback. In this way the researchers combined a top-down cascading method with a bottom-up design process, as is recommended in PMS design processes [11].
Like most research methods, action research has met various types of critique over the years. This is especially related to generalizability and reliability of the research results. Due to the researchers' active role in aiding the problem holder, action research is accused of being consultancy rather than research [10]. further, the idiosyncratic context of the researchers and the problem holder is claimed to impede the possibility of safely making causal inferences, and to make the researchers especially exposed for bias [10]. The authors acknowledge that the context of working closely with the problem holder limits the opportunity to generalize and reproduce the research and its results completely. However, the close collaboration was a critical success factor to fully understand the needs of the problem holder. The research interest was also maintained by investigating the requirements for a PMS for materials management in ETO, as this is a topic that has received little attention in the literature. 3 Theoretical background 3.1 ETO production situation
There are many different production situations that can be employed to meet demand. Within operations management and production literature, companies have traditionally been classified as either MTS, ATO, MTO or ETO depending on the position of the customer order decoupling point (CODP) [2, 12]. This is the point in the manufacturing value chain where production goes from being forecast-driven to order-driven [3]. The relationship between the CODP and the different production situations is depicted in Fig. 1, where gray boxes indicate order-driven activities. As is evident from Fig. 1, the CODP is positioned at the upstream-most point of the manufacturing value chain in ETO.

Several authors argue that the taxonomy of MTS, ATO, MTO and ETO is relatively broad and imprecise, which causes a substantial variety of companies to be included in each category [2], and to manufacturing organizations not falling solely within one class [13]. Consequently, numerous other taxonomies have been put forward, some of which are summarized in Table 1. Even more specific categories within the different production situations are developed, for example for non-MTS [2] and ETO [14, 15, 16]. For the purpose of this paper the traditional classification (see Fig. 1) is adopted, with a key takeaway being that in ETO one knows little of what to order or manufacture until after the receipt of a customer order and subsequent engineering [17].

General characteristics of ETO can be described along the dimensions of products, processes, markets, uncertainty, risks and challenges [25] (see Table 2). ETO products are typically complex with deep product structures. On component level, some are required in low volumes whereas others are needed in higher volumes; some are technologically advanced whereas others are simpler; some are customized whereas others are standardized [26]. On product level, there is usually a high degree of customization [27]. This leads to products typically coming in low volumes [27], often as "one-of-a-kind" [13]. Modifications are frequently made to the product specifications after start of production in the form of change orders [28].
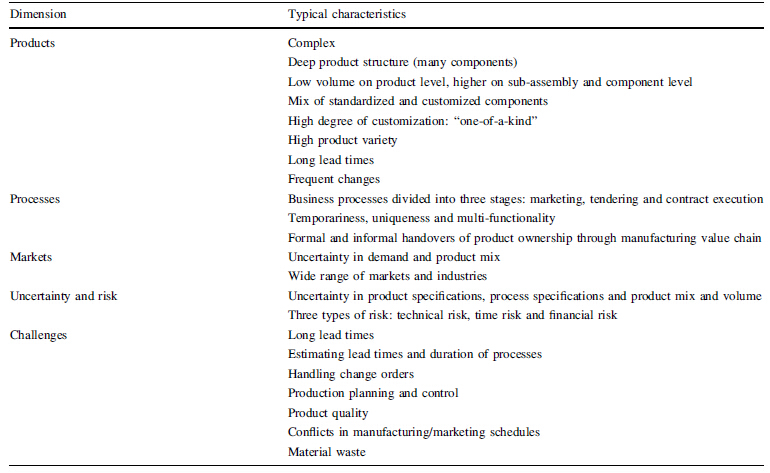
On a higher level the business processes of an ETO company may be divided into marketing, tendering and contract execution [26]. In the marketing stage customer requirements, commercial factors, the organization's ability to compete and the likelihood of success are used to decide whether or not to respond to an invitation to tender. Given a decision to respond to the tender, the organization carries out conceptual design of major components and systems and combine it with commercial terms such as price and delivery conditions into a quotation. The up-coming activities given a won contract are development of a project plan and execution of the manufacturing value chain activities depicted in Fig. 1. In general, the processes of ETO companies can be characterized as non-repetitive, with discontinuity aspects such as temporariness, uniqueness and multi-functionality [29]. With respect to the latter, several researchers point to the reciprocal interdependencies between different functions [26, 30, 31]. In a parallel study, Sjøbakk and Bakås [6] mapped the business processes of the problem holder and showed that there are both formal and informal handovers between different departments as the product proceeds through the manufacturing value chain.
In terms of the market situation ETO companies are prone to high fluctuations in sales volume and product mix [13]. As the end products can be customized to a great extent, companies operate in a wide range of markets and industries, such as construction, high technology/capital goods, automotive, shipbuilding, consumer electronics and general manufacturing [24]. further, most ETO companies supply mature markets, which in many cases have overcapacity. This makes reduced lead times and increased delivery performance important in order to compete [32].
Three main uncertainty factors are recognized in ETO: product specification uncertainty, process specification uncertainty and product mix and volume uncertainty [13, 33]. further, a distinction is made between three types of order-dependent risk in ETO situations [33]. Technical risk refers to the situation where a product cannot be technically produced, leading to more product engineering and detailed design. This may arise from product specification uncertainty in the tendering phase. Time risk is the situation where the throughput time in engineering and manufacturing is longer than what was estimated in the tendering phase. Financial risk is the situation where the costs of engineering and production are higher than estimated in the tendering phase. This risk may arise from technical and/or time risk.
As the access to historical data often is scarce due to the bespoke nature of ETO supply, data related to lead times and processes are largely based upon estimates and forecasting. The dynamic nature of supply may lead to large variances between these estimates and the actual process times, which makes production planning and control difficult [32]. This challenge is reinforced by the change orders that often occur in ETO. In fact, the capability to cope with these change orders is a prerequisite for success in many engineering organizations [34]. It should be noted that change orders are not exclusively a disadvantage. They may result in additional income, cost savings or performance improvements [35], often as a result of engineering changes proposed by the company itself [36]. Other identified challenges generally associated with highly customized production are poor product quality, conflicts between different functions' schedules and priorities and material waste [37]. 3.2 Performance management and measurement
The area of performance management encompasses the iterative processes of measuring and improving performance [38]. It is mainly concerned with figuring out what to measure, how to measure it and subsequently how to react to what is measured [39]. The metrics used to quantify the efficiency and effectiveness of the actions taken against a given norm or target are usually coined performance indicators or measures [40]. A PMS is a set of such indicators that collectively measures the company's performance within predefined areas [7]. Designing a PMS largely consists of defining appropriate performance indicators, as well as establishing routines for measurement and processing of the indicators' results [11].
Until the 1980s and 1990s, such systems were directed mainly towards financial performance [41]. Since then companies have become aware of other non-financial factors contributing to firm performance, adopting more integrated approaches to manage performance. A famous example is the balanced scorecard approach by Kaplan and Norton [42], which augments traditional financial measures with performance measures relating to the company's relationship with its customers, its key internal processes and its learning and growth. The balanced scorecard and other existing frameworks and models, such as SCOR [43] and ENAPS [44], are typically designed to be applicable for all production situations, having predefined sets of measures from which appropriate indicators can be selected to suit the needs of a specific company.
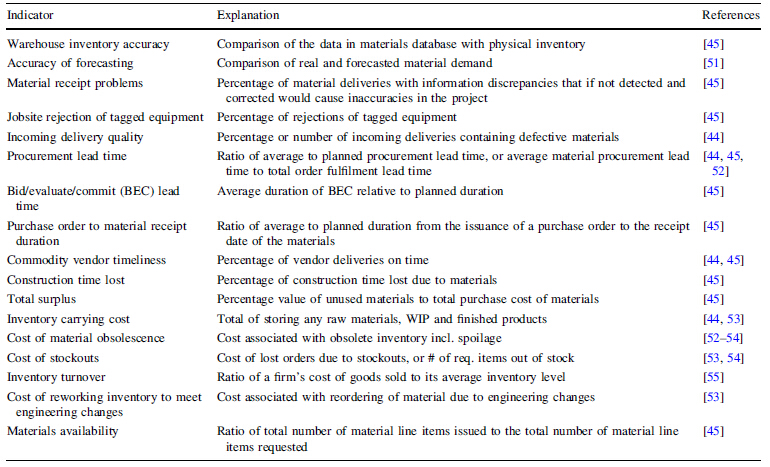
Besides previous work by the authors [1, 6], no literature explicitly referring to PMS for ETO has been identified. However, quite a bit of literature on performance measurement in construction, which shares the same discontinuity aspects as ETO processes, exists [45, 46, 47, 48, 49, 50]. For example, Plemmons and Bell [45] present a list of 35 measures for measuring the effectiveness of the materials management process and use a survey of construction industry professionals to narrow the list down to 10 key measures. Considering these and other performance measures relating to materials management, Sjøbakk et al. [1] present a preliminary list of 17 indicators for measuring materials management performance (see Table 3) and assess them with respect to characteristics of ETO (see Fig. 2). Their applicability in the production situation is assessed for a number of reasons. Construction performance measures are often found to be lagging measures used for marketing purposes rather than tools for improvement [46]. further, ETO companies are able to utilize production systems managed according to established manufacturing policies, unlike the often "ad hoc" construction projects [29]. As such, there would arguably be elements of repetition in ETO that could be measured using a more complete PMS consisting of both leading and lagging indicators [6]. Finally, as stated previously most of the operations management research has treated companies as MTS companies. These often have other competitive priorities than ETO companies, which would be reflected in their PMS.
 |
| Fig. 2 Generic PMS for materials management in ETO [1] |
Sjøbakk et al. [1] characterized five of the indicators as generally applicable for ETO. As material shortages in the upstream in the manufacturing value chain may ultimately lead to failure in delivering the order, any information discrepancies in incoming materials should be detected and corrected using the material receipt problems indicator. Physical discrepancies should also be detected and measured using the incoming delivery quality indicator, as any replacement of defective deliveries can delay the end product due to long lead times in ETO. further, the efficiency of the procurement function may significantly contribute to the total order lead time. This can be measured using the procurement lead time indicator, which measures either the average to the planned material lead time, or the average material procurement lead time in relation to the total order fulfilment lead time. By measuring the average to the planned duration from the issuance of a purchase order until the receipt of the materials, suppliers' efficiency can be measured using the purchase order to material receipt duration indicator. Finally, the time lost due to material unavailability can be measured using the production time lost indicator.
As pointed out in the previous subsection, ETO products consist of both standardized and customized products. Five indicators are regarded applicable mainly for the standardized components of an ETO product [1]. Such components are often purchased in larger batches and put in inventory, as their demand patterns are relatively predictable and the components are cheaper than customized ones. Warehouse inventory accuracy can be used to compare the data in materials database with physical inventory. The cost of holding this inventory should be measured with the inventory carrying cost indicator, and the inventory turnover can be used to investigate whether some components should be considered procured for every project instead of in anticipation of future demand. The relatively predictable demand of standardized components can be used to forecast future demand. The accuracy of forecasting should be measured in order to improve these forecasts. Whether the company manages to deliver products to the agreed due date is not only influenced by its suppliers' delivery time duration, as discussed above, but also the timeliness of the deliveries. Especially for standardized components the commodity vendor timeliness indicator can be used to follow up suppliers on a more regular basis. A perception of the timeliness will increas the quality of delivery date estimates. Two indicators are regarded applicable for ETO companies to carry out certain activities. For companies involved in acquisition of components through tendering the bid/evaluate/commit lead time indicator can be used to measure the efficiency of the activity. This concerns mainly customized components, as more permanent supplier relationships are usually put in place for standardized components in order to reduce transaction costs. Finally, the jobsite rejection of tagged equipment indicator is developed for the construction industry as it needs to plan for equipment for each project. For extreme forms of ETO, e.g., offshore rigs and jackets, heavy equipment such as cranes needs to be coordinated. Hence, some ETO companies may benefit from measuring how often the equipment is available at the right time and place. Five of the 17 indicators are regarded inapplicable for ETO [1].
In any instance a PMS should be tailored to each individual company based on the company's needs. In this respect, a lot of general methods for designing a PMS exist [7, 8, 11]. Typically, such methods involve an understanding and mapping of business structures and processes, the company's business performance priorities and its current PMS. In the next section these aspects are treated in the description of the case company. further design steps include development or selection of suitable performance indicators, establishment of routines for data collection and reporting, and testing, adjusting and implementation of the PMS. These aspects are highlighted in the subsequent sections, where the proposed PMS is described. 4 Case company
The problem holder is a Norwegian ETO company that specializes in design, manufacturing, technological development, installation and support of high-tech solutions for environmental monitoring. The company offers a range of products and services. However, the research has focused on the production of ocean monitoring platforms as this constitutes a significant part of the company's operations. These platforms contain sensors for measuring various environmental parameters, such as meteorological data and water quality. The platforms are categorized in four main types based on different sizes and shapes of the floaters. Some components are common for all platforms, such as data loggers, the floater (though different for each platform type) and electronics. Due to the relatively predictable demand of these components, the company is able to keep an inventory of standardized components. In addition, the platforms can be customized to a large extent. For every platform that is sold, the company engineers an anchorage system based on the seabed conditions in the platform's area of operations. The production of a platform, including procurement of customized components, is triggered by a customer order. The order is often a result of tendering as the company has a high share of public customers. The company refined its strategic business goals during the research, as it wanted something that was easier to communicate both internally and externally. Five business goals were proposed: safe and stimulating workplace, efficient delivery, high quality products and services, preferred partner and sustainable production.
The business processes of the problem holder can be illustrated with a "customer journey" [6], as depicted in Fig. 3. This links the order-driven ETO business processes, the business functions responsible for each process and inherent handover activities in a neat way. At the case company the market department is responsible for generating orders, often by participating in tendering processes. When the company is awarded a contract, the project department is responsible for the development of a project plan. Thereafter, the project department formally hands the project over to the technical department, which is responsible for engineering (including software development), procurement and production, testing and calibration of the platforms in the order. Subsequently the order is handed back to the project department, which is responsible for delivery of the order. This includes site acceptance tests and service during the platforms' operating phase. In some cases, the project department is also responsible for end-oflife treatment of the platform(s). The market department carries out any after-sales supplementary to the initial order.
 |
| Fig. 3 "Customer journey" showcasing responsibilities and handovers [6] |
A mapping of the company's current PMS revealed that it largely measured performance within sales, project management and quality control. It had little indicators of materials management performance besides that coming from delivery acceptance inspections and factory acceptance tests. The follow-up of these tests was more ad hoc than regular. The company therefore wanted to emphasize materials management in the enhancement of its PMS. In Sect. 5, a PMS for materials management in the company is proposed. 5 PMS for materials management in ETO
In order for the PMS to be consistent and integrated, a number of principles were applied. First of all, the PMS was linked to the strategic objectives of the problem holder. further, the performance indicators were connected to the business processes of the company. This was done in order to establish ownership interest in the PMS and secure necessary follow-up. In addition, key performance indicators (KPIs), i.e., a set of critical indicators that quickly gives an impression of the overall performance [56], were defined. These principles are illustrated in Fig. 4.
As is evident from Fig. 4, the PMS was connected to the strategic objective of "efficient delivery". The company also initiated processes of determining systems for measuring performance along the other objectives [6]. With respect to the materials management PMS the indicators proposed by Sjøbakk et al. [1] (see Fig. 2) were discussed with the project and technical department, as these were regarded most relevant for the responsibility of the PMS. The "applicable" indicators were readily accepted by the company. Within the "partly applicable" indicators the departments recognized the division between fully and partly applicable indicators, as they are able to keep inventory of some standard components, such as electronics, whereas customized parts such as anchorage systems need to be purchased on demand. However, the bid/evaluate/commit lead time indicator was not regarded necessary as the company mainly uses one regular supplier of components for the anchorage system and has more or less standard agreements with suppliers of standardized components. further, the company did not experience any challenges related to shared resources. As such, the jobsite rejection of tagged equipment indicator was also omitted. The commodity vendor timeliness indicator was renamed to incoming delivery precision, as this was a term that was already familiar to the company.
 |
| Fig. 4 Relationship between strategic objectives and the PMS for materials management [6] |
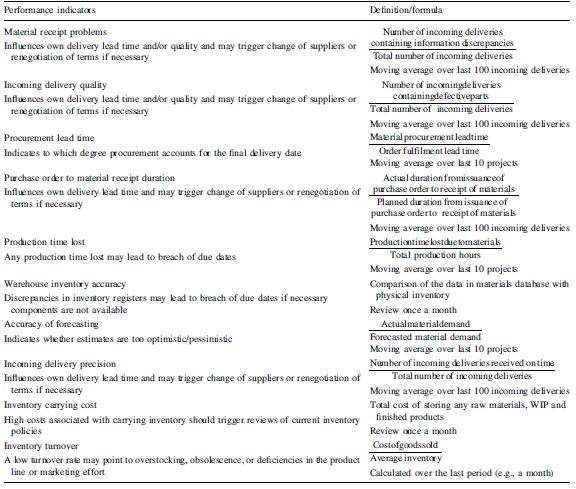
The explanation of each indicator (see Table 3) was discussed with the company, and in some instances replaced with formulas for calculating them. For example, it was defined that the procurement lead time should be measured as the ratio of the average material procurement lead time to the order fulfilment lead time, with a moving average over the last 10 finished projects. The company's IT department was included in this process due to their insight in the company's data retrieving capabilities. The motivation for each indicator was also discussed and written down in order to make the PMS easier to implement. For example, the procurement lead time indicator indicates to which degree procurement accounts for the final delivery date. The proposed PMS for materials management is illustrated in Table 4. With respect to KPIs the company defined one KPI for each of the strategic business objectives. For efficient delivery a compound index was chosen. This contained incoming delivery precision, in addition to other indicators relating to spare parts, documentation, production lead times and outgoing delivery precision.
further, the company needed to decide on how to collect and present the data. In collaboration with the problem holder, the researchers came up with a set of guidelines used as a basis for the generation of performance measures and reports: (i) the registration of performance should be automatic to the extent possible; (ii) the reports should present correct and updated information in a perspicuous manner; (iii) it should be able to make reports that gather data from multiple IT systems (e.g. ERP system and other relevant databases); (iv) standard reports should be generated automatically - some should be reported continuously and be readily available for the staff, whereas other should be reported at intervals up in the organizational hierarchy; (v) it should be possible to query the system for tailored reports; and (vi) the reports should be available through a common user interface. These main principles are illustrated in Fig. 5.
 |
| Fig. 5 Principles for performance registration and reporting |
The problem holder is currently working with defining performance goals for the different indicators. Subsequent steps include testing, adjusting and implementing the suggested PMS. During this process it is likely that the PMS will be further adapted by the company. As such, it should be considered a starting point rather than a package deal. In the next section, the paper is concluded. This includes limitations, managerial implications and suggestions for further research. 6 Conclusions
Performance management and measurement is often put into practice by companies seeking to bring attention and improvement to important areas of their operations. As materials management is recognized as one of the most important and critical processes within production planning and control in the ETO production situation, it is argued that ETO companies can benefit from measuring how well this activity is carried out. This paper proposes a PMS consisting of ten performance indicators for materials management in ETO. The PMS has been developed in close collaboration with a Norwegian ETO company. In developing the PMS, identified literature on performance management and measurement, characteristics of ETO and previous work by the authors were taken as a starting point. Any PMS should be aligned with the strategic priorities of the company adopting it. The proposed PMS can therefore be taken as a starting point by managers seeking to assess and improve their materials management performance. The specific indicators' formulation as well as routines for data collection and dissemination would have to be developed for each individual company, given its requirements and measurement abilities. The research has brought forth a set of guidelines for performance registration and reporting that can be utilized in that context.
Initial feedback from the case company supports the usefulness of the proposed PMS. However, as it has not yet been fully implemented at the company, any numerical data to quantitatively assess its effects have not yet been made available. As the findings are based on a single case study, further research should include empirical testing of the PMS' applicability within a range of different ETO companies. This could lead to refined definitions of the different indicators, suggestions for performance goals as well as indicators being added or removed to the indicator list. The researchers acknowledge that working closely with the problem holder limits the generalizability of the research and its results. Nonetheless, the case should be inspiring for others struggling to design their own PMS. The topic of designing a performance management system for ETO companies is an area with much potential for further research, having received little attention in academic literature.
Acknowledgments This work has been conducted within the context of the projects MARGIN (Integrated and Responsive Maritime Supply Chain) funded by the Regional Research fund Mid-Norway, EFFEKT (Effective Production of Advanced Maritime Equipment), the SFI Norman (Norwegian Manufacturing future) programme supported by the Research Council of Norway and the project Linked Design (Linked Knowledge in Manufacturing, Engineering and Design) with funding from the European Union's Seventh Framework Programme ([FP7/2''7-2013]) (Grant No. 284613). The authors would like to thank the participants of the projects for providing funding and valuable discussions.| 1. | Sjøbakk B, Bondarenko O, Kamran T (2014) A performance measurement system to support materials management in engineer- to-order companies. Adv Mater Res 1039:569-576 |
| 2. | Amaro G, Hendry L, Kingsman B (1999) Competitive advantage, customisation and a new taxonomy for non make-to-stock companies. Int J Oper Prod Manag 19(4):349-371 |
| 3. | Olhager J (2003) Strategic positioning of the order penetration point. Int J Prod Econ 85:319-329 |
| 4. | Beckman SL, Rosenfield DB (2008) Operations strategy, competing in the 21st century. McGraw-Hill, New York |
| 5. | Persona A, Regattieri A, Romano P (2004) An integrated reference model for production planning and control in SMEs. J Manuf Technol Manag 15(7):626-640 |
| 6. | Sjøbakk B, Bakås O (2014) Designing an engineer-to-order performance measurement system: a case study. In: Advances in production management systems innovative and knowledgebased production management in a global-local world. Springer, Ajaccio, pp 473-480 |
| 7. | Neely A, Gregory M, Platts K (1995) Performance measurement system design: a literature review and research agenda. Int J Oper Prod Manag 15(4):80-116 |
| 8. | Bourne M, Mills J, Wilcox M et al (2000) Designing, implementing and updating performance measurement systems. Int J Oper Prod Manag 20(7):754-771 |
| 9. | Greenwood DJ, Levin M (2007) Introduction to action research: social research for social change. Sage, Thousand Oaks |
| 10. | McKay J, Marshall P (2001) The dual imperatives of action research. Inform Technol People 14(1):46-59 |
| 11. | Andersen B, Fagerhaug T (2002) Performance measurement explained: designing and implementing your state-of-the-art system. ASQ Quality Press, Wisconsin |
| 12. | Wortmann J (1992) Production management systems for one-ofa- kind products. Comput Ind 19(1):79-88 |
| 13. | Porter K, Little D, Peck M et al (1999) Manufacturing classifications: relationships with production control systems. Integr Manuf Syst 10(4):189-199 |
| 14. | Hicks C, Mcgovern T, Earl CF (2001) A typology of UK engineer- to-order companies. Int J Logist 4(1):43-56 |
| 15. | Wacker JG, Miller M (2000) Configure-to-order planning bills of material: simplifying a complex product structure for manufacturing planning and control. Prod Invent Manag J 41(2):21-26 |
| 16. | Wikner J, Rudberg M (2005) Integrating production and engineering perspectives on the customer order decoupling point. Int J Oper Prod Manag 25(7):623-641 |
| 17. | Bertrand J, Muntslag D (1993) Production control in engineer-toorder firms. Int J Prod Econ 30:3-22 |
| 18. | Hill T (1993) Manufacturing strategy: the strategic management of the manufacturing function. Macmillan, London |
| 19. | Stavrulaki E, Davis M (2010) Aligning products with supply chain processes and strategy. Int J Logist Manag 21(1):127-151 |
| 20. | Holweg M, Pil FK (2001) Start with the customer. MIT Sloan Manag Rev 43(1):74-83 |
| 21. | Krajewski L, Wei JC, Tang LL (2005) Responding to schedule changes in build-to-order supply chains. JOperManag 23(5):452-469 |
| 22. | Fredriksson P, Gadde LE (2005) Flexibility and rigidity in customization and build-to-order production. Ind Mark Manag34(7):695-705 |
| 23. | Gunasekaran A, Ngai EWT (2005) Build-to-order supply chain management: a literature review and framework for development. J Oper Manag 23(5):423-451 |
| 24. | Gosling J, Naim MM (2009) Engineer-to-order supply chain management: a literature review and research agenda. Int J Prod Econ 122(2):741-754 |
| 25. | Sjøbakk B, Thomassen MK, Alfnes E (2014) Implications of automation in engineer-to-order production: a case study. Adv Manuf 2(2):1-9 |
| 26. | Hicks C, McGovern T, Earl C (2000) Supply chain management: a strategic issue in engineer to order manufacturing. Int J Prod Econ 65(2):179-190 |
| 27. | McGovern T, Hicks C, Earl CF (1999) Modelling supply chain management processes in engineer-to-order companies. Int J Logist 2(2):147-159 |
| 28. | Riley DR, Diller BE, Kerr D (2005) Effects of delivery systems on change order size and frequency in mechanical construction. J Constr Eng Manag 131(9):953-962 |
| 29. | Caron F, Fiore A (1995) ‘Engineer to order' companies: how to integrate manufacturing and innovative processes. Int J Proj Manag 13(5):313-319 |
| 30. | Konijnendijk PA (1994) Coordinating marketing and manufacturing in ETO companies. Int J Prod Econ 37(1):19-26 |
| 31. | Kingsman B, Worden L, Hendry L et al (1993) Integrating marketing and production planning in make-to-order companies. Int J Prod Econ 30:53-66 |
| 32. | Hicks C, Braiden P (2000) Computer-aided production management issues in the engineer-to-order production of complex capital goods explored using a simulation approach. Int J Prod Res 38(18):4783-4810 |
| 33. | Muntslag DR (1994) Profit and risk evaluation in customer driven engineering and manufacturing. Int J Prod Econ 36(1):97-107 |
| 34. | Little D, Rollins R, Peck M et al (2000) Integrated planning and scheduling in the engineer-to-order sector. Int J Comput Integr Manuf 13(6):545-554 |
| 35. | Terwiesch C, Loch CH (1999) Managing the process of engineering change orders: the case of the climate control system in automobile development. J Prod Innov Manag 16(2):160-172 |
| 36. | Danese P, Romano P (2004) Improving inter-functional coordination to face high product variety and frequent modifications. Int J Oper Prod Manag 24(9-10):863-885 |
| 37. | Pandit A, Zhu Y (2007) An ontology-based approach to support decision-making for the design of ETO (Engineer-to-Order) products. Autom Constr 16(6):759-770 |
| 38. | Parthiban P, Goh M (2011) An integrated model for performance management of manufacturing units. Benchmarking Int J18(2):261-281 |
| 39. | de Leeuw S, van den Berg JP (2011) Improving operational performance by influencing shopfloor behavior via performance management practices. J Oper Manag 29(3):224-235 |
| 40. | Fortuin L (1988) Performance indicators: why, where and how? Eur J Oper Res 34(1):1-9 |
| 41. | Behn RD (2003) Why measure performance? Different purposes require different measures. Public Adm Rev 63(5):586-606 |
| 42. | Kaplan RS, Norton DP (1996) Using the balanced scorecard as a strategic management system. Harv Bus Rev 74(1):75-85 |
| 43. | Stephens S (2001) The supply chain council and the supply chain operations reference model. Supply Chain Manag 1:9-13 |
| 44. | Browne J, Devlin J, Rolstadas A et al (1997) Performance measurement: the ENAPS approach. Int J Bus Transform 1:73-84 |
| 45. | Plemmons JK, Bell LC (1995) Measuring effectiveness of materials management process. J Manag Eng 11(6):26-32 |