 2023, Vol. 44
文章信息
- 杨姗姗, 王盛书, 李蓉蓉, 陈仕敏, 李皓炜, 李雪航, 宋扬, 王建华, 赵亚力, 李靖, 朱乔, 甯超学, 台朋岗, 刘广东, 刘淼, 何耀.
- Yang Shanshan, Wang Shengshu, Li Rongrong, Chen Shimin, Li Haowei, Li Xuehang, Song Yang, Wang Jianhua, Zhao Yali, Li Jing, Zhu Qiao, Ning Chaoxue, Tai Penggang, Liu Guangdong, Liu Miao, He Yao
- 海南百岁老人12项肥胖相关指标与全因死亡的关联研究
- Association between 12 obesity related indicators and all-cause death in Hainan centenarians
- 中华流行病学杂志, 2023, 44(1): 106-114
- Chinese Journal of Epidemiology, 2023, 44(1): 106-114
- http://dx.doi.org/10.3760/cma.j.cn112338-20220413-00290
-
文章历史
收稿日期: 2022-04-13


2. 解放军总医院第二医学中心老年医学研究所, 衰老及相关疾病研究北京市重点实验室, 国家老年疾病临床医学研究中心, 北京 100853;
3. 中央军委机关事务管理总局服务局保健室, 北京 100082;
4. 解放军医学院, 北京 100853;
5. 武警新疆总队特战支队卫生队, 阿克苏 843000;
6. 解放军总医院海南医院中心实验室, 三亚 572013;
7. 解放军总医院第五医学中心卫勤部, 北京 100853;
8. 解放军总医院卫勤部, 北京 100853;
9. 解放军总医院第六医学中心卫勤部, 北京 100853;
10. 解放军总医院研究生院统计学与流行病学教研室, 北京 100853;
11. 肾脏疾病国家重点实验室, 北京 100853
2. Institute of Geriatrics, Beijing Key Laboratory of Aging and Geriatrics, National Clinical Research Center for Geriatrics Diseases, Second Medical Center, Chinese People's Liberation Army General Hospital, Beijing 100853, China;
3. Department of Healthcare, Agency for Offices Administration, Central Military Commission, People's Republic of China, Beijing 100082, China;
4. Chinese People's Liberation Army Medical School, Beijing 100853, China;
5. Health Corps, Special Combat Detachment of Xinjiang Armed Police Crops, Aksu 843000, China;
6. Central Laboratory, Hainan Hospital, Chinese People's Liberation Army General Hospital, Sanya 572013, China;
7. Health Service Department, Fifth Medical Center, Chinese People's Liberation Army General Hospital, Beijing 100853, China;
8. Health Service Department, Chinese People's Liberation Army General Hospital, Beijing 100853, China;
9. Health Service Department, Sixth Medical Center, Chinese People's Liberation Army General Hospital, Beijing 100853, China;
10. Department of Statistics and Epidemiology, Graduate School, Chinese People's Liberation Army General Hospital, Beijing 100853, China;
11. State Key Laboratory of Kidney Diseases, Beijing 100853, China
目前我国正处于老年化的快速发展阶段,老龄人口多、人口老龄化严重。第七次全国人口普查显示,截至2020年11月1日,我国≥60岁人口已超2.6亿,占18.70%,其中≥65岁人口超1.9亿,占13.50%[1]。高龄老人的健康和死亡风险研究愈发重要。
健康监测是发现高危人群并告知其可改变的高危因素,减少主要慢性病疾病负担的重要手段[2]。肥胖一直是世界范围内老年人群重要慢性病和死亡的共同重要危险因素[3]。身体测量被认为是人口筛查和早期检测的简单、廉价、非侵入性常用指标[4]。肥胖由于是多种慢性疾病的重要可改变基础病变和危险因素,其测量越发受到研究者的关注[5]。近年来,在传统肥胖身体测量指标如BMI、腰围、腰臀比、小腿围等的基础上,部分研究者为达到更全面真实反映脂肪含量和分布、更准确预测疾病的目的,传统测量指标互相结合或进一步结合血脂检测指标计算得到新兴的肥胖相关测量指标,以期更准确地描述受试者的脂肪含量差异,更准确地预测相关疾病。比如脂质蓄积指数(LAP)(2005年由Kahn[6]基于美国第三次全国健康与营养调查人群构建,结合了腰围和TG,再分别按性别转化成连续变量,在美国人群中证实较BMI更能反映内脏肥胖情况,同时2010年在中国江苏省多代谢异常和代谢综合征防治队列研究人群中研究发现LAP较腰臀比、腰围和BMI与糖尿病的关联更强[7])、内脏脂肪指数(VAI)(Amato等[8]于2010年基于性别特异性数学指数模型综合了BMI、TG和HDL-C提出了VAI,2013年在中国人群中的研究表明VAI可作为内脏脂肪的反映指标,其高评分与心血管疾病的高风险存在关联[9])、中国内脏脂肪指数(CVAI)(在VAI的基础上,Xia等[10]2016年利用回归模型构建了CVAI,该指标引入了年龄,并经过CT校正,通过横断面研究证实了其与国人的内脏肥胖和胰岛素抵抗相关)、身体形态指数(ABSI)(Krakauer和Krakauer[11]于2012年基于美国人群构建的一个新的肥胖相关身体测量指标,该公式是将腰围做了BMI和身高的标准化,数值越高说明个体越符合内脏肥胖的体型,2013年He和Chen[12]发现ABSI可以独立预测中国人群中新发的糖尿病,但其预测能力与腰围和BMI近似)、中国身体形态指数(CABSI)(基于人群异质性,在ABSI的计算基础上,汪宏莉等[13]2020年基于中国人群建立了分性别的CABSI,并证实其值与高血压风险存在关联)、腰围小腿围比值(WCR)(Kim等[14]在2011年构建的中心性肥胖的测量指标,其最初用于老年人群心脑血管事件的预测。2020年在中国高龄老人中证实该指标可综合反映人群的中心性肥胖程度,并与高龄老人的日常活动能力[15]、认知水平[16]和心理状态[17]等均存在关联)和身体圆度指数(BRI)(Thomas等[18]于2013年构建的,其将人体形状拟合成椭圆形,利用偏心率理论推导出身体形状几何模型构建得出,该指标纳入了身高和腰围计算,数值越大说明内脏脂肪堆积越明显,2016年,Tian等[19]基于2009年中国健康与营养调查数据研究发现,BRI较ABSI、腰围和BMI对心脏代谢异常的预测能力更优)。而新兴肥胖测量指标的研究,多是集中在中青年人群,缺乏老年人群中的基础数据。同时,相较于中青年人群,老年人群的肥胖有其独有的特征[20],故对其进行相关指标测量的基础数据收集有重要的现实意义。
对于身体测量指标与老年人群死亡风险关联的研究目前也愈发受到研究者们的关注,既往研究显示,BMI与全因死亡存在剂量反应关系[21],然而,BMI的疾病可预测性受限于它不区分脂肪与肌肉,也不考虑脂肪组织的分布[22]。最近的研究评估了以中心性肥胖为重点的替代身体测量方法在预测慢性病方面的相对有效性[23-24]。但对于死亡结果预测能力的比较研究较少,结果也不一致[25-28]。缺乏百岁老人人群的研究数据。
本研究拟依托中国海南百岁老人队列研究(China Hainan Centenarian Cohort Study,CHCCS),采用规范队列研究设计,比较分析肥胖相关身体测量指标与百岁老人全因死亡的关联。
对象与方法1. 研究对象:CHCCS是基于海南省社区人群的全样本前瞻性百岁老人队列研究[29],调查范围覆盖海南省,基线调查人群包括整个海南省18个县级单位中≥100岁老人。基线调查时间为2014年6月至2016年8月。随访时间为2020年1月至2021年5月。
基线调查采取入户调查的方法采集百岁老人的基本资料,包括问卷访谈、体格检查和实验室血液样本检测,问卷访谈、身体指标(身高、体重、腰围、臀围、小腿围、血压)的测量均由经过系统培训的海南省本地护士(可说当地话,交流无障碍)完成。该研究已通过解放军总医院海南医院伦理委员会审查(审批号:301hn11201601),调查对象均签署知情同意书。
2. 随访和结局:随访时间的M(Q1,Q3)为4.16(1.31,5.04)年,随访结局为全因死亡,由电话调查百岁老人本人及其家属,核查派出所户籍数据以及核对中国CDC死因登记信息管理系统共3种方式共同随访死亡结局和死因,以保证随访结果的准确性。
3. 肥胖相关身体测量指标:包括BMI、腰围、腰臀比、腰高比、小腿围、WCR、LAP、VAI、CVAI、ABSI、CABSI、BRI。测量方法参照《人体测量方法》中的相关标准规定进行[30],采用人体测高仪测量身高、体重计测量体重,专用于身体测量的纤维卷尺进行维度测量,测量时要求被访者脱去鞋、帽、外套,掏出随身物品如钥匙、手机等。身高测量时精确至0.5 cm,体重则要求连续2次的结果误差 < 0.5 kg,取其平均值记录。腰围、小腿围测量时均使用非弹性卷尺紧贴皮肤测量同时避免卷尺陷入皮肤,连续测量2次取平均值,精确到0.1 cm,受试者取站立位,腰围取肚脐上缘1 cm处的水平面取其周长,小腿围取小腿最粗平面以获得最大周长,两腿均进行测量,每条腿的测量值为2次测量的平均值,这些值合并计算两腿的平均值[31]。血脂指标包括TG、TC、HDL-C、LDL-C,均由统一培训的护士采集百岁老人空腹血后送至解放军总医院海南医院中心实验室,由中心实验室采用标准试剂和方法统一检测。
指标计算公式:BMI=体重(kg)/身高(m)2;腰臀比=腰围/臀围;腰高比=腰围/身高[32];男性LAP=(腰围-65)×TG,女性LAP=(腰围-58)×TG[6];男性VAI=[腰围/(39.68+1.88×BMI)]×(TG/1.03)×(1.31/HDL-C),女性VAI=[腰围/(36.58+1.89×BMI)]×(TG/0.81)×(1.52/HDL-C)[8];男性CVAI=-267.93+0.68×年龄+0.03×BMI+4.00×腰围+22.0×logTG-16.32×HDL-C,女性CVAI=-187.32+1.71×年龄+4.23×BMI+1.12×腰围+39.76×logTG-11.66×HDL-C[10];ABSI=腰围/(BMI2/3×身高1/2)[11];男性CABSI=腰围/(BMI×身高0.455),女性CABSI=腰围/(BMI0.734×身高0.408)[13];BRI=364.2-365.5
4. 统计学分析:研究数据采用EpiData 3.1软件双录入核查,数据分析均通过SPSS 26.0软件包完成。定量数据符合正态分布的采用x±s描述,不符合正态分布的采用M(Q1,Q3)描述,差异比较根据分布分别采用独立样本t检验或秩和检验。分类数据采用构成比描述。采用Cox比例风险回归模型进行各肥胖相关身体测量指标与全因死亡的关联分析(连续变量或分组变量)。各肥胖相关身体测量指标对全因死亡的判定能力的大小采用受试者工作特征曲线(ROC)曲线下面积(AUC)大小进行比较。双侧检验,以P < 0.05为差异有统计学意义。
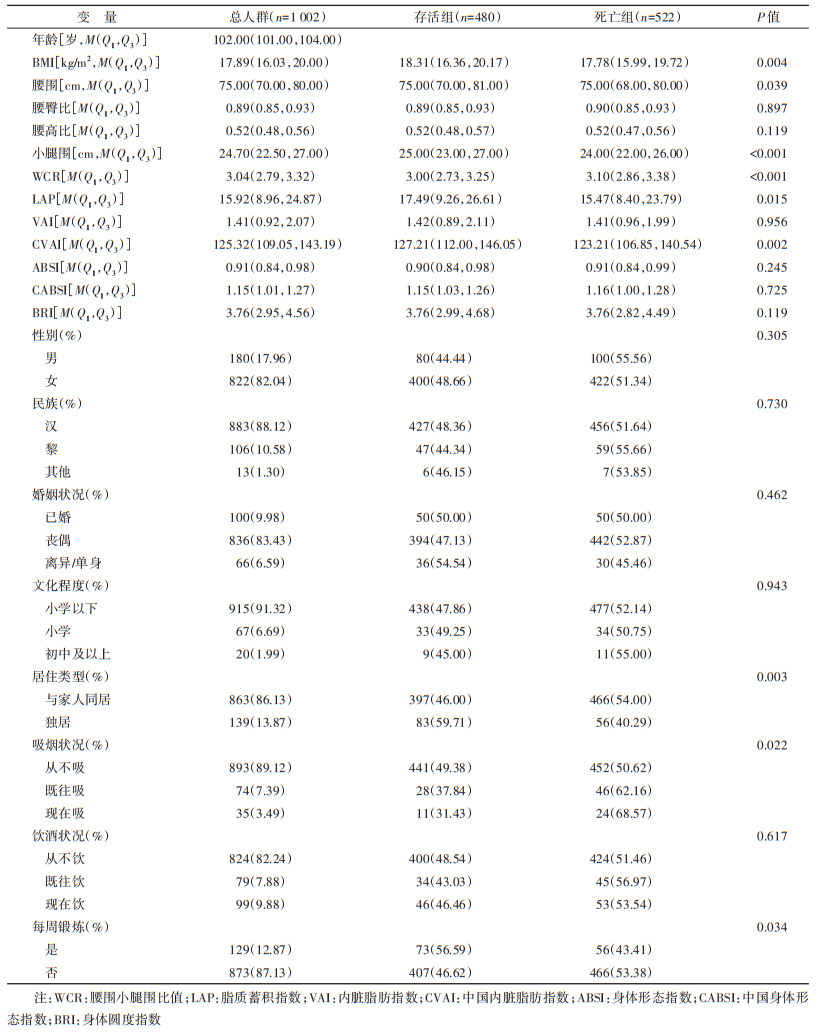
结果1. 基本情况:共纳入百岁老人1 002人(男性180人,女性822人),随访死亡人数522人,占52.09%,其中男性100人(100/180,55.56%),女性422人(422/822,51.34%),不同性别间死亡率差异无统计学意义(P=0.305)。随访时间M(Q1,Q3)为4.16(1.31,5.04)年,全因死亡密度为152.39/1 000人年。BMI的M(Q1,Q3)为17.89(16.03,20.00)kg/m2,腰围为75.00(70.00,80.00)cm,腰臀比为0.89(0.85,0.93),腰高比为0.52(0.48,0.56),小腿围为24.70(22.50,27.00)cm,WCR为3.04(2.79,3.32),LAP为15.92(8.96,24.87),VAI为1.41(0.92,2.07),CVAI为125.32(109.05,143.19),ABSI为0.91(0.84,0.98),CABSI为1.15(1.01,1.27),BRI为3.76(2.95,4.56)。BMI、小腿围、LAP和CVAI死亡组较存活组低,WCR死亡组较存活组高,差异有统计学意义(均P < 0.05)。见表 1。
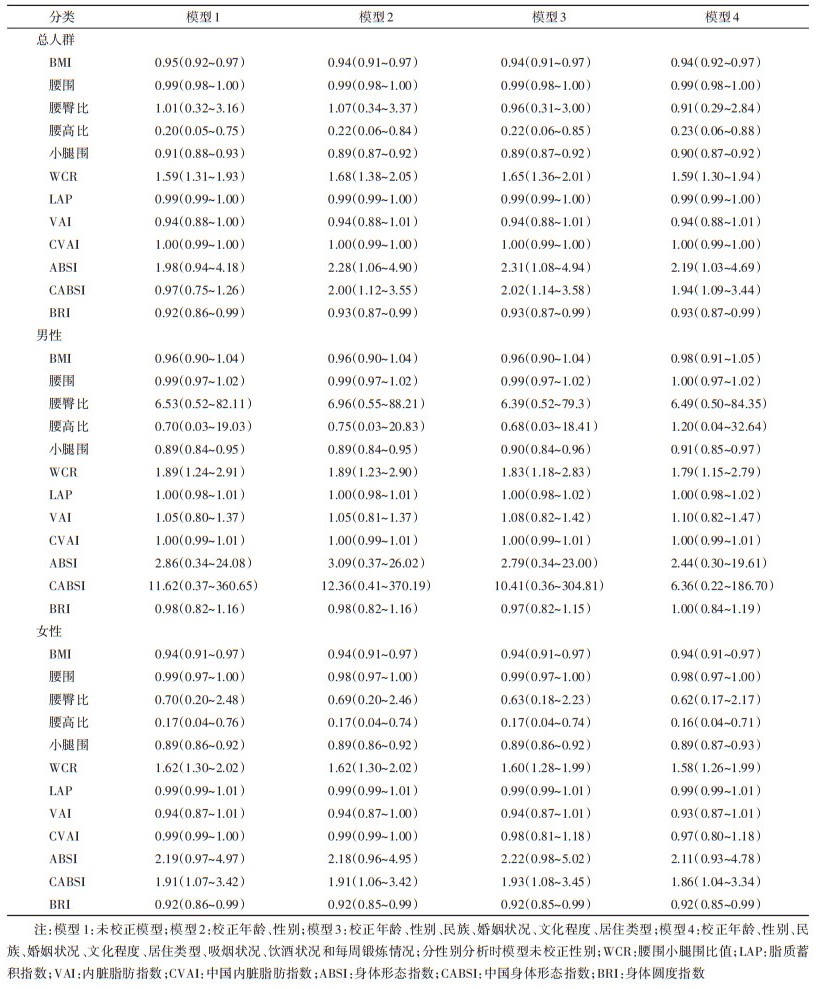
2. 肥胖相关身体测量指标对全因死亡的影响:以是否死亡作为结局指标,BMI、腰围、腰臀比、腰高比、小腿围、WCR、LAP、VAI、CVAI、ABSI、CABSI和BRI分别按照连续变量分别作为自变量纳入方程进行Cox比例风险回归分析。结果显示,校正了人口学特征(性别、年龄、民族、婚姻状况、文化程度和居住类型)以及生活方式(吸烟状况、饮酒状况和每周锻炼情况)相关变量后,随BMI、腰高比、小腿围、BRI增加,死亡风险减低,校正HR值分别为0.94(95%CI:0.92~0.97)、0.23(95%CI:0.06~0.88)、0.90(95%CI:0.87~0.92)和0.93(95%CI:0.87~0.99);而随WCR、ABSI和CABSI的增加,死亡风险增加,HR值分别为1.59(95%CI:1.30~1.94)、2.19(95%CI:1.03~4.69)和1.94(95%CI:1.09~3.44)。男性百岁老人中,校正后,随小腿围增加,死亡风险降低(HR=0.91,95%CI:0.85~0.97);随WCR增加死亡风险增加(HR=1.79,95%CI:1.15~2.79);女性百岁老人中,校正后,随BMI、腰高比、小腿围、BRI数值增加,死亡风险降低,随WCR和CABSI数值增加,死亡风险增加(均P < 0.05)。见表 2。
3. 肥胖相关身体测量指标对全因死亡的判定能力比较:分别将BMI、腰围、腰臀比、腰高比、小腿围、WCR、LAP、VAI、CVAI、ABSI、CABSI和BRI作为自变量纳入ROC,以全因死亡为因变量计算AUC。总人群中小腿围对全因死亡的判定能力最强,AUC为0.61(95%CI:0.57~0.64);分性别结果与总人群一致(P < 0.05)。WCR次之(AUC为0.58),在总人群和不同性别百岁老人中均有统计学意义(均P < 0.05),再次是BMI、LAP和腰围,AUC分别为0.55、0.55和0.54,而CABSI、腰臀比和VAI的判定能力较弱,AUC分别为0.51、0.50和0.50。见表 3。

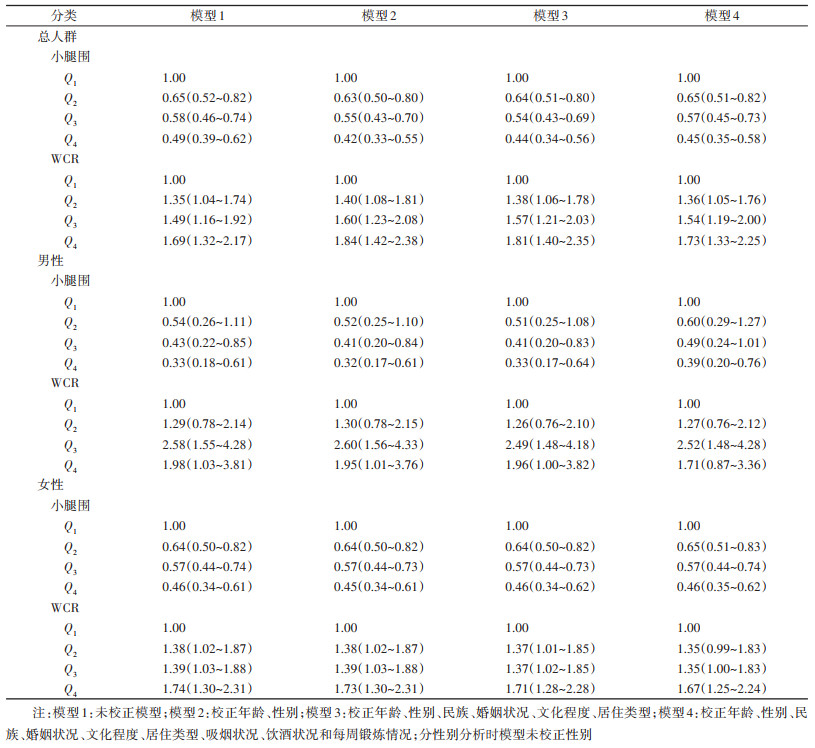
4. 肥胖相关身体测量指标对全因死亡判定能力的分组分析:选取对死亡风险判定力最高的小腿围和WCR,按照四分位数分组,将分组变量作为自变量分别引入方程进行Cox比例风险回归分析,结果显示:校正了年龄、性别、民族、婚姻状况、文化程度、居住类型、饮酒状况、吸烟状况和每周锻炼情况后,总人群中,小腿围最高值组较最低值组死亡的风险降低了55%(HR=0.45,95%CI:0.35~0.58),而WCR最高值组较最低值组死亡的风险增加了73%(HR=1.73,95%CI:1.33~2.25)。小腿围和WCR四分位数分组与死亡风险间关联存在剂量反应关系(均P < 0.001)。分性别结果与总人群结果一致。男性百岁老人中,小腿围最高值组较最低值组死亡的风险降低了61%(HR=0.39,95%CI:0.20~0.76)。女性百岁老人中,小腿围最高值组较最低值组死亡的风险降低了54%(HR=0.46,95%CI:0.35~0.62),而WCR最高值组较最低值组死亡的风险增加了67%(HR=1.67,95%CI:1.25~2.24)。见表 4。
本研究采用规范的队列研究设计,纳入目前已知最大样本的百岁老人人群,分析了肥胖相关身体测量指标与百岁老人全因死亡之间的关联,结果发现,小腿围对百岁老人的死亡判定能力最强,随小腿围增加,百岁老人死亡风险降低,关联具有剂量反应关系。同时其他身体测量指标中,随WCR增加,百岁老人死亡风险增加,关联也具有剂量反应关系。结果说明,百岁老人中,肌肉的保存相较于脂肪的分布对于百岁老人全因死亡风险的降低更具实际意义。
既往曾有研究显示,相对于BMI和腰围,新兴身体测量指标ABSI对全因死亡的预测力较高[33],但在本研究中未观测到,这可能与纳入人群的年龄不同有关。一项基于40~75岁5万余人的Golestan队列研究显示,相较于第一五分位数人群,最后五分位数的全因死亡风险人群的HRs值(95%CI),BMI为1.12(1.02~1.22),腰围为1.16(1.07~1.27),腰高比为1.28(1.17~1.40),腰臀比为1.44(1.32~1.58)[34]。而在百岁老人人群中未观察到此类关联,这可能与幸存者偏倚有关。
有关小腿围对死亡的预测性研究,既往曾有一项基于144名慢性阻塞性肺疾病(COPD)患者的研究显示,小腿围较低人群的死亡风险较本研究高(OR=3.69,95%CI:1.06~12.87)[35],这可能与纳入人群为患者人群而非社区人群有关。同样是基于COPD患者的研究显示,小腿围较BMI对死亡的预测力更强,与本研究结果一致,但纳入样本量较小(n=104),且基于的是特殊疾病患者,外推性受限[36]。一项基于巴西社区老年人的研究也证实了小腿围对于死亡的独立预测力[37]。
小腿围是活动减少的敏感指标,尤其是对于老年人和处于疾病状态的个人[38]。同时小腿围也是反映老年人肌肉保持水平和营养状况的指标,而在老年人中营养不良很普遍[39],小腿围可能通过反映的营养状况从而影响老年个体的全因死亡。同时,本课题组的既往研究也显示,小腿围对于百岁老人的功能性健康状况(涵盖了日常活动能力[15]、认知功能[16]、心理状态[17]和生活质量[40])均存在关联,可通过影响百岁老人的功能性健康状况而进一步影响该人群的全因死亡。
本研究存在局限性。第一,研究人群为海岛环境下的大样本百岁老人,结论外推需谨慎;第二,男性百岁老人数量较少,可能影响关联分析的统计学把握度和检验效能;第三,由于老年人群的自然老化影响,身高测量可能存在误差,进而影响BMI准确度;第四,本研究可能存在幸存者偏倚,结果解读时应谨慎。
本研究在中国前瞻性比较了12项肥胖相关指标与百岁老人全因死亡间的关联,并发现小腿围的预测判定能力最好,且呈剂量反应关系,提示可作为长寿老人死亡风险预测的参考指标。
利益冲突 所有作者声明无利益冲突
作者贡献声明 杨姗姗、王盛书、刘淼:现场调查、研究设计、数据库清理、数据分析、论文撰写/修改;李蓉蓉、陈仕敏、李皓炜、李雪航、王建华、赵亚力、李靖、朱乔、甯超学、台朋岗、刘广东:数据整理、现场调查、实验室检测、统计学方法探讨;何耀:研究指导、论文修改、经费支持
| [1] |
国家统计局. 第七次全国人口普查公报(第五号)[EB/OL]. (2021-05-11) [2022-03-19]. http://www.stats.gov.cn/tjsj/tjgb/rkpcgb/qgrkpcgb/202106/t20210628_1818824.html. National Bureau of Statistics. Bulletin of the seventh national census (No. 5)[EB/OL]. (2021-05-11)[2022-03-19]. http://www.stats.gov.cn/tjsj/tjgb/rkpcgb/qgrkpcgb/202106/t20210628_1818824.html. |
| [2] |
Bauer UE, Briss PA, Goodman RA, et al. Prevention of chronic disease in the 21 st century: elimination of the leading preventable causes of premature death and disability in the USA[J]. Lancet, 2014, 384(9937): 45-52. DOI:10.1016/S0140-6736(14)60648-6 |
| [3] |
Bastien M, Poirier P, Lemieux I, et al. Overview of epidemiology and contribution of obesity to cardiovascular disease[J]. Prog Cardiovasc Dis, 2014, 56(4): 369-381. DOI:10.1016/j.pcad.2013.10.016 |
| [4] |
WHO. Physical status: the use and interpretation of anthropometry, report of a WHO expert committee[EB/OL]. (1995-02-28). https://www.who.int/publications/i/item/9241208546.
|
| [5] |
Laskey RA, McCarroll ML, Von Gruenigen VE. Obesity-related endometrial cancer: an update on survivorship approaches to reducing cardiovascular death[J]. BJOG, 2016, 123(2): 293-298. DOI:10.1111/1471-0528.13684 |
| [6] |
Kahn HS. The "lipid accumulation product" performs better than the body mass index for recognizing cardiovascular risk: a population-based comparison[J]. BMC Cardiovasc Disord, 2005, 5: 26. DOI:10.1186/1471-2261-5-26 |
| [7] |
杨晨, 郭志荣, 胡晓抒, 等. 脂质蓄积指数和体重指数与糖尿病关系比较的前瞻性研究[J]. 中华流行病学杂志, 2010, 31(1): 5-8. Yang C, Guo ZR, Hu XS, et al. A prospective study on the association between lipid accumulation product or body mass index and diabetes[J]. Chin J Epidemiol, 2010, 31(1): 5-8. DOI:10.3760/cma.j.issn.0254-6450.2010.01.002 |
| [8] |
Amato MC, Giordano C, Galia M, et al. Visceral adiposity index: a reliable indicator of visceral fat function associated with cardiometabolic risk[J]. Diabetes Care, 2010, 33(4): 920-922. DOI:10.2337/dc09-1825 |
| [9] |
Zhang XL, Shu XO, Li HL, et al. Visceral adiposity and risk of coronary heart disease in relatively lean Chinese adults[J]. Int J Cardiol, 2013, 168(3): 2141-2145. DOI:10.1016/j.ijcard.2013.01.275 |
| [10] |
Xia MF, Chen Y, Lin HD, et al. A indicator of visceral adipose dysfunction to evaluate metabolic health in adult Chinese[J]. Sci Rep, 2016, 6(1): 38214. DOI:10.1038/srep38214 |
| [11] |
Krakauer NY, Krakauer JC. A new body shape index predicts mortality hazard independently of body mass index[J]. PLoS One, 2012, 7(7): e39504. DOI:10.1371/journal.pone.0039504 |
| [12] |
He S, Chen XP. Could the new body shape index predict the new onset of diabetes mellitus in the Chinese population?[J]. PLoS One, 2013, 8(1): e50573. DOI:10.1371/journal.pone.0050573 |
| [13] |
汪宏莉, 韩延柏, 陈涛, 等. 中国成人身体形态指数构建及其与血压水平关系[J]. 中国公共卫生, 2020, 36(4): 588-591. Wang HL, Han YB, Chen T, et al. A body shape index constructed and its association with blood pressure among Chinese adults[J]. Chin J Public Health, 2020, 36(4): 588-591. DOI:10.11847/zgggws1126358 |
| [14] |
Kim SK, Choi YJ, Huh BW, et al. Ratio of Waist-to-Calf circumference and carotid atherosclerosis in Korean patients with Type 2 diabetes[J]. Diabetes Care, 2011, 34(9): 2067-2071. DOI:10.2337/dc11-0743 |
| [15] |
Yang SS, Wang SS, Tai PG, et al. Central and peripheral adiposity had different effect on disability in centenarians[J]. Front Endocrinol, 2021, 12: 635205. DOI:10.3389/fendo.2021.635205 |
| [16] |
Tai PG, Yang SS, Liu W, et al. Association of anthropometric and nutrition status indicators with cognitive functions in centenarians[J]. Clin Nutr, 2021, 40(4): 2252-2258. DOI:10.1016/j.clnu.2020.10.004 |
| [17] |
杨姗姗, 王盛书, 贾王平, 等. 海南百岁老人中肥胖相关指标与抑郁症状风险的关联研究[J]. 中华流行病学杂志, 2021, 42(1): 113-120. Yang SS, Wang SS, Jia WP, et al. Relationship between obesity related anthropometric indicators and depression risk in Hainan centenarians[J]. Chin J Epidemiol, 2021, 42(1): 113-120. DOI:10.3760/cma.j.cn112338-20200425-00644 |
| [18] |
Thomas DM, Bredlau C, Bosy-Westphal A, et al. Relationships between body roundness with body fat and visceral adipose tissue emerging from a new geometrical model[J]. Obesity, 2013, 21(11): 2264-2271. DOI:10.1002/oby.20408 |
| [19] |
Tian SM, Zhang XZ, Xu Y, et al. Feasibility of body roundness index for identifying a clustering of cardiometabolic abnormalities compared to BMI, waist circumference and other anthropometric indices: the China Health and Nutrition Survey, 2008 to 2009[J]. Medicine (Baltimore), 2016, 95(34): e4642. DOI:10.1097/MD.0000000000004642 |
| [20] |
陈敏, 范青, 朱晓雯, 等. 老年少肌性肥胖的患病率及其肌力和肌功能的调查[J]. 老年医学与保健, 2020, 26(1): 12-15. Chen M, Fan Q, Zhu XW, et al. Survey of sarcopenic obesity morbidity, muscle strength and function in the elderly[J]. Geriatr Health Care, 2020, 26(1): 12-15. DOI:10.3969/j.issn.1008-8296.2020.01.004 |
| [21] |
Aune D, Sen A, Norat T, et al. Body mass index, abdominal fatness, and heart failure incidence and mortality: a systematic review and dose-response meta-analysis of prospective studies[J]. Circulation, 2016, 133(7): 639-649. DOI:10.1161/CIRCULATIONAHA.115.016801 |
| [22] |
Phillips CM, Tierney AC, Perez-Martinez P, et al. Obesity and body fat classification in the metabolic syndrome: impact on cardiometabolic risk metabotype[J]. Obesity (Silver Spring), 2013, 21(1): E154-161. DOI:10.1002/oby.20263 |
| [23] |
Ashwell M, Gunn P, Gibson S. Waist-to-height ratio is a better screening tool than waist circumference and BMI for adult cardiometabolic risk factors: systematic review and meta-analysis[J]. Obes Rev, 2012, 13(3): 275-286. DOI:10.1111/j.1467-789X.2011.00952.x |
| [24] |
Qiao Q, Nyamdorj R. Is the association of type Ⅱ diabetes with waist circumference or waist-to-hip ratio stronger than that with body mass index?[J]. Eur J Clin Nutr, 2010, 64(1): 30-34. DOI:10.1038/ejcn.2009.93 |
| [25] |
Song X, Jousilahti P, Stehouwer CD, et al. Cardiovascular and all-cause mortality in relation to various anthropometric measures of obesity in Europeans[J]. Nutr Metabo Cardiovasc Dis, 2015, 25(3): 295-304. DOI:10.1016/j.numecd.2014.09.004 |
| [26] |
Afsar B, Elsurer R, Kirkpantur A. Body shape index and mortality in hemodialysis patients[J]. Nutrition, 2013, 29(10): 1214-1218. DOI:10.1016/j.nut.2013.03.012 |
| [27] |
Song X, Jousilahti P, Stehouwer CD, et al. Comparison of various surrogate obesity indicators as predictors of cardiovascular mortality in four European populations[J]. Eur J Clin Nutr, 2013, 67(12): 1298-1302. DOI:10.1038/ejcn.2013.203 |
| [28] |
He S, Zheng Y, Wang H, et al. Assessing the relationship between a body shape index and mortality in a group of middle-aged men[J]. Clin Nutr, 2016, 36(5): 1355-1359. DOI:10.1016/j.clnu.2016.09.003 |
| [29] |
李立明. 长寿老人流行病学研究的科学意义与展望[J]. 中华流行病学杂志, 2023, 44(1): 81-84. Li LM. Epidemiological research of the long-lived elderly and promotion of construction of a healthy aging society[J]. Chin J Epidemiol, 2023, 44(1): 81-84. DOI:10.3760/cma.j.cn112338-20220919-00789 |
| [30] |
席焕久, 陈昭. 人体测量方法[M]. 2版. 北京: 科学出版社, 2010. Xi HJ, Chen Z. Anthropometric methods[M]. 2nd ed. Beijing: Science Press, 2010. |
| [31] |
Kawakami R, Murakami H, Sanada K, et al. Calf circumference as a surrogate marker of muscle mass for diagnosing sarcopenia in Japanese men and women[J]. Geriatr Gerontol Int, 2015, 15(8): 969-976. DOI:10.1111/ggi.12377 |
| [32] |
Batsis JA, Singh S, Lopez-Jimenez F. Anthropometric measurements and survival in older americans: results from the third national health and nutrition examination survey[J]. J Nutr Health Aging, 2014, 18(2): 123-130. DOI:10.1007/s12603-013-0366-3 |
| [33] |
Ji M, Zhang S, An R. Effectiveness of A Body Shape Index (ABSI) in predicting chronic diseases and mortality: a systematic review and meta-analysis[J]. Obes Rev, 2018, 19(5): 737-759. DOI:10.1111/obr.12666 |
| [34] |
Nalini M, Sharafkhah M, Poustchi H, et al. Comparing anthropometric indicators of visceral and general adiposity as determinants of overall and cardiovascular mortality[J]. Arch Iran Med, 2019, 22(6): 301-309. |
| [35] |
Bernardes S, Silva FM, Da Costa CC, et al. Reduced calf circumference is an independent predictor of worse quality of life, severity of disease, frequent exacerbation, and death in patients with chronic obstructive pulmonary disease admitted to a pulmonary rehabilitation program: A historic cohort study[J]. J Parenter Enter Nutr, 2022, 46(3): 546-555. DOI:10.1002/jpen.2214 |
| [36] |
Ho SC, Wang JY, Kuo HP, et al. Mid-arm and calf circumferences are stronger mortality predictors than body mass index for patients with chronic obstructive pulmonary disease[J]. Int J Chron Obstruct Pulmon Dis, 2016, 11: 2075-2080. DOI:10.2147/COPD.S107326 |
| [37] |
Fernandes DPDS, Juvanhol LL, Lozano M, et al. Calf circumference is an independent predictor of mortality in older adults: An approach with generalized additive models[J]. Nutr Clin Pract, 2022, 37(5). DOI:10.1002/ncp.10780 |
| [38] |
Chumlea WC. Is the MNA valid in different populations and across practice settings?[J]. J Nutr Health Aging, 2005, 10(6): 524-527. |
| [39] |
Liu GD, Yang SS, Liu W, et al. Canonical correlation analysis on the association between sleep quality and nutritional status among centenarians in Hainan[J]. Front Public Health, 2020, 8: 585207. DOI:10.3389/fpubh.2020.585207 |
| [40] |
王盛书, 李雪航, 杨姗姗, 等. 海南百岁老人主要健康指标及其与生存质量的关联研究[J]. 中华流行病学杂志, 2023, 44(1): 85-91. Wang SS, Li XH, Yang SS, et al. Association between main health characteristics and quality of life in Hainan centenarians[J]. Chin J Epidemiol, 2023, 44(1): x-x. DOI:10.3760/cma.j.cn112338-20220413-00289 |