 2022, Vol. 43
文章信息
- 王雅婷, 朋文佳, 苏华林, 王伟炳.
- Wang Yating, Peng Wenjia, Su Hualin, Wang Weibing
- 2011-2018年中国手足口病发病的时空特征及影响因素研究
- Spatiotemporal characteristics of hand, foot and mouth disease and influencing factors in China from 2011 to 2018
- 中华流行病学杂志, 2022, 43(10): 1562-1567
- Chinese Journal of Epidemiology, 2022, 43(10): 1562-1567
- http://dx.doi.org/10.3760/cma.j.cn112338-20220416-00307
-
文章历史
收稿日期: 2022-04-16


2. 上海市闵行区疾病预防控制中心, 上海 201101
2. Minhang District Center for Disease Control and Prevention, Shanghai 201101, China
手足口病是由多种肠道病毒引起的传染病,主要发生于 < 5岁儿童,1周左右自愈,少数重症病例发展较快,可导致死亡[1]。手足口病主要通过空气和密切接触传播[2-3]。以往在手足口病方面的研究主要应用传统研究模型,如空间自相关分析[4-5]和时空扫描统计量[6-7]。然而空间自相关不能检测时间趋势,时空扫描统计量虽然能进行时空趋势分析,但不能包含协变量进行分析,且不适合不规则区域的风险分析,贝叶斯时空模型可以在研究影响因素的同时加入时空效应,控制了时空混杂导致的不确定性,使得影响因素的分析更加准确[8]。已有研究从时空角度发现社会、经济、人口和卫生服务等因素可能与手足口病的发病率有关,四川省一项研究表明,人均国内生产总值是手足口病发病的一个风险因素[9],但研究区域主要集中广东省[8]、四川省[9]和北京市[10],少有全国区域的相关研究[11]。本研究应用贝叶斯时空模型分析2011-2018年我国手足口病发病的时空特征及影响因素,为手足口病科学防控提供参考依据。
资料与方法1. 资料来源: 全国手足口病监测数据来源于公共卫生科学数据中心(https://www.phsciencedata.cn/Share/index.jsp),包括2011-2018年我国分地区和分年龄段手足口病发病数、死亡数、报告发病率和死亡率数据。社会、经济、人口和卫生服务等数据来源于中国统计年鉴(http://www.stats.gov.cn/tjsj/ndsj/)。
2. 研究区域: 我国31个省(自治区、直辖市)。使用省级区划作为时空分析的最小地理单位。根据地理分区将全国划分为7个区域类型,分别为东北地区(黑龙江省、吉林省和辽宁省)、西北地区(陕西省、甘肃省、青海省、宁夏回族自治区和新疆维吾尔自治区)、华北地区(北京市、天津市、山西省、河北省和内蒙古自治区)、华东地区(上海市、江苏省、浙江省、安徽省、福建省、江西省和山东省)、华中地区(河南省、湖北省和湖南省)、华南地区(广东省、广西壮族自治区和海南省)和西南地区(重庆市、四川省、贵州省、云南省和西藏自治区)。
3. 研究方法:
(1) 描述统计: 使用Excel 2016软件进行数据整理,使用ArcGIS 10.7软件进行可视化分析、全局空间自相关分析和热点分析,以省(自治区、直辖市)为尺度。
(2) 贝叶斯时空模型:
通过专业知识和文献初步总结出可能的影响因素作为备选变量并进行归一化处理,根据多重共线性分析剔除方差膨胀系数(VIF) > 10的变量,再根据逐步回归的方法保留有统计学意义的变量。将最终变量纳入贝叶斯时空模型进行分析。
使用R 4.1.0软件中的嵌套拉普拉斯近似算法(Integrated Nested Lapulace Approximation,INLA)拟合贝叶斯时空模型,对可能的影响因素进行分析得到参数后验估计的均值和95%CI。将省级区域单位表示为i(i=1,2,…,31),时间表示为t(t=1,2,…,8),假定第i区第t年的手足口病发病数服从Poisson分布。时空Poisson模型的似然函数[12]为Yit~ Poisson(Eitλit)。其中,Eit为i区域在t时间的期望值。λit为目标估计变量,即标准化发病率[13]。在Poisson分布假设下,应用的时空模型分解为可能的影响因素协变量、空间和时间的分量,公式: ηit=
空间分量包括条件自回归(conditional autoregressive,CAR)先验[16]和独立高斯可交换先验,分别表示空间自相关[17]和空间异质性。时间分量包括结构化时间效应[18]和非结构化时间效应,分别表示时间相关性和时间异质性。
RR被广泛用于衡量暴露于可能危险因素的疾病风险[19]。风险指标直接采用RR=eβ计算,分别计算出结构时空随机效应的局部RRi=eμi和RRt=eγt。双侧检验,检验水准α=0.05。
结果1. 手足口病流行概况: 2011-2018年,我国共报告手足口病例17 118 050例,死亡2 283例,全国年均报告发病率为147.822/10万,报告死亡率为0.026/10万,病死率为0.018%,< 5岁年龄组占比为89.489%。2011-2014年报告发病率呈波动上升趋势,2014-2018年报告发病率呈波动下降趋势(图 1);报告死亡率一直呈波动下降趋势(表 1)。手足口病报告发病率按高低排序分别为华南地区、华东地区、华中地区和西北地区(图 2)。总体上,手足口病的高发地区呈现从华北地区向东南沿海地区聚集的趋势。

|
| 图 1 2011-2018年全国手足口病病例数和报告发病率时间趋势 |


|
| 注: 审图号: GS(2020)4637 图 2 2011-2018年全国手足口病报告发病率分布 |
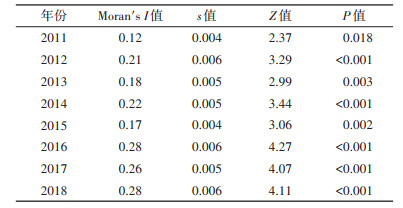
2. 手足口病空间自相关分析和热点分析: 2011-2018年我国手足口病全局空间自相关分析结果显示,全局Moran's I值均 > 0,呈正相关,且均有统计学意义(P < 0.05),表明手足口病的发病具有空间聚集性,高发地区与高发地区相邻,低发地区与低发地区相邻(表 2)。对我国手足口病报告发病率进行热点分析,热点区域主要分布在华南地区且范围有逐渐扩大的趋势,广东省、广西壮族自治区和海南省为常年热点区域,华东、华中和西南的部分地区为热点区域,包括湖南省、江西省、福建省和贵州省;冷点区域主要分布在东北、华北和西北地区(图 3)。

|
| 注: 审图号: GS(2020)4637 图 3 2011-2018年全国手足口病报告发病率热点-冷点空间效应分布 |
3. 手足口病发病的影响因素: 采用贝叶斯时空模型分析结果显示,随着人均地区生产总值(RR=3.54)、每万人规模以上工业企业单位数(RR=1.61)、城市化率(RR=3.00)、人口出生率(RR=2.36)、每万人医疗机构床位数(RR=3.40)的增加,手足口病的发病风险增加;随着人均公园绿地面积(RR=0.57)的增加,手足口病的发病风险降低(表 3)。

2011-2018年我国东南沿海地区手足口病的发病风险较高,是我国手足口病防控的重点区域。就2018年而言,手足口病发病风险 > 1.00的地区主要在华南、华东、华中等地区,有浙江省(RR=2.57)、上海市(RR=1.91)、广西壮族自治区(RR=1.86)、海南省(RR=1.82)、重庆市(RR=1.55)、广东省(RR=1.52)、江苏省(RR=1.46)、福建省(RR=1.33)、北京市(RR=1.28)、湖南省(RR=1.28)、云南省(RR=1.20)、陕西省(RR=1.11)、安徽省(RR=1.04)、湖北省(RR=1.03),其余17个省份发病风险均 < 1.00(图 4)。

|
| 注: 审图号: GS(2020)4637 图 4 2011-2018年时空相互作用分量的后验均值RR图 |
我国手足口病发病分布不均,呈现时空聚集性,与先前大量的研究结果一致[4, 20-21]。通过手足口病报告发病率的省级地图绘制、热点分析和时空风险分析发现手足口病的高发地区、热点区域和高风险区域主要为华南和华东地区,呈现向东南沿海地区聚集的趋势。这可能是由于与中西部地区相比,华南和华东等地区气候相对潮湿,有利于病毒传播,且人口密度较高,增加了手足口病的感染风险[11]。
本研究进一步论证了手足口病的发病与人均地区生产总值等社会和经济因素正相关[22-23]。四川省和广东省的相关研究发现,城市道路与手足口病的发病有关[9, 24],但本研究发现的人均城市道路面积与手足口病发病的影响并不显著。另外,本研究还发现,每万人医疗机构床位数是手足口病发病的危险因素,这可能是因为医疗水平与社会和经济发展及城市化进程有关,或者该指标无法反应从事手足口病防治相关工作人员的数量,具体原因有待进一步研究。
本研究发现,人均公园绿地面积(RR=0.57)为手足口病发病的保护因素,在城市化进程加快的今天,手足口病发病的危险因素在逐渐增加,社会将面临着传染病负担加重的风险,因此,增加人均公园绿地面积可能对手足口病的科学防控具有重要意义。另外,高风险区域为东南沿海地区,能够为手足口病的精准防控、优化公共卫生资源配置提供科学依据。
本研究存在局限性。一是手足口病可能存在未报告病例,可能受个体疾病严重程度和地区医疗资源水平差距的影响[25],尚无法获得漏报的具体信息[10];二是未考虑气象因素、空气污染等可能影响手足口病的环境变量[26-27]。未来需研究更多环境变量,为手足口病风险评估提供更多证据。
综上所述,2011-2018年我国手足口病防控重点区域为东南沿海地区,在加快城市化进程的同时需考虑增加人均公园绿地面积,以降低手足口病的发病率。
利益冲突 所有作者声明无利益冲突
作者贡献声明 王雅婷: 数据收集、整理分析、论文撰写与修改;朋文佳: 论文修改建议;苏华林: 经费支持;王伟炳: 论文审阅
| [1] |
Koh WM, Bogich T, Siegel K, et al. The epidemiology of hand, foot and mouth disease in Asia: a systematic review and analysis[J]. Pediatr Infect Dis J, 2016, 35(10): e285-300. DOI:10.1097/INF.0000000000001242 |
| [2] |
Liu SL, Pan H, Liu P, et al. Comparative epidemiology and virology of fatal and nonfatal cases of hand, foot and mouth disease in mainland China from 2008 to 2014[J]. Rev Med Virol, 2015, 25(2): 115-128. DOI:10.1002/rmv.1827 |
| [3] |
Xing WJ, Liao QH, Viboud C, et al. Hand, foot, and mouth disease in China, 2008-12: an epidemiological study[J]. Lancet Infect Dis, 2014, 14(4): 308-318. DIO: 10.1016/S1473-3099(13)70342-6.
|
| [4] |
Peng D, Ma Y, Liu YQ, et al. Epidemiological and aetiological characteristics of hand, foot, and mouth disease in Sichuan Province, China, 2011-2017[J]. Sci Rep, 2020, 10(1): 6117. DOI:10.1038/s41598-020-63274-3 |
| [5] |
Kou ZQ, Jia J, Liu XH, et al. Epidemiological characteristics and spatial-temporal clusters of hand, foot, and mouth disease in Qingdao City, China, 2013-2018[J]. PLoS One, 2020, 15(6): e0233914. DOI:10.1371/journal.pone.0233914 |
| [6] |
Qian HK, Huo D, Wang XL, et al. Detecting spatial-temporal cluster of hand foot and mouth disease in Beijing, China, 2009-2014[J]. BMC Infect Dis, 2016, 16: 206. DOI:10.1186/s12879-016-1547-6 |
| [7] |
Liu YX, Wang XJ, Liu YX, et al. Detecting spatial-temporal clusters of HFMD from 2007 to 2011 in Shandong Province, China[J]. PLoS One, 2013, 8(5): e63447. DOI:10.1371/journal.pone.0063447 |
| [8] |
Wang YJ, Lai YS, Du ZC, et al. Spatiotemporal distribution of hand, foot, and mouth disease in Guangdong province, China and potential predictors, 2009-2012[J]. Int J Environ Res Public Health, 2019, 16(7): 1191. DOI:10.3390/ijerph16071191 |
| [9] |
Liao JQ, Qin ZJ, Zuo ZL, et al. Spatial-temporal mapping of hand foot and mouth disease and the long-term effects associated with climate and socio-economic variables in Sichuan Province, China from 2009 to 2013[J]. Sci Total Environ, 2016, 563-564: 152-159. DOI:10.1016/j.scitotenv.2016.03.159 |
| [10] |
Xu CD, Zhang XX, Wang L, et al. Effects of temperature fluctuations on spatial-temporal transmission of hand, foot, and mouth disease[J]. Sci Rep, 2020, 10(1): 2541. DOI:10.1038/s41598-020-59265-z |
| [11] |
Song C, He YQ, Bo YC, et al. Risk assessment and mapping of hand, foot, and mouth disease at the county level in mainland China using spatiotemporal zero-inflated Bayesian hierarchical models[J]. Int J Environ Res Public Health, 2018, 15(7): 1476. DOI:10.3390/ijerph15071476 |
| [12] |
Knorr-Held L, Raßer G. Bayesian detection of clusters and discontinuities in disease maps[J]. Biometrics, 2000, 56(1): 13-21. DOI:10.1111/j.0006-341x.2000.00013.x |
| [13] |
Musio M, Sauleau EA, Buemi A. Bayesian semi-parametric zip models with space–time interactions: an application to cancer registry data[J]. Math Med Biol, 2010, 27(2): 181-194. DOI:10.1093/imammb/dqp025 |
| [14] |
Blangiardo M, Cameletti M, Baio G, et al. Spatial and spatio-temporal models with R-INLA[J]. Spat Spatiotemporal Epidemiol, 2013, 4: 33-49. DOI:10.1016/j.sste.2012.12.001 |
| [15] |
Schrödle B, Held L. Spatio-temporal disease mapping using INLA[J]. Environmetrics, 2011, 22(6): 725-734. DOI:10.1002/env.1065 |
| [16] |
Besag J. Spatial interaction and the statistical analysis of lattice systems[J]. J Roy Stat Soc Ser B Methodol, 1974, 36(2): 192-225. DOI:10.1111/j.2517-6161.1974.tb00999.x |
| [17] |
Lichstein JW, Simons TR, Shriner SA, et al. Spatial autocorrelation and autoregressive models in ecology[J]. Ecol Monogr, 2002, 72(3): 445-463. DOI:10.1890/0012-9615(2002)072[0445:SAAAMI]2.0.CO;2 |
| [18] |
Rue H, Held L. Gaussian Markov random fields: theory and applications[M]. Boca Raton: CRC, 2005: 95. DOI: 10.1007/s00184-007-0162-3.
|
| [19] |
Zhang J, Kai F. What's the relative risk? A method of correcting the odds ratio in cohort studies of common outcomes[J]. JAMA, 1998, 280(19): 1690-1691. DOI:10.1001/jama.280.19.1690 |
| [20] |
Xie YH, Chongsuvivatwong V, Tang ZZ, et al. Spatio-temporal clustering of hand, foot, and mouth disease at the county level in Guangxi, China[J]. PLoS One, 2014, 9(2): e88065. DOI:10.1371/journal.pone.0088065 |
| [21] |
Zhang SY, Zhao JX. Spatio-temporal epidemiology of hand, foot and mouth disease in Liaocheng City, North China[J]. Exp Ther Med, 2015, 9(3): 811-816. DOI:10.3892/etm.2015.2207 |
| [22] |
Li LF, Qiu WY, Xu CD, et al. A spatiotemporal mixed model to assess the influence of environmental and socioeconomic factors on the incidence of hand, foot and mouth disease[J]. BMC Public Health, 2018, 18(1): 274. DOI:10.1186/s12889-018-5169-3 |
| [23] |
Huang RF, Wei JT, Li ZW, et al. Spatial-temporal mapping and risk factors for hand foot and mouth disease in northwestern inland China[J]. PLoS Negl Trop Dis, 2021, 15(3): e0009210. DOI:10.1371/journal.pntd.0009210 |
| [24] |
Du ZC, Lawrence WR, Zhang WJ, et al. Bayesian spatiotemporal analysis for association of environmental factors with hand, foot, and mouth disease in Guangdong, China[J]. Sci Rep, 2018, 8(1): 15147. DOI:10.1038/s41598-018-33109-3 |
| [25] |
Hu MG, Li ZJ, Wang JF, et al. Determinants of the incidence of hand, foot and mouth disease in China using geographically weighted regression models[J]. PLoS One, 2012, 7(6): e38978. DOI:10.1371/journal.pone.0038978 |
| [26] |
Ren ZP, Zhu J, Gao YF, et al. Maternal exposure to ambient PM10 during pregnancy increases the risk of congenital heart defects: evidence from machine learning models[J]. Sci Total Environ, 2018, 630: 1-10. DOI:10.1016/j.scitotenv.2018.02.181 |
| [27] |
Yang Y, Luo LW, Song C, et al. Spatiotemporal assessment of PM2.5-related economic losses from health impacts during 2014-2016 in China[J]. Int J Environ Res Public Health, 2018, 15(6): 1278. DOI:10.3390/ijerph15061278 |