 2022, Vol. 43
文章信息
- 谢晨, 马爱娟, 谢瑾, 姜博, 方凯, 隗瑛琦, 董忠.
- Xie Chen, Ma Aijuan, Xie Jin, Jiang Bo, Fang Kai, Wei Yingqi, Dong Zhong
- 北京市18~64岁劳动力人口经常锻炼情况及其影响因素分析
- Current status of regular exercise and influencing factors in 18-64 year old labor force population in Beijing
- 中华流行病学杂志, 2022, 43(3): 373-379
- Chinese Journal of Epidemiology, 2022, 43(3): 373-379
- http://dx.doi.org/10.3760/cma.j.cn112338-20210727-00589
-
文章历史
收稿日期: 2021-07-27


劳动力人口是家庭和社会经济来源的支柱。当前,中国适龄劳动力人口减少,老龄化程度不断加深,推行符合国情的延迟退休政策及保持劳动力人口质量十分重要[1]。体育锻炼可提高或保持包括心肺耐力在内的一种或者多种身体能力[2-3]。在生命过程中保持体育锻炼的良好习惯,有助于慢性病的预防与控制,促进健康老龄化[4-7],维持劳动力人口健康水平。本研究对2017年北京市18~64岁劳动力人口的经常锻炼水平及影响因素进行分析,并提出有针对性的干预建议。
对象与方法1. 研究对象:2017年8-12月采用分层整群的抽样方法,从北京市16个区抽取55个街道165个社区。抽样共分4个阶段,最终在全市抽取18~79岁、过去1年内在北京市居住超过6个月的常住居民13 240人,具体各阶段抽样方法及样本量计算方法参见文献[8]。本研究以其中18~64岁劳动力人口作为研究对象[9],剔除年龄、性别、身体活动等关键变量缺失及异常值记录后,共纳入有效样本11 604人。本研究通过北京市CDC伦理委员会审查(批准文号:2017第5号),所有研究对象均签署知情同意书。
2. 研究方法:问卷调查内容包括基本人口学信息、使用全球身体活动问卷(global physical activity questionnaire,GPAQ)收集调查对象通常一周内各类身体活动信息(包括高、中等强度活动天数及时间,每次活动时间≥10 min者计入累积时间)、慢性病患病及主要相关影响因素等。调查采用面对面一对一询问方式,全部调查员经统一培训且考核合格。测量身高、体重、腰围等指标。抽取调查对象5 ml空腹静脉血,采用7600型全自动生化仪(日本日立公司)测定TC、TG、FPG、HDL-C和LDL-C,具体方法参见文献[8]。
3. 指标定义:①经常锻炼指每周至少有3天参加休闲性活动,每天活动时间至少30 min,且运动强度达到中等及以上[10];从不锻炼指业余时间从不参加任何形式的休闲性身体活动[11];身体活动水平判断标准以代谢当量(metabolic equivalent,MET)表示,计算公式:身体活动量(MET-min)=MET×每周活动天数(d)×每天活动时间(min)。本研究以GPAQ收集工作、农业及家务性、交通性与休闲性3类身体活动数据,对其中高等强度活动(如搬运重物、挖掘、长跑及游泳等)赋值为8.0 MET,中等强度活动(如手洗衣服、打扫卫生、快步走、骑自行车等)赋值为4.0 MET[12]。参考美国GPAQ指南将身体活动水平分为3级:偏低或不足(累积身体活动量 < 600 MET-min/周)、中等(600 MET-min/周≤累积身体活动量 < 3 000 MET-min/周)、较高(累积身体活动量≥3 000 MET-min/周)[13]。②糖尿病患者定义为本次监测FPG≥7.0 mmol/L者或已被乡镇/社区级或以上医院确诊为糖尿病者;高血压患者定义为SBP≥140 mmHg(1 mmHg=0.133 kPa)和/或DBP≥90 mmHg,或自报曾被社区级或以上医院医生诊断为高血压者且近两周内服用降压药物者[14]。③血脂异常定义为TG≥2.3 mmol/L,或TC≥6.2 mmol/L,或HDL-C < 1.0 mmol/L,或LDL-C≥4.1 mmol/L[15]。④参照《中国成人超重和肥胖症预防控制指南》[16]依据BMI(kg/m2)将体重判定为偏瘦(< 18.5)、正常(18.5~)、超重(24.0~)、肥胖(≥28.0)。⑤北京市东城、西城、朝阳、海淀、丰台、石景山区为城区,其余为郊区;就业情况分为就业与未就业。⑥静态行为指安静地坐着、靠着或躺着看电视、使用电脑、玩电子游戏、阅读等[17]。
4. 统计学分析:应用SPSS 20.0软件整理和分析数据。由于本监测采用复杂抽样设计,且为减少偏倚,需对样本进行抽样加权并对样本结构进行事后分层调整。针对每位调查对象的抽样权重计算过程:依次计算调查对象在各阶段所属样本单元的抽样权重,再计算这些权重的乘积作为最终抽样权重。事后分层权重:采用2010年北京市第6次人口普查数据计算各年龄、性别的权重,每层事后分层权重值的计算公式:普查在第K层的人口数/样本在第K层的人口数。调查对象个体的最终权重为抽样权重和事后分层权重乘积[8]。计算复杂样本的加权均数、加权率及其95%CI。采用Rao-Scott χ2检验进行率的组间差异比较,采用复杂抽样单因素一般线性模型的效应检验进行均数的组间比较,采用复杂抽样logistic回归模型进行率的趋势分析,采用复杂抽样一般线性回归模型进行定量数据趋势检验。构建复杂样本的logistic回归模型,进行多因素分析,变量赋值见表 1,检验水准α=0.05。

1. 一般情况:11 604名研究对象年龄为(41.61±13.30)岁,男性5 463人(47.08%),女性6 141人(52.92%);城区7 509人(64.71%),郊区4 095人(35.29%);初中及以下文化程度人群占比最高为4 382人(37.76%);已婚/同居8 860人(76.35%);就业人群7 746人(66.75%);超重/肥胖人群7 136人(61.50%);高血压、糖尿病及血脂异常人群分别为2 545人(21.93%)、1 204人(10.38%)及4 042人(34.83%);身体活动高水平人群为4 171人(35.94%)。见表 2。
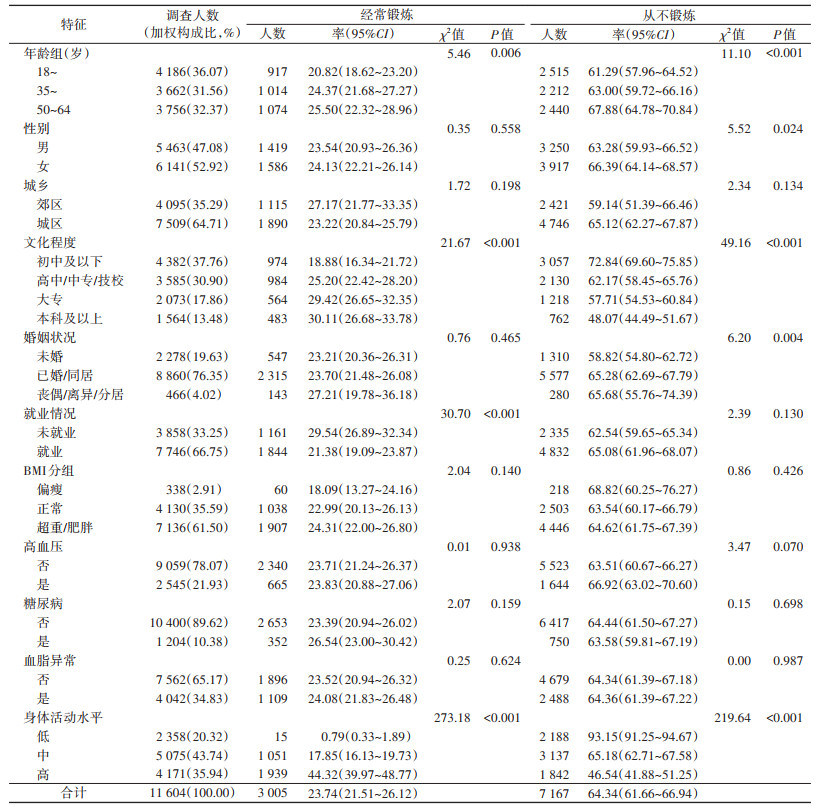
2. 不同特征人群经常锻炼与从不锻炼率:研究对象经常锻炼率和从不锻炼率分别为23.74%(95%CI:21.51%~26.12%)和64.34%(95%CI:61.66%~66.94%)。50~64岁人群经常锻炼率(χ2=5.46,趋势检验P=0.006)和从不锻炼率(χ2=11.10,趋势检验P < 0.001)均最高;文化程度越高(经常锻炼χ2=21.67,趋势检验P < 0.001;从不锻炼χ2=49.16,趋势检验P < 0.001)、身体活动量越大(经常锻炼χ2=273.18,趋势检验P < 0.001;从不锻炼χ2=219.64,趋势检验P < 0.001)的人群经常锻炼率越高,从不锻炼率越低。本研究对构成身体活动总量的各类身体活动量之间的相关性进行进一步分析,其中趋势分析结果提示,交通性身体活动量与休闲性身体活动量呈正相关(F=24.95,P < 0.001);本研究身体活动总量中,交通性和休闲性身体活动仅占36.11%和13.94%,高强度身体活动量中,休闲性活动仅占36.37%。就业人群经常锻炼率低于未就业人群(χ2=30.70,P < 0.001)。女性从不锻炼率(66.39%)高于男性(63.28%,P=0.024);未婚人群从不锻炼率为最低(χ2=6.20,P=0.004)。高血压、糖尿病、血脂异常与否,经常锻炼率和从不锻炼率差异无统计学意义。见表 2。
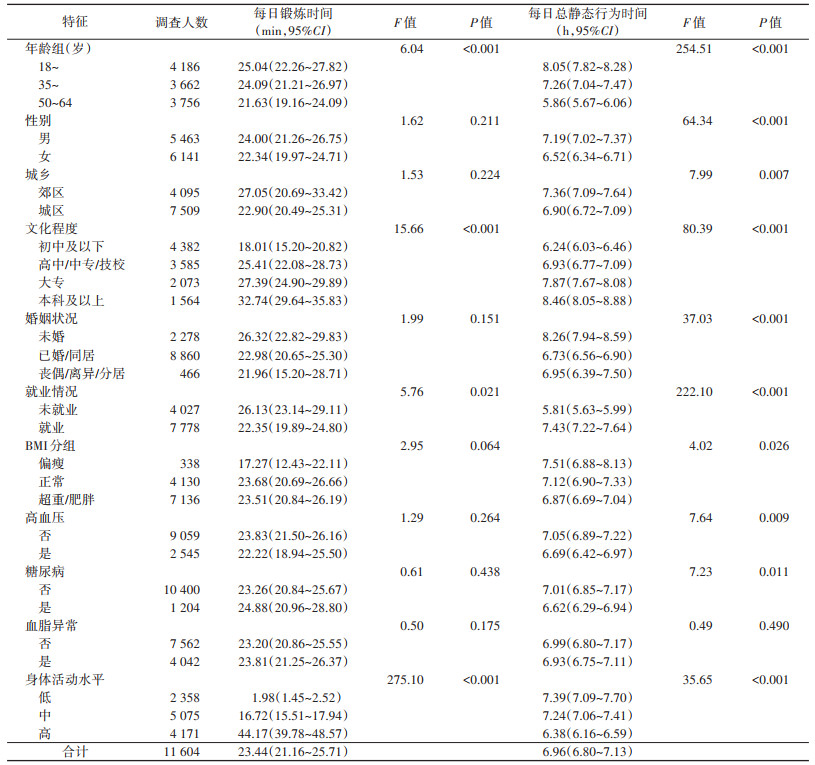
3. 不同特征人群每日锻炼及每日总静态行为时间比较:研究对象每日锻炼时间为23.44(95%CI:21.16~25.71)min,每日总静态行为时间为6.96(95%CI:6.80~7.13)h。随年龄增大,每日锻炼(F=6.04,P < 0.001)、每日总静态行为时间(F=254.51,P < 0.001)均减少;文化程度越高每日锻炼时间及每日总静态行为时间也越长(趋势检验P < 0.001);未就业人群每日锻炼时间比就业人群长(F=5.76,P=0.021)身体活动水平越高人群每日锻炼时间越长,每日总静态行为时间越短(趋势检验P < 0.001)。男性(F=64.34,P < 0.001)、郊区人群(F=7.99,P=0.007)、未婚人群(F=37.03,P < 0.001)、就业人群(F=222.10,P < 0.001)及偏瘦人群(F=4.02,P=0.026)每日总静态行为时间多于女性、城区、其他婚姻状况、未就业及正常和超重/肥胖人群;患高血压(P=0.009)、糖尿病患者(P=0.011)每日总静态行为时间均低于非患者。见表 3。
4. 经常锻炼影响因素的多因素分析:以经常锻炼与否为因变量,进行复杂样本的logistic回归分析。结果显示,年龄越大、文化程度高是经常锻炼的积极因素(35~岁:OR=0.653,95%CI:0.530~0.804,P < 0.001;50~64岁:OR=0.695,95%CI:0.560~0.864,P=0.001;高中/中专/技校:OR=0.679,95%CI:0.593~0.777,P < 0.001;大专:OR=0.478,95%CI:0.387~0.590,P < 0.001;本科及以上:OR=0.435,95%CI:0.347~0.546,P < 0.001),而就业(OR=1.631,95%CI:1.330~2.000,P < 0.001)及已婚/同居(OR=1.340,95%CI:1.093~1.644,P=0.038)是经常锻炼的消极因素。见表 4。

2017年中国北京市18~64岁劳动力人口经常锻炼率为23.74%,高于2008年水平,但远低于美国2001年的水平(45%)[18];从不锻炼率为64.34%,虽与2008年相比下降了6.9%左右[11],但仍处于高水平;每日锻炼时间为23.44(21.16~25.71)min,整体未达到每日30 min的要求,低于澳大利亚同年水平(44.7 min)[19];每日总静态行为时间达6.96(6.80~7.13)h,高于澳大利亚2011年的5.93 h[20]、低于美国2003年的7.67 h[21]。2008年中国北京奥运会使健康北京理念得以推广,之后,北京市政府颁布“健康北京人——全民健康促进十年行动规划(2009-2018年)”,对全民健身发挥了良好的促进作用[22],但效果并未达到预期。2020年北京市出台的《健康北京行动(2020-2030年)》,包括了全民健身普及行动,再次为经常锻炼水平的提升提供了政策保障,希望进一步提升人群身体锻炼水平。
2017年北京市劳动力人口经常锻炼率及从不锻炼率均随着年龄增大而升高,每日锻炼时间及每日总静态行为时间均随着年龄增大而减少,说明存在锻炼“两极分化”情况。故机关、企事业单位应利用团队、职场监督激励机制[23],倡导先进带动落后,积极开展集体性健身活动,以达到进一步扩大体育锻炼人数比例的目的;对于未就业人群,可借助社区现有支持性环境[24],鼓励其进行有效的锻炼。另外,劳动力人口文化程度越高,经常锻炼率也越高,从不锻炼率越低,每日锻炼时间和每日总静态行为时间都越长,这与北京市[25]及国内其他研究[26]一致,原因可能为高文化程度人群多从事静态职业,但能有意识地增加锻炼时间。超重/肥胖、患高血压及糖尿病人群每日总静态行为时间均低于体重正常人群及非患者,说明患病人群多有意识采取增加身体活动量的方式控制自身疾病,也提示应在一般人群和慢性病高危人群中倡导加强身体活动。
本研究提示,高身体活动水平者中经常锻炼人群比例最大,且每日锻炼时间最长,但休闲类身体活动量占比仍较低。工作、农业及家务性身体活动只能调动单一肌群,并不能获得持久健康收益,故应重点宣传业余时间锻炼的不可替代性[27],鼓励更多人群进行有效锻炼。另外,本研究提示,休闲性与交通性身体活动量呈正相关,以此为依据,可推广与普及将锻炼融入日常生活的理念,从改变出行方式等入手,达到“体育生活化”的目标[2]。
多因素分析提示,就业及已婚/同居人群的不锻炼风险较大。其更易将更多精力放在工作及家务中,故为其提供方便可及且安全的锻炼场地及器材,指导其利用碎片化时间进行锻炼,借助团队激励机制发挥同伴效应的策略不应动摇[28]。既往研究中女性不经常锻炼风险更大[11, 29],这在本研究多因素分析结果中未体现,说明近年来北京市劳动力人口中女性经常锻炼水平已有所提高。但由于女性对家庭生活方式的选择有决定性作用,应帮助其形成良好的生活方式,也有助于消除经常锻炼的性别间差异[11, 30-31]。
本研究存在局限性。身体活动量信息为调查对象自报获得,存在回忆偏倚。但调查开始前已对所有调查员进行了培训,除身体活动量判定标准外,还对如何帮助调查对象准确回忆等调查技巧进行了培训,同时调查过程质控严格,已尽量保证了调查质量。未来考虑使用体质及心肺耐力设备开展专项调查,以客观收集身体活动数据。
综上所述,2017年北京市劳动力人口经常锻炼率仍处于较低水平,已婚/同居及就业为经常锻炼的消极因素,需根据人群不同特征进行针对性干预,以全民健康生活方式和全民健身为抓手,推广“体育生活化”,改善支持性环境,使劳动力人口获得更多健康收益。
利益冲突 所有作者声明无利益冲突
作者贡献声明 谢晨:统计学分析、论文撰写;马爱娟:对文章的知识性内容作批评性审阅、现场调查、质量控制;谢瑾、姜博、方凯、隗瑛琦:对文章的知识性内容作批评性审阅;董忠:研究指导、论文修改
| [1] |
陈友华, 张子彧. 延迟退休对老年人口福利水平的影响研究[J]. 现代经济探讨, 2020(12): 24-32. Chen YH, Zhang ZY. Research on the impact of delayed retirement on the welfare level of the elderly population[J]. Mod Econom Res, 2020(12): 24-32. DOI:10.13891/j.cnki.mer.2020.12.005 |
| [2] |
Caspersen CJ, Powell KE, Christenson GM. Physical activity, exercise, and physical fitness: definitions and distinctions for health-related research[J]. Public Health Rep, 1985, 100(2): 126-131. DOI:10.2307/20056429 |
| [3] |
刘欣. 全民健身的健康效应及在推进健康上海建设中的路径[J]. 上海预防医学, 2020, 32(1): 16-22. Liu X. Health effects of national fitness and its approach to construction of Healthy Shanghai[J]. Shanghai J Prev Med, 2020, 32(1): 16-22. DOI:10.19428/j.cnki.sjpm.2020.19870 |
| [4] |
Sattelmair J, Pertman J, Ding EL, et al. Dose response between physical activity and risk of coronary heart disease: a meta-analysis[J]. Circulation, 2011, 124(7): 789-795. DOI:10.1161/CIRCULATIONAHA.110.010710 |
| [5] |
Huai PC, Xun HM, Reilly KH, et al. Physical activity and risk of hypertension: a meta-analysis of prospective cohort studies[J]. Hypertension, 2013, 62(6): 1021-1026. DOI:10.1161/HYPERTENSIONAHA.113.01965 |
| [6] |
Warburton DE, Charlesworth S, Ivey A, et al. A systematic review of the evidence for Canada's physical activity guidelines for adults[J]. Int J Behav Nutr Phys Act, 2010, 7(1): 39. DOI:10.1186/1479-5868-7-39 |
| [7] |
吕娇娇, 刘宇. 身体活动对轻度认知损害老年人认知功能的影响及其可能机制[J]. 中国康复医学杂志, 2016, 31(7): 809-813. Lv JJ, Liu Y. Effect of physical activity on cognitive function in elderly with mild cognitive impairment and its possible mechanism[J]. Chin J Rehabil Med, 2016, 31(7): 809-813. DOI:10.3969/j.issn.1001-1242.2016.07.023 |
| [8] |
黄春, 董忠, 马爱娟. 北京市成人慢性病及其危险因素监测报告(2017)[M]. 延吉: 延边大学出版社, 2019: 3-4. Huang C, Dong Z, Ma AJ. Report on chronic disease risk factor surveillance in Beijing[M]. Yanji: Yanbian University Press, 2019: 3-4. |
| [9] |
南亮进, 薛进军. 1949-1999年中国人口和劳动力推算[J]. 中国人口科学, 2002(3): 1-16. Nan LJ, Xue JJ. Estimation of population and labor fore in China: 1949-1999[J]. Chin J Populat Sci, 2002(3): 1-16. DOI:10.3969/j.issn.1000-7881.2002.03.001 |
| [10] |
国家体育总局. 第三次全国群众体育现状调查报告(2007)[M]. 北京: 人民体育出版社, 2010: 44-54. General Administration of Sport of China. The 3rd national mass sport status investigation report (2007)[M]. Beijing: Physical Education Press, 2010: 44-54. |
| [11] |
马爱娟, 董忠, 董晶. 2008和2014年北京市成人业余锻炼情况及影响因素分析[J]. 中国慢性病预防与控制, 2018, 26(3): 193-197. Ma AJ, Dong Z, Dong J. Current status and influencing factors of leisure-time physical exercise among adults from 2008 to 2014 in Beijing[J]. Chin J Prev Control Chronic Dis, 2018, 26(3): 193-197. DOI:10.16386/j.cjpccd.issn.1004-6194.2018.03.008 |
| [12] |
樊萌语, 吕筠, 何平平. 国际体力活动问卷中体力活动水平的计算方法[J]. 中华流行病学杂志, 2014, 35(8): 961-964. Fan MY, Lv J, He PP. Chinese guidelines for data processing and analysis concerning the international physical activity questionnaire[J]. Chin J Epidemiol, 2014, 35(8): 961-964. DOI:10.3760/cma.j.issn.0254-6450.2014.08.019 |
| [13] |
World Health Organization. Global Physical Activity Questionnaire (GPQA) Analysis Guide[Z]. Geneva: Switzerland, 2010.
|
| [14] |
北京市人民政府. 北京市2015年度卫生与人群健康状况报告[M]. 北京: 人民卫生出版社, 2016: 153-154. The People's Government of Beijing Municipal. 2015 Beijing health and population health report[M]. Beijing: People's Health Publishing House, 2016: 153-154. |
| [15] |
中国成人血脂异常防治指南制订联合委员会. 中国成人血脂异常防治指南[J]. 中华心血管病杂志, 2007, 35(5): 390-419. Joint Committee for Developing Chinese Guidelines on Prevention and Treatment of Dyslipidemia in Adults. Chinese guidelines on prevention and treatment of dyslipidemia in adults[J]. Chin J Cardiol, 2007, 35(5): 390-419. DOI:10.3760/j.issn:0253-3758.2007.05.003 |
| [16] |
中国肥胖问题工作组. 中国成人超重与肥胖症预防与控制指南(节录)[J]. 营养学报, 2004, 26(1): 1-4. China Obesity Working Group. Guidelines for prevention and control of overweight and obesity in Chinese adults[J]. Acta Nutrim Sin, 2004, 26(1): 1-4. DOI:10.3321/j.issn:0512-7955.2004.01.001 |
| [17] |
中国疾病预防控制中心慢性非传染性疾病预防控制中心. 中国慢性病及其危险因素监测报告(2013)[M]. 北京: 军事医学出版社, 2016: 24. National Center for Chronic and Non-communicable Disease Control and Prevention, Chinese Center for Disease Control and Prevention. Surveillance report on chronic diseases and their risk factors in China (2013)[M]. Beijing: Military Medical Press, 2016: 24. |
| [18] |
Macera CA, Ham SA, Yore MM, et al. Prevalence of physical activity in the United States: behavioral risk factor surveillance system, 2001[J]. Prev Chronic Dis, 2005, 2(2): A17.1-A17.10. |
| [19] |
Australian Bureau of Statistics. National Health Survey: First results[DB/OL]. (2018-12-12)[2021-08-18]. https://www.abs.gov.au/statistics/health/health-conditions-and-risks/national-health-survey-first-results/2017-18#endnotes.
|
| [20] |
Australian Bureau of Statistics. Australian health survey: physical activity[DB/OL]. (2013-07-19)[2021-08-18]. https://www.abs.gov.au/statistics/health/health-conditions-and-risks/australian-health-survey-physical-activity/latest-release#data-download.
|
| [21] |
Matthews CE, Chen KY, Freedson PS, et al. Amount of time spent in sedentary behaviors in the United States, 2003-2004[J]. Am J Epidemiol, 2008, 167(7): 875-881. DOI:10.1093/aje/kwm390 |
| [22] |
董忠. 借"全民健康促进十年行动规划"塑造"健康北京人"[J]. 中国预防医学杂志, 2010, 11(11): 1179-1181. Dong Z. Shaping "healthy Beijing persons" through the "ten year action plan for national health promotion"[J]. China Prev Med, 2010, 11(11): 1179-1181. DOI:10.16506/j.1009-6639.2010.11.011 |
| [23] |
蒋炜, 赵一凡, 杨幸子, 等. 2016年中国职业人群健走激励效果及相关因素分析[J]. 中华预防医学杂志, 2018, 52(5): 517-523. Jiang W, Zhao YF, Yang XZ, et al. Effects and the associated factors of the 2016 China Motivational Healthy Walking Program among occupational population[J]. Chin J Prev Med, 2018, 52(5): 517-523. DOI:10.3760/cma.j.issn.0253-9624.2018.05.011 |
| [24] |
黄晓霞, 钱雯, 尉敏琦, 等. 居住周边环境对居民身体活动水平影响[J]. 中国公共卫生, 2014, 30(4): 412-416. Huang XX, Qian W, Wei MQ, et al. Impact of residential neighborhood environment on residents' physical activity[J]. Chin J Public Health, 2014, 30(4): 412-416. DOI:10.11847/zgggws2014-30-04-10 |
| [25] |
吴士艳, 张旭熙, 杨帅帅, 等. 北京市某近郊区居民身体活动情况及其影响因素[J]. 北京大学学报: 医学版, 2016, 48(3): 483-490. Wu SY, Zhang XX, Yang SS, et al. Physical activity level and its influence factors among residents in one suburb district of Beijing[J]. J Peking Univ: Health Sci, 2016, 48(3): 483-490. DOI:10.3969/j.issn.1671-167X.2016.03.019 |
| [26] |
谢强明, 杨人贵, 黄渊秀, 等. 长沙市成人运动锻炼身体活动现状及影响因素分析[J]. 中国预防医学杂志, 2018, 19(7): 514-519. Xie QM, Yang RG, Huang YX, et al. Current status of physical activity and its influencing factors among adults in Changsha city[J]. Chin Prev Med, 2018, 19(7): 514-519. DOI:10.16506/j.1009-6639.2018.07.008 |
| [27] |
Kivimäki M, Jokela M, Nyberg ST, et al. Long working hours and risk of coronary heart disease and stroke: a systematic review and meta-analysis of published and unpublished data for 603838 individuals[J]. Lancet, 2015, 386(10005): 1739-1746. DOI:10.1016/S0140-6736(15)60295-1 |
| [28] |
孙锡杰. 同伴效应对城市大众健身行为的影响[J]. 体育科技, 2013, 34(5): 97-99. Sun XJ. Effects of peer relationships on public health behavior[J]. Sport Sci Technol, 2013, 34(5): 97-99. DOI:10.3969/j.issn.1003-1359.2013.05.031 |
| [29] |
罗富健, 曹杰, 董忠, 等. 2011年北京市成年居民身体活动与经常锻炼现状调查[J]. 中国循环杂志, 2018, 33(1): 73-78. Luo FJ, Cao J, Dong Z, et al. 2011 Status survey for physical activity and regular exercise in adult residents of Beijing[J]. Chin Circulation J, 2018, 33(1): 73-78. DOI:10.3969/j.issn.1000-3614.2018.01.014 |
| [30] |
Mielke GI, Da Silva ICM, Kolbe-Alexander TL, et al. Shifting the physical inactivity curve worldwide by closing the gender gap[J]. Sport Med, 2018, 48(2): 481-489. DOI:10.1007/s40279-017-0754-7 |
| [31] |
Koohpayehzadeh J, Etemad K, Abbasi M, et al. Gender-specific changes in physical activity pattern in Iran: national surveillance of risk factors of non-communicable diseases (2007-2011)[J]. Int J Public Health, 2014, 59(2): 231-241. DOI:10.1007/s00038-013-0529-3 |