 2021, Vol. 42
文章信息
- 刘威, 王黎君, 齐金蕾, 刘江美, 由金玲, 林琳, 殷鹏, 周脉耕.
- Liu Wei, Wang Lijun, Qi Jinlei, Liu Jiangmei, You Jinling, Lin Lin, Yin Peng, Zhou Maigeng
- 1990-2017年中国女性乳腺癌疾病负担分析
- Disease burden of breast cancer in women in China, 1990-2017
- 中华流行病学杂志, 2021, 42(7): 1225-1230
- Chinese Journal of Epidemiology, 2021, 42(7): 1225-1230
- http://dx.doi.org/10.3760/cma.j.cn112338-20200908-01139
-
文章历史
收稿日期: 2020-09-08


2. 中国疾病预防控制中心慢性非传染性疾病预防控制中心, 北京 100050
2. National Center for Chronic and Noncommunicable Disease Control and Prevention, Chinese Center for Disease Control and Prevention, Beijing 100050, China
在全球女性恶性肿瘤造成的死亡中,乳腺癌排第一位,是世界范围内主要的公共卫生负担,根据全球疾病负担研究(GBD)报道2017年全球女性乳腺癌标化发病率和标化死亡率分别为45.91/10万和14.15/10万,中国分别为35.62/10万和8.47/10万[1]。尽管我国女性乳腺癌的发病及死亡均低于全球水平,但是我国乳腺癌的疾病负担呈现逐年加重的趋势,乳腺癌的防治形势十分严峻[2]。据中国肿瘤年报数据显示,2015年乳腺癌位居我国女性恶性肿瘤发病首位,是我国常见的恶性肿瘤和主要的肿瘤死亡原因[3]。为描述和分析我国1990-2017年乳腺癌的发病和死亡情况及发展趋势,重点关注乳腺癌伤残和早死造成的疾病负担及其变化情况,本研究利用GBD中国分省疾病负担研究项目数据进行分析,为我国优化乳腺癌防治工作提供科学依据。
资料与方法1. 资料来源:来源于GBD中国1990-2017年分省数据,乳腺癌发病数据来源于全国肿瘤登记系统、疾病监测系统以及文献检索等;死亡数据主要来源全国疾病监测点系统死因监测、全国肿瘤登记数据、全国妇幼卫生监测、中国CDC死因登记报告信息系统、中国香港地区和中国澳门地区死因数据以及一些相关报告或已发表的文献等,其他数据来源及分析方法见文献[4-6]。死因数据先后采用《国际疾病分类》进行编码。乳腺癌编码范围:ICD-10(C50~C50.9,D05~D05.9,D24~D24.9,D48.6,D49.3),ICD-9(174~175.9,217~217.8,233.0,238.3,239.3,610~610.9)。
2. 数据分析和测量指标:采用整体建模策略估计乳腺癌的死亡数和死亡率,并利用全国肿瘤登记系统报告的乳腺癌发病数和死亡数计算监测地区的人群发病率和死亡率,用死亡率除以发病率估算不同省份、不同年龄别、性别及不同年份的乳腺癌死亡发病比,并用死亡发病比估算人群发病数据[4-5]。GBD提出了归因负担公式,使用疾病负担指标的估计值[即死亡人数、过早死亡损失寿命年(YLL)、伤残损失寿命年(YLD)或伤残调整寿命年(DALY)]、危险因素的暴露水平、危险因素的理论最小风险暴露水平以及暴露引起结果的相对危险度这4个组成部分的相对风险来估计对饮酒、高BMI、高FPG、低体力活动和吸烟这5个乳腺癌危险因素的可归因负担[1, 6-7]。采用DALY、YLL和YLD作为测量乳腺癌造成的疾病负担指标,主要计算公式:DALY= YLL+YLD,YLL估算方法为不同年龄组乳腺癌死亡数乘以其对应分组的期望寿命值,YLD估算方法为不同年龄组患病例数乘以伤残权重,具体方法见文献[4, 8]。以GBD2017世界标准人口对发病率、死亡率、DALY率、YLL率及YLD率进行标化。本研究利用乳腺癌发病数、死亡数、标化发病率、标化死亡率、可归因死亡数和DALY、YLL、YLD及其标化率等指标分析1990-2017年中国女性乳腺癌发病和死亡变化情况、归因情况、造成的疾病负担及变化趋势。
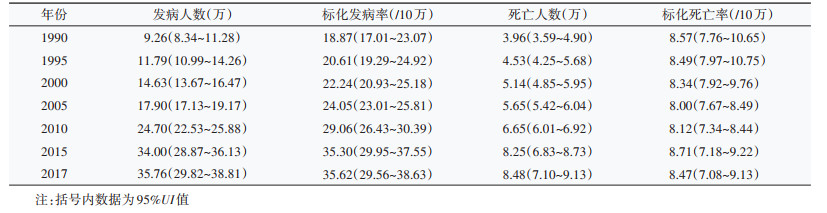
结果1. 乳腺癌发病及死亡情况:我国女性乳腺癌的发病人数及标化发病率均呈逐年增加趋势,2017年我国女性因乳腺癌发病例数达35.76万,较1990年的9.26万增加286.18%;标化发病率由1990年的18.87/10万增至2017年的35.62/10万,增加88.77%。我国乳腺癌的死亡人数亦呈逐年上升的趋势,而标化死亡率则不同。与1990年相比,2017年的乳腺癌死亡人数增加114.14%。1990-2017年,我国女性乳腺癌标化死亡率呈“波浪状”趋势,先由1990年的8.57/10万逐年降至2007年的7.84/10万,再逐年增加至2015年的8.71/10万,而后又逐年降低至2017年的8.47/10万。见表 1。
2. 不同年龄组发病及死亡变化趋势:0~19岁的女性发病率最低,1990年与2017年中国女性乳腺癌发病率随着年龄增长呈先升后降,1990年发病率高峰为60~64岁(53.99/10万),2017年发病率高峰延后了5年,为65~69岁,且与1990年相比,该年龄组的增幅最大,为144.20%(1990年:50.95/10万;2017年:124.42/10万)。见图 1。

|
| 图 1 1990年与2017年中国各年龄段女性乳腺癌发病率变化比较 |
1990年和2017年我国女性乳腺癌死亡率均随着年龄的增长而升高,0~19岁组死亡率最低,≥ 80岁组死亡率最高。2017年我国 < 60岁年龄组女性乳腺癌死亡率都低于1990年,其中20~24岁年龄组死亡降低幅度最大,为62.96%(1990年:0.27/10万;2017年:0.1/10万);≥60岁年龄组死亡率则均高于1990年,75~79岁年龄组死亡增加幅度最大,为34.64%(1990年:35.77/10万;2017年:48.16/10万)。见图 2。

|
| 图 2 1990年与2017年中国各年龄段女性乳腺癌死亡率变化比较 |
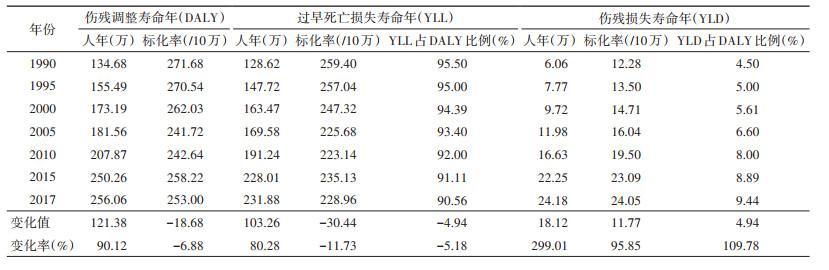
3. 乳腺癌造成的疾病负担:1990年我国女性乳腺癌造成的DALY、YLL和YLD分别为134.68、128.62和6.06万人年,与之相比,2017年3类指标分别增加90.12%(256.06万人年)、80.28%(231.88万人年)和299.01%(24.18万人年)。1990-2017年,DALY标化率和YLL标化率呈现与标化死亡率相同的趋势,DALY标化率由1990年的271.68/10万降至2017年的253.00/10万,减少了6.88%;YLD标化率则不同,呈现逐年上升趋势,增加95.85%(1990年12.28/10万,2017年24.05/10万)。研究期间,中国女性乳腺癌YLD占DALY的比例也呈逐年增加趋势。见表 2。
4. 女性乳腺癌归因死亡情况:与1990年相比,2017年我国可归因于高BMI的乳腺癌死亡比例增加明显,从5.49%增至14.59%,增加165.76%;可归因于饮酒和高FPG的乳腺癌死亡比例有所增加;可归因于低体力活动和吸烟的乳腺癌死亡比例基本保持稳定;而可归因于被动吸烟的乳腺癌死亡比例有所降低。见图 3。

|
| 图 3 1990年和2017年不同危险因素导致中国女性乳腺癌死亡的人群归因分值 |
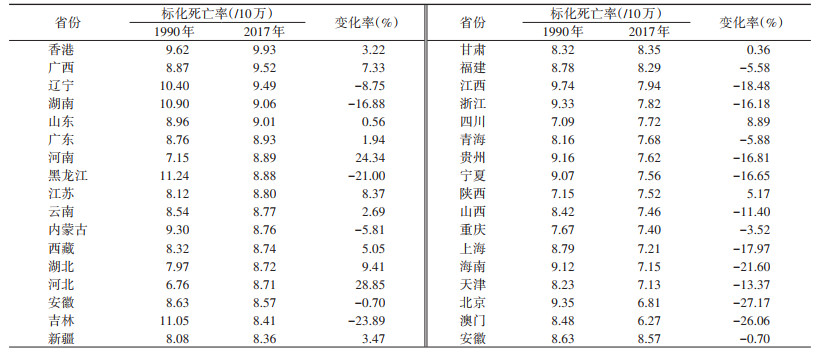
5. 女性乳腺癌标化死亡率各省分布情况:2017年乳腺癌标化死亡率较高的6个省份分别是香港特别行政区(9.93/10万)、广西壮族自治区(9.52/10万)、辽宁省(9.49/10万)、湖南省(9.06/10万)、山东省(9.01/10万)和广东省(8.93/10万)。相较于1990年,有19个省份的乳腺癌标化死亡率出现下降,其中下降率最高的5个省份是北京市(-27.17%)、澳门特别行政区(-26.06%)、吉林省(-23.89%)、海南省(-21.60%)和黑龙江省(-21.00%);增长率最高的2个省份是河北省(28.85%)和河南省(24.34%)。见表 3。
本研究结果显示,我国女性乳腺癌的发病数、死亡数以及标化发病率呈逐年增加趋势,DALY、YLL、YLD及YLD标化率均呈逐年上升趋势,然而DALY标化率和YLL标化率则出现与标化死亡率相同的趋势,表现为先下降再上升而后又呈下降的趋势。与1990年相比,2017年我国大多数省份的标化死亡率出现下降;60岁之前各年龄组人群的死亡率均出现降低,而60岁及之后年龄组则表现为明显上升;此外,归因于高BMI的乳腺癌死亡比例明显增加。
有研究认为低社会人口学指数国家乳腺癌发病率的增加可能是由于生活方式西化造成的,其特征是生育模式的变化,包括相对较晚的第一胎、月经初潮年龄较早、母乳喂养持续时间短、产次低和肥胖[9-10]。1990-2017年中国女性乳腺癌的标化死亡率曲线呈“波浪状”,1990-2007年呈逐年降低,而后到2015年则为逐年上升,而后又呈下降趋势。有研究认为标化死亡率下降可能归因于治疗方法的改进,包括手术技术、放射治疗和系统治疗[11]。而对于上升的原因则可能是随着广泛筛查的开展和期望寿命的增加,乳腺癌的发病率增加,进而死亡率增加。与之相应的,DALY标化率和YLL标化率也有相同的趋势。
此外,随着乳腺癌发病例数和死亡人数的不断增加,所造成的DALY、YLL、YLD及YLD标化率均逐年增加,对我国社会经济及医疗卫生带来沉重负担。本研究结果显示,1990-2017年乳腺癌造成的YLD占DALY的比例表现为逐年增加趋势,说明乳腺癌患者的生存期逐年增加,同时也提示乳腺癌造成的健康寿命年的损失应引起重视,这与既往发表的文献一致[12]。
本研究对不同年龄组人群分析发现,2017年中国女性乳腺癌发病主要集中在65~69岁年龄组病例,相较于1990年延后了5年,且60岁之前各年龄组的死亡率均有所下降,这可能与人们生活方式改变、卫生意识提高以及乳腺癌广泛筛查的开展有关。60岁以后各年龄组死亡率增加明显的原因可能与我国期望寿命增加且乳腺癌患者的生存期延长有关。值得注意的是,与1990年相比,2017年我国45岁以上年龄组女性的乳腺癌发病率明显增加,在65~69岁年龄组增幅最大,这可能与人群暴露因素的变化相关。
从归因危险因素的角度分析,遗传性原因只占乳腺癌病例的5%~10%[13],非遗传原因占主导地位。一项印度的研究发现高BMI、高FPG水平及被动吸烟与其乳腺癌疾病负担增加有关[14]。国际癌症研究机构也证实,高BMI、低体力活动与食管癌、乳腺癌、结直肠癌等发病有关,尤其是增加绝经后的乳腺癌及多种肿瘤的发病风险[10]。我国可归因于高BMI的乳腺癌死亡比例较1990年有较大幅度的增加,说明我国居民的生活方式及饮食习惯问题突出,大力倡导健康生活方式仍是重中之重。与1990年相比,我国归因于吸烟的乳腺癌死亡比例增加,但归因于被动吸烟的比例却出现下降,这可能与我国公共场所禁止吸烟措施的不断落实有关。除此之外我国可归因于饮酒的乳腺癌死亡比例表现为增加趋势,这与全球的下降趋势不同,因此降低酒精摄入也是主要任务之一。
既往文献报道显示,尽管乳腺癌的诊断和治疗方法发展迅速,但不同地区和不同国家的发展速度不同,导致疾病负担的差异很大[15]。在我国也出现了这种情况,相较于1990年,有19个省份的乳腺癌标化死亡率出现下降,其中下降率最高的是北京市和澳门特别行政区,而在标化死亡率出现增长的省份中增长率最高的两个省份是河北省和河南省。有资料显示,近年间,许多经济发达的城市如北京市,乳腺癌的生存率呈逐渐上升的态势,且与发达国家的差距逐渐缩小[16-17]。北京市和澳门特别行政区作为经济发展较快的地区,其医疗水平、生活条件较好,这可能是其乳腺癌标化死亡率下降率较高的原因。而河南、河北二省作为人口大省,可能是由于我国各地区经济和卫生资源的发展不平衡,其早诊早治体系和乳腺癌的治疗水平等因素与经济发达地区之间存在着差异,导致其标化死亡率相较于其他省份增高明显。
本研究存在局限性。首先,虽然使用了几种建模方法来分析GBD2017中国分省部分数据,但仍有几个省份的低质量数据源可能会影响所产生的估计,导致发病率和死亡率的一些波动。其次,本研究所用数据无法从城乡角度分析女性乳腺癌疾病负担的差异,有研究发现近年来我国农村地区女性乳腺癌死亡率上升趋势明显,且各年龄段死亡率的年度变化百分比均高于城市[18]。另外,根据激素受体和HER2的表达,乳腺癌被分为几个分子亚型[19]。它们的流行病学特征以及危险因素、复发模式和结果都不相同[20-22]。然而,由于缺乏相关的病理数据,目前的研究没有评估按分子亚型或组织学分层的乳腺癌的负担和趋势。最后,目前普遍报告的乳腺癌危险因素还包括月经初潮早、绝经晚、外源性激素摄入等[23],由于收集这些危险因素数据比较困难,故而本研究未进行分析。
总而言之,乳腺癌仍然是世界范围内主要的公共卫生负担,如何制定相应的防治策略和措施,控制乳腺癌的发病及死亡刻不容缓。1990-2017年我国女性乳腺癌的疾病负担逐年加重,因此国家应加强乳腺癌宣传教育和危险因素干预、全面开展筛查工作并不断研发新技术、新药物用于乳腺癌的治疗。
利益冲突 所有作者均声明不存在利益冲突
| [1] |
Ji P, Gong Y, Jin ML, et al. The burden and trends of breast cancer from 1990 to 2017 at the global, regional, and national levels: results from the global burden of disease study 2017[J]. Front Oncol, 2020, 10: 650. DOI:10.3389/fonc.2020.00650 |
| [2] |
陈万青, 郑荣寿. 中国女性乳腺癌发病死亡和生存状况[J]. 中国肿瘤临床, 2015, 43(13): 668-674. Chen WQ, Zheng RS. Incidence, mortality and survival analysis of breast cancer in China[J]. Chin J Clin Oncol, 2015, 43(13): 668-674. DOI:10.3969/j.issn.1000-8179.20150571 |
| [3] |
国家癌症中心. 2018中国肿瘤登记年报[M]. 北京: 人民卫生出版社, 2019. National Cancer Center. China cancer registry annual report 2018[M]. Beijing: People's Medical Publishing House, 2019. |
| [4] |
James SL, Abate D, Abate KH, et al. Global, regional, and national incidence, prevalence, and years lived with disability for 354 diseases and injuries for 195 countries and territories, 1990-2017:A systematic analysis for the Global Burden of Disease Study 2017[J]. Lancet, 2018, 392(10159): 1789-1858. DOI:10.1016/S0140-6736(18)32279-7 |
| [5] |
Roth GA, Abate D, Abate KH, et al. Global, regional, and national age-sex-specific mortality for 282 causes of death in 195 countries and territories, 1980-2017:a systematic analysis for the Global Burden of Disease Study 2017[J]. Lancet, 2018, 392(10159): 1736-1788. DOI:10.1016/S0140-6736(18)32203-7 |
| [6] |
Stanaway JD, Afshin A, Gakidou E, et al. Global, regional, and national comparative risk assessment of 84 behavioural, environmental and occupational, and metabolic risks or clusters of risks for 195 countries and territories, 1990-2017:a systematic analysis for the Global Burden of Disease Study 2017[J]. Lancet, 2018, 392(10159): 1923-1994. DOI:10.1016/S0140-6736(18)32225-6 |
| [7] |
Murray CJ, Lopez AD. On the comparable quantification of health risks: lessons from the Global Burden of Disease Study[J]. Epidemiology, 1999, 10(5): 594-605. DOI:10.1097/00001648-199909000-00017 |
| [8] |
Kyu HH, Abate D, Abate KH, et al. Global, regional, and national disability-adjusted life-years (DALYs) for 359 diseases and injuries and healthy life expectancy (HALE) for 195 countries and territories, 1990-2017:a systematic analysis for the Global Burden of Disease Study 2017[J]. Lancet, 2018, 392(10159): 1859-1922. DOI:10.1016/S0140-6736(18)32335-3 |
| [9] |
Porter P. "Westernizing" women's risks? Breast cancer in lower-income countries[J]. N Engl J Med, 2008(3): 213-216. DOI:10.1056/NEJMp0708307 |
| [10] |
Arnold M, Pandeya N, Byrnes G, et al. Global burden of cancer attributable to high body-mass index in 2012:a population-based study[J]. Lancet Oncol, 2015, 16(1): 36-46. DOI:10.1016/S1470-2045(14)71123-4 |
| [11] |
Waks AG, Winer EP. Breast cancer treatment: a review[J]. JAMA, 2019, 321(3): 288-300. DOI:10.1001/jama.2018.19323 |
| [12] |
王乐, 张玥, 石菊芳, 等. 中国女性乳腺癌疾病负担分析[J]. 中华流行病学杂志, 2016, 37(7): 970-976. Wang L, Zhang Y, Shi JF, et al. Disease burden of famale breast cancer in China[J]. Chin J Epidemiol, 2016, 37(7): 970-976. DOI:10.3760/cma.j.issn.0254-6450.2016.07.013 |
| [13] |
Valencia OM, Samuel SE, Viscusi RK, et al. The role of genetic testing in patients with breast cancer: a review[J]. JAMA Surg, 2017, 152(6): 589-594. DOI:10.1001/jamasurg.2017.0552 |
| [14] |
Dhillon PK, Mathur P, Nandakumar A, et al. The burden of cancers and their variations across the states of India: the Global Burden of Disease Study 1990-2016[J]. Lancet Oncol, 2018, 19(10): 1289-1306. DOI:10.1016/S1470-2045(18)30447-9 |
| [15] |
Ginsburg O, Bray F, Coleman MP, et al. The global burden of women's cancers: a grand challenge in global health[J]. Lancet, 2017, 389(10071): 847-860. DOI:10.1016/S0140-6736(16)31392-7 |
| [16] |
王启俊, 祝伟星, 邢秀梅. 北京城区女性乳腺癌发病死亡和生存情况20年监测分析[J]. 中华肿瘤杂志, 2006, 28(3): 208-210. Wang QJ, Zhu WX, Xing XM. Analysis of the incidence and survival of female breast cancer in Beijing during the last 20 years[J]. Chin J Oncol, 2006, 28(3): 208-210. DOI:10.3760/j.issn:0253-3766.2006.03.012 |
| [17] |
师金, 梁迪, 李道娟, 等. 全球女性乳腺癌流行情况研究[J]. 中国肿瘤, 2017, 26(9): 683-690. Shi J, Liang D, Li DJ, et al. Epidemiological status of global female breast cancer[J]. China Cancer, 2017, 26(9): 683-690. DOI:10.11735/j.issn.1004-0242.2017.09.A006 |
| [18] |
何家赓, 侯建忠, 闫贻忠. 2005-2013年中国肿瘤登记地区女性乳腺癌死亡及疾病负担时间趋势分析[J]. 中华肿瘤防治杂志, 2019, 26(8): 523-528. He JG, Hou JZ, Yan YZ. Analysis on the time trends of female breast cancer death and disease burden in cancer registration areas in China, 2005-2013[J]. Chin J Cancer Prev Treat, 2019, 26(8): 523-528. DOI:10.16073/j.cnki.cjcpt.2019.08.001 |
| [19] |
Perou CM, Sørlie T, Eisen MB, et al. Molecular portraits of human breast tumours[J]. Nature, 2000, 406(6797): 747-752. DOI:10.1038/35021093 |
| [20] |
Panoff JE, Wright JL. Breast cancer subtypes and the risk of local and regional relapse[J]. J Clin Oncol, 2010, 28(10): 1684-1691. DOI:10.1200/JCO.2009.24.9284 |
| [21] |
Kast K, Link T, Friedrich K, et al. Impact of breast cancer subtypes and patterns of metastasis on outcome[J]. Breast Cancer Res Treat, 2015, 150(3): 621-629. DOI:10.1007/s10549-015-3341-3 |
| [22] |
Kennecke H, Yerushalmi R, Woods R, et al. Metastatic behavior of breast cancer subtypes[J]. J Clin Oncol, 2010, 28(20): 3271-3277. DOI:10.1200/JCO.2009.25.9820 |
| [23] |
Bray F, Ferlay J, Soerjomataram I, et al. Global cancer statistics 2018:GLOBOCAN estimates of incidence and mortality worldwide for 36 cancers in 185 countries[J]. CA Cancer J Clin, 2018, 68(6): 394-424. DOI:10.3322/caac.21492 |