 2021, Vol. 42
文章信息
- 宋逸, 闫晓晋, 张京舒, 马宁, 刘云飞, 胡佩瑾, 马军.
- Song Yi, Yan Xiaojin, Zhang Jingshu, Ma Ning, Liu Yunfei, Hu Peijin, Ma Jun
- 1985-2014年中国汉族18岁青少年身高长期趋势的性别差异变化
- Gender difference in secular trends of body height in Chinese Han adolescents aged 18 years, 1985-2014
- 中华流行病学杂志, 2021, 42(5): 801-806
- Chinese Journal of Epidemiology, 2021, 42(5): 801-806
- http://dx.doi.org/10.3760/cma.j.cn112338-20200804-01014
-
文章历史
收稿日期: 2020-08-04


生长长期趋势是自19世纪以来人类生长发育进程中最重要生物学现象之一。其中成年身高的变化是生长长期趋势中最清晰可见的表现之一,它受短期不良环境因素影响小,最能够反映人群的遗传生长潜力,与成年后的体质、健康密切相关,有重要的研究价值[1]。过去的一个世纪里,全球成年身高发生了很大变化,而且变化不均衡,长期趋势几乎在所有发达国家及越来越多的发展中国家已经出现或正在出现,人的身材一代比一代高大[2-3]。既往中国对青少年身高的研究多关注不同群体是否出现生长长期趋势及其表现模式,很少研究青少年身高发育长期趋势的性别差异,以及这种差异在不同地区随时间的变化。本研究利用1985-2014年全国学生体质与健康调研的长期数据,对18岁青少年身高,即近似成年身高长期趋势的性别差异进行研究,为了解成年身高发育性别差异的长期变化特点,更好地促进青少年生长潜力发挥提供科学依据。
资料与方法1. 资料来源:来源于1985、1995、2000、2005、2010和2014年6次全国学生体质与健康调研,调研使用分层随机整群的抽样方法,抽取全国30个省、自治区、直辖市(不包括西藏自治区)汉族7~18岁儿童青少年。其中,1985年无海南省数据,1995年无青海省数据,1985和1995年无重庆市数据。调研地区按社会经济水平分为“好”“中”“差”3个片区,社会经济水平由5个指标(当地GDP、人均年收入、粮食消费指数、人口自然增长率和当地社会福利指数)进行综合判定。片内采用分层整群抽样方法,分城、乡抽取学校(基本沿用1985年以来的调研点校),以年级分层,以教学班为单位随机整群抽取儿童青少年。本研究选择性别、城乡、省份、身高、体重数据完整的汉族18岁青少年共计124 099人,排除有以下情况之一者:①心、肺、肝、肾等重要脏器疾病(如心脏病、高血压、肺结核、肝炎、肾炎等);②身体发育异常(如侏儒症、巨人症);③身体残缺、畸形者,如严重脊柱侧弯、鸡胸、跛足、明显的O型腿和X型腿等;④急性病患者,或最近一个月内曾患高热、腹泻等急性疾病而体力尚未恢复者。6次调研均采用统一调查方案和抽样框架,除1985年样本量是其他年度的2倍外,各省份、城乡、性别和年龄组青少年在各年度的样本量基本一致,具体抽样方案见6次全国学生体质与调研报告[4-9]。
2. 调查内容与方法:调查方法按照历年《全国学生体质与健康调研实施细则》的统一方案进行,调查对象民族以户口簿为准,年龄按形态检测当日的实足年龄记录。所有检测人员必须接受统一的岗前培训,熟练掌握检测方法,经过专家组考核合格后方能上岗。1985-2014年,身高测试方法保持一致,采用机械式身高坐高计测量,使用前按统一方法进行校正和检查,读数时检测人员双眼与水平压板平面等高,精确到0.1 cm。体重采用电子体重计或杠杆秤,使用前按统一方法进行检查和校正,精确到0.1 kg。为进行质量控制,测试期间每天按3%比例随机抽取复测对象,对形态指标进行复测。
根据测量的身高、体重数据计算BMI=体重(kg)/身高(m)2。BMI < 18.5 kg/m2判定为营养不良,18.5 kg/m2≤BMI < 24.0 kg/m2判定为体重正常,24.0 kg/m2≤BMI < 28.0 kg/m2判定为超重,BMI > 28.0 kg/m2判定为肥胖[10-11]。按照国家统计局分类办法将30个省、自治区、直辖市分为东、中、西部和东北地区[12]。东部地区包括北京、天津、河北、上海、江苏、浙江、福建、山东、广东和海南;中部地区包括山西、安徽、江西、河南、湖北和湖南;西部地区包括内蒙古、广西、重庆、四川、贵州、云南、西藏、陕西、甘肃、青海、宁夏和新疆;东北地区包括辽宁、吉林和黑龙江。
3. 统计学分析:利用SPSS 20.0和Stata 12.0软件进行数据整理及分析。删除极端值(指身高超过同年龄、同性别身高x±5s)及不符合逻辑的35个个案,最终纳入分析的样本量为124 099人。身高、体重、BMI等计量资料数据采用x±s表示,计数资料采用百分比(%)表示。采用χ2检验进行率的比较,应用Bonferroni法调整校验水准,即α’=α/[k(k-1)/2],k为样本组。采用ANOVA进行均值比较。采用分位数回归模型,将年度变量按照10年幅度进行编码,以身高为因变量,将性别、年度纳入模型1,在模型中控制城乡、社会经济水平、营养状况后,得到性别分层下身高10年变化情况;然后以性别和年度的乘积为自变量纳入模型2,在模型中控制城乡、社会经济水平、营养状况后,得到身高性别差值的10年变化情况,并进一步在不同地区分层下,在模型中控制城乡、社会经济水平、营养状况后,分析不同身高水平与性别关系随时间的变化。以P < 0.05为差异有统计学意义。
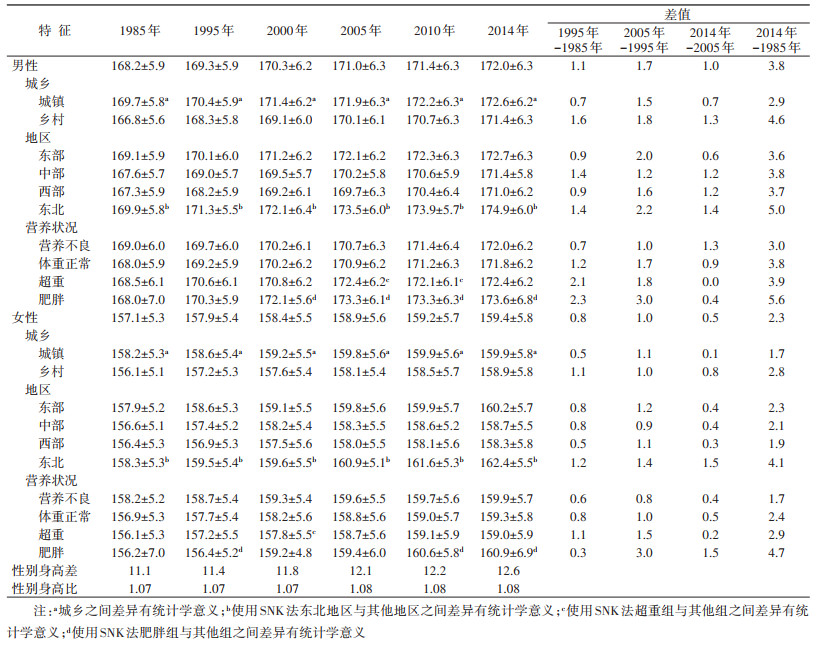
结果1. 一般情况:1985-2014年,共纳入研究样本124 099人,其中1985年33 443人,1995年17 093人,2000年18 242人,2005年20 306人,2010年17 888人,2014年17 127人。各年度调查中,样本的城乡、性别比例均近似50%,分布均匀,地区构成略有波动。从总体来看,近30年来,18岁青少年身体形态发育水平明显提高,平均身高、体重随年度增加而不断增长,但随着BMI水平的增长,超重肥胖青少年的比例也在不断增加(表 1)。

2. 身高趋势的性别差异:从1985-2014年,中国18岁男性青少年平均身高以1.3 cm/10年的速度增长,女性青少年增长速度为0.8 cm/10年,无论男女,身高增长速度最快的阶段均为1995-2005年。男性青少年各亚组平均身高均高于女性,差异有统计学意义(P < 0.05),性别身高差一直在扩大,从1985年的11.1 cm上升到2014年的12.6 cm,性别身高比稳定在1.07~1.08之间。无论男女,城市青少年平均身高都高于乡村青少年(P < 0.05),青少年平均身高东北地区 > 东部地区 > 中部地区 > 西部地区,且东北地区与其他地区之间差异有统计学意义(P < 0.05)。在1985年,不同营养状况青少年身高之间差异无统计学意义,2000年后,男性肥胖青少年平均身高高于其他群体,2010年后,女性肥胖青少年平均身高高于其他群体,在个别年度,男性超重青少年平均身高低于肥胖青少年组,但高于体重正常和营养不良组,女性超重青少年平均身高低于肥胖青少年、体重正常和营养不良组(P < 0.05,表 2)。
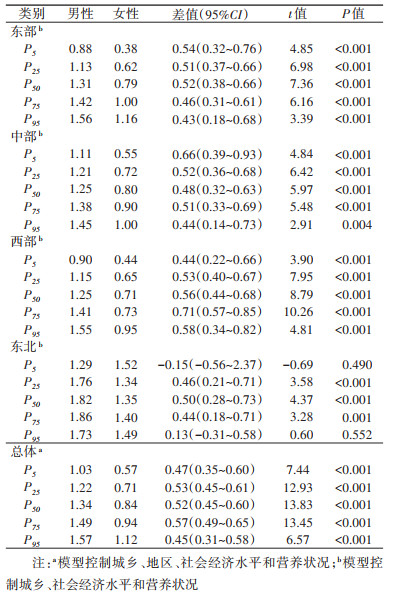
3. 1985-2014年中国18岁青少年身高趋势性别差异的分位数回归分析:在控制了城乡、地区、社会经济水平和营养状况的影响后,18岁男女性青少年身高在P5、P25、P50、P75和P95都有随时间增长的趋势,且有随百分位点增加身高增长幅度增加的趋势,不同百分位点身高的性别差值在0.45 cm/10年~0.57 cm/10年之间,其中男性青少年身高P50每10年变化幅度为1.34 cm,女性青少年为0.84 cm,性别之间差值为0.52 cm/10年,差异有统计学意义(P < 0.001)。地区分层分析结果显示,各地区男女性青少年身高在P5、P25、P50、P75和P95都有随时间增长的趋势,其中东北地区男女性青少年身高增长幅度最大。除东北地区身高P5和P95的男女青少年性别差异无统计学意义(P > 0.05)外,东北地区其他百分位点和其他地区各百分位点身高增长幅度的性别差异均有统计学意义(P < 0.01),性别差值范围为0.43 cm/10年~0.71 cm/10年之间(表 3)。
2020年,Lancet发布的全球儿童青少年身高趋势研究显示,1985-2019年,中国18岁男性青少年身高增长8.1 cm,增量全球第一,女性青少年身高增长6.1 cm,增量全球第三[13]。本研究结果显示,中国18岁男女青少年各百分位点身高水平都在增长,总体而言,男性在各百分位点身高增长幅度均高于女性,无论男女,各年度城市青少年平均身高均高于乡村青少年,该结果与1982-2012年中国居民营养与健康状况监测7~17岁儿童身高发育的结果一致[14]。本研究结果还显示,乡村男性青少年身高增幅高于城市男性青少年,女性中这一现象不明显,这从侧面支持了当社会经济发展和环境改善削弱了身高发育的阻碍因素后,男性青少年身高获益幅度高于女性[2, 15]。然而,该结果与瑞士和瑞典对成年人口男女性身高的研究结果不同,这两项研究未发现男性身高比女性对环境因素更为敏感[16-17]。
总体而言,中国18岁青少年身高各百分位点的性别差异都维持在较为稳定的水平。地区分层研究发现,无论男女,就平均身高水平的增长速度而言,东北地区青少年最高,东部地区次之,中部和西部地区青少年最慢,但各地区身高平均增长的性别差异都维持在较为稳定的水平。这提示我们,中西部地区青少年身高发育还有潜力,可能在经济进一步发展后,其身高还会进一步增长。因为许多国家的证据表明,社会经济发展与儿童青少年生长发育水平密切相关,中国也不例外[3, 18-20]。此外,最新一项对152个国家的生态学研究发现,膳食模式比GDP对成年身高的影响可能更为重要,乳制品、猪肉、鸡蛋、牛肉和土豆类饮食与身高呈高度正相关,而谷物和豆类与身高呈负相关[21]。考虑到中国不同地区饮食文化的巨大差异,这为不同地区青少年成年身高发展的不平衡提供了一种解释,也为未来中西部地区青少年身高干预提供了一个思路。
虽然环境敏感性在生长发育期是否存在性别差异尚未达成共识,但已有研究表明男性对环境因素更为敏感[22]。本研究结果也显示,1985- 2014年,在中国经济高速发展的这一时期,18岁青少年身高的性别差异也在扩大,从1985年的11.1 cm增加到2014年的12.6 cm,这一身高性别差值高于Bogin等[18]在2016年汇总的169个国家成年身高的性别差值(11.8 cm),也高于2016年中国4个省份(上海、四川、福建、山西)18岁青少年身高的性别差值(11.7 cm)和同期在日本福冈、大阪、和歌山县以及埼玉县调查的18岁青少年身高的性别差值(11.1 cm)[23],与西班牙1965-1969年、1970-1975年和1975-1979年出生队列的成年人群性别身高差值近似(12.4~12.7 cm)[24],也与1985-2014年日本文部省进行的日本学校保健统计调查中17岁青少年身高性别差值近似(12.4~12.8 cm)[25],且身高性别比范围也与之一致,但与西班牙研究不同的是,日本17岁青少年身高在近30年增长幅度较小。身高的性别差异扩大是正向性生长长期趋势的重要表现,在西欧、北美等地区的长期趋势证实:生长长期趋势增速越大,持续时间越长,男女间的成年性别差异越大[26]。其机制可能在于由遗传基因决定的生长潜力存在性别差异,在身高发育过程中,营养、疾病负担和工作负荷不良的条件下,男性身高发育受到的负面影响要大于女性[22, 25]。即如果没有额外的干预,身高的性别差异会在不良的条件下缩小,在有利的条件下增加。
既往研究表明,营养不良或患有严重疾病的儿童青少年,一般成年身高较矮[2]。但本研究中,营养不良青少年的成年身高未低于体重正常者,而肥胖青少年的成年身高较高。一项在以色列进行的长达50年(1967-2015年)对17岁青少年身高的研究也表明,肥胖男性比正常体重和体重不足男性身高要高[27]。这说明在青少年人口中,肥胖可能没有限制身高潜力的发挥。
本研究基于全国性数据,研究时间跨度较长,样本规模较大,能较全面地反映中国青少年成年身高的趋势变化和性别差异,为充分发挥儿童青少年生长发育潜力提供依据。但因为本研究是横断面研究,不是队列研究,未获得18岁青少年在其儿童早期的身高和体重资料,无法判断早期营养状况的暴露和青春期增速等对成年身高的影响,而18岁时的营养状况可能与早年营养状况不一致,因此对成年身高的解释有限,且未收集其青春期生活方式和身体活动的因素,但这些因素不会影响本研究对成年身高长期趋势性别差异变化的结果。未来的研究可以考虑在队列研究设计的基础上收集上述因素,以及经济、膳食模式、疾病负担等影响身高发育的因素。
利益冲突 所有作者均声明不存在利益冲突
| [1] |
Cole TJ. The secular trend in human physical growth: a biological view[J]. Econ Hum Biol, 2003, 1(2): 161-168. DOI:10.1016/S1570-677X(02)00033-3 |
| [2] |
NCD Risk Factor Collaboration (NCD-RisC). A century of trends in adult human height[J]. eLife, 2016, 5: e13410. DOI:10.7554/eLife.13410 |
| [3] |
Schwekendiek D, Baten J. Height development of men and women from China, South Korea, and Taiwan during the rapid economic transformation period of the 1960s-1980s[J]. Econ Hum Biol, 2019, 34: 169-180. DOI:10.1016/j.ehb.2019.04.005 |
| [4] |
中国学生体质与健康调研组. 1985年中国学生体质与健康研究[M]. 北京: 人民教育出版社, 1987: 4-6. CNSSCH Association. Report on the 1985th national survey on students' constitution and health[M]. Beijing: People's Educational Publication, 1987: 4-6. |
| [5] |
中华人民共和国国家教育委员会, 等. 中国学生体质与健康调研报告-1995年[M]. 长春: 吉林科学技术出版社, 1996: 3-4. National Education Commission of the People's Republic of China and other Research Groups of Chinese Students' Physique and Health. Report on the physical fitness and health surveillance of Chinese school students[M]. Changchun: Jilin Technical and Science Publication, 1996: 3-4. |
| [6] |
中国学生体质与健康研究组. 2000年中国学生体质与健康调研报告[M]. 北京: 高等教育出版社, 2002: 3-4. CNSSCH Association. Report on the physical fitness and health surveillance of Chinese school students in 2000[M]. Beijing: Higher Education Press, 2002: 3-4. |
| [7] |
中国学生体质与健康调研组. 2005年中国学生体质与健康调研报告[M]. 北京: 高等教育出版社, 2007: 8-9. CNSSCH Association. Report on the physical fitness and health surveillance of Chinese school students in 2005[M]. Beijing: Higher Education Press, 2007: 8-9. |
| [8] |
中国学生体质与健康研究组. 2010年中国学生体质与健康调研报告[M]. 北京: 高等教育出版社, 2012: 4-5. CNSSCH Association. Reports on the physical fitness and health research of Chinese school students in 2010[M]. Beijing: Higher Education Press, 2012: 4-5. |
| [9] |
中国学生体质与健康研究组. 2014年中国学生体质与健康调研报告[M]. 北京: 高等教育出版社, 2016: 4-5. CNSSCH Association. Reports on the physical fitness and health research of Chinese school students in 2014[M]. Beijing: Higher Education Press, 2016: 4-5. |
| [10] |
Cole TJ, Lobstein T. Extended international (IOTF) body mass index cut-offs for thinness, overweight and obesity[J]. Pediatr Obes, 2012, 7(4): 284-294. DOI:10.1111/j.2047-6310.2012.00064.x |
| [11] |
国家卫生和计划生育委员会. WS/T 586-2018学龄儿童青少年超重与肥胖筛查[S]. 北京: 中国标准出版社, 2018. National Health and Family Planning Commission of the People's Republic of China. WS/T 586-2018 Screening for overweight and obesity among school-age children and adolescents[S]. Beijing: China Standard Press, 2018. |
| [12] |
中华人民共和国国家统计局. 东西中部和东北地区划分方法[EB/OL]. (2011-06-13)[2020-07-01]. http://www.stats.gov.cn/ztjc/zthd/sjtjr/dejtjkfr/tjkp/201106/t20110613_71947.htm. National Bureau of Statistics of the People's Republic of China. Division of east, west, central and northeast regions[EB/OL]. (2011-06-13)[2020-07-01]. http://www.stats.gov.cn/ztjc/zthd/sjtjr/dejtjkfr/tjkp/201106/t20110613_71947.htm. |
| [13] |
NCD Risk Factor Collaboration (NCD-RisC). Height and body-mass index trajectories of school-aged children and adolescents from 1985 to 2019 in 200 countries and territories: a pooled analysis of 2181 population-based studies with 65 million participants[J]. Lancet, 2020, 396(10261): 1511-1524. DOI:10.1016/S0140-6736(20)31859-6 |
| [14] |
王璐璐, 曹薇, 潘慧, 等. 1982-2012年中国7~17岁儿童体格发育变化趋势分析[J]. 中华预防医学杂志, 2020, 54(5): 572-576. Wang LL, Cao W, Pan H, et al. Analysis on the trend of physical development of children aged 7-17 years old in China from 1982 to 2012[J]. Chin J Prev Med, 2020, 54(5): 572-576. DOI:10.3760/cma.j.cn112150-20200211-00088 |
| [15] |
Cavelaars AEJM, Kunst AE, Geurts JJM, et al. Persistent variations in average height between countries and between socio-economic groups: an overview of 10 European countries[J]. Ann Hum Biol, 2000, 27(4): 407-421. DOI:10.1080/03014460050044883 |
| [16] |
Koepke N, Floris J, Pfister C, et al. Ladies first: Female and male adult height in Switzerland, 1770-1930[J]. Econ Hum Biol, 2018, 29: 76-87. DOI:10.1016/j.ehb.2018.02.002 |
| [17] |
Gustafsson A, Werdelin L, Tullberg BS, et al. Stature and sexual stature dimorphism in Sweden, from the 10th to the end of the 20th century[J]. Am J Hum Biol, 2007, 19(6): 861-870. DOI:10.1002/ajhb.20657 |
| [18] |
Bogin B, Scheffler C, Hermanussen M. Global effects of income and income inequality on adult height and sexual dimorphism in height[J]. Am J Hum Biol, 2017, 29(2): e13410. DOI:10.1002/ajhb.22980 |
| [19] |
Mumm R, Czernitzki AF, Bents D, et al. Socioeconomic situation and growth in infants and juveniles[J]. Anthropol Anz, 2017, 74(2): 101-107. DOI:10.1127/anthranz/2017/0706 |
| [20] |
罗冬梅, 闫晓晋, 雷园婷, 等. 中国7~18岁汉族学生生长迟缓的城乡差异及与地区经济发展的关联分析[J]. 中华预防医学杂志, 2019, 53(10): 1038-1042. Luo DM, Yan XJ, Lei YT, et al. Analysis on the urban-rural disparity of childhood stunting and its association with economic growth among Chinese Han students aged 7-18 years old[J]. Chin J Prev Med, 2019, 53(10): 1038-1042. DOI:10.3760/cma.j.issn.0253-9624.2019.10.016 |
| [21] |
Grasgruber P, Hrazdíra E. Nutritional and socio-economic predictors of adult height in 152 world populations[J]. Econ Hum Biol, 2020, 37: 100848. DOI:10.1016/j.ehb.2020.100848 |
| [22] |
Sohn K. Sexual stature dimorphism as an indicator of living standards?[J]. Ann Hum Biol, 2016, 43(6): 537-541. DOI:10.3109/03014460.2015.1115125 |
| [23] |
袁翔, 尹小俭, 张婷, 等. 中国日本儿童青少年身高体重发育状况比较[J]. 中国学校卫生, 2019, 40(11): 1611-1615. Yuan X, Yin XJ, Zhang T, et al. Comparative analysis of physique between Chinese and Japanese children and adolescents[J]. Chin J School Health, 2019, 40(11): 1611-1615. DOI:10.16835/j.cnki.1000-9817.2019.11.004 |
| [24] |
Cámara AD. A biosocial approach to living conditions: inter-generational changes of stature dimorphism in 20th-century Spain[J]. Ann Hum Biol, 2015, 42(2): 167-177. DOI:10.3109/03014460.2014.911349 |
| [25] |
日本文部科学省. 学校保健统计调查[EB/OL].[2020-08-22]. https://www.e-stat.go.jp/stat-search/files?page=1&toukei=00400002&tstat=000001011648. Ministry of Education, Culture, Sports, Science and Technology of Japan. School health statistics survey[EB/OL].[2020-08-22]. https://www.e-stat.go.jp/stat-search/files?page=1&toukei=00400002&tstat=000001011648. |
| [26] |
季成叶. 现代儿童少年卫生学[M]. 2版. 北京: 人民卫生出版社, 2010: 206. Ji CY. Modern child and adolescent health[M]. 2nd ed. Beijing: People's Medical Publishing House, 2010: 206. |
| [27] |
Geva N, Pinhas-Hamiel O, Reichman B, et al. The association between obesity and secular trend of stature: a nationwide study of 2.8 million adolescents over five decades[J]. Int J Obes (Lond), 2019, 43(10): 1932-1939. DOI:10.1038/s41366-019-0371-7 |