 2018, Vol. 39
文章信息
- 杨静, 殷鹏, 曾新颖, 由金玲, 赵艳芳, 王卓群, 周脉耕.
- Yang Jing, Yin Peng, Zeng Xinying, You Jinling, Zhao Yanfang, Wang Zhuoqun, Zhou Maigeng.
- 2006-2016年中国室外空气污染的归因死亡分析
- Deaths attributed to ambient air pollution in China between 2006 and 2016
- 中华流行病学杂志, 2018, 39(11): 1449-1453
- Chinese Journal of Epidemiology, 2018, 39(11): 1449-1453
- http://dx.doi.org/10.3760/cma.j.issn.0254-6450.2018.11.006
-
文章历史
收稿日期: 2018-06-07


2. 100050 北京, 中国疾病预防控制中心慢性非传染性疾病预防控制中心生命登记与死因监测室;
3. 100050 北京, 中国疾病预防控制中心慢性非传染性疾病预防控制中心
2. Division of Vital Registry and Mortality Surveillance, National Center for Chronic and Non-communicable Disease Control and Prevention, Chinese Center for Disease Control and Prevention, Beijing 100050, China;
3. National Center for Chronic and Non-communicable Disease Control and Prevention, Chinese Center for Disease Control and Prevention, Beijing 100050, China
国内外大量研究显示,室外空气污染物能对人体产生广泛的健康危害[1-5]。2016年全球疾病负担研究(Global Burden of Disease Study 2016,GBD2016)显示[6],室外空气污染导致全球409.3万例死亡,损失1.06亿人年的伤残调整寿命年,是影响人群健康的第六位危险因素。过去三十几年,中国经济快速发展,大规模的工业化发展、大量以煤炭为主的能源消耗和机动车的增加,导致空气污染物排放增加[7]。本研究对室外空气污染对我国造成的死亡情况进行分析。
资料与方法1.资料来源:数据均来自GBD2016对中国疾病负担的估计,包括全国和33个省份。
2.研究方法:GBD遵循统一的方法来估计室外空气污染对中国及各省份的疾病负担。主要包括5个步骤:①估计室外空气质量:提取室外空气动力学直径<2.5 μm的颗粒物(particulate matter smaller than 2.5 μm in aerodynamic diameter,PM2.5)的年平均质量浓度数据,来源包括大气气溶胶的卫星观察数据、地面测量数据、化学迁移模型模拟(chemical transport model simulations)以及人口和土地使用等数据,采用了空气质量数据集成模型(Data Integration Model for Air Quality)估计网格化的PM2.5暴露水平,见文献[6, 8]。②确定危险因素的健康结局:室外空气污染的健康结局包括冠心病、脑卒中、肺癌、COPD和下呼吸道感染所致的死亡。③估计RR值:GBD利用现有关于PM2.5暴露水平与疾病死亡风险关系的数据,通过综合暴露反应(Integrated Exposure Response)函数填补现有数据的空白[9],估计不同暴露水平下室外空气污染对不同健康结局的RR值。④确定理论最小风险暴露水平:GBD根据现有研究确定了室外空气污染的理论最小风险暴露水平为2.4~5.9 μg/m3。⑤计算归因死亡:在计算危险因素的人群归因分值(population attributable fraction,PAF)的基础上,计算归因于室外空气污染的死亡数、死亡率及年龄标化率等指标。具体研究方法见文献[6, 10]。
3.主要指标:①PAF:表示在某一人群中,如果某危险因素的暴露降低到理论最小暴露水平,该人群中相关疾病或死亡能降低的比例。具体计算方法见文献[6]。②归因死亡数、归因死亡率和年龄标化归因死亡率:根据PAF,可以计算出在某一人群中,某疾病的总死亡中归因于某危险因素的死亡数;根据归因死亡数和人口数可计算出归因死亡率;GBD采用世界标准人口的年龄结构计算年龄标化率[10]。③PAF和归因死亡率的变化百分比:描述了某指标在2016年的指标值与2006年相比的变化百分比,均使用年龄标化值进行计算。
结果1.一般情况:2016年中国因室外空气污染导致107.5万例死亡,占总死亡的11.1%;与2006年相比,室外空气污染所致的总死亡数没有明显变化,占总死亡的比例下降了6.8%,年龄标化归因死亡率下降了26.5%,见表 1。
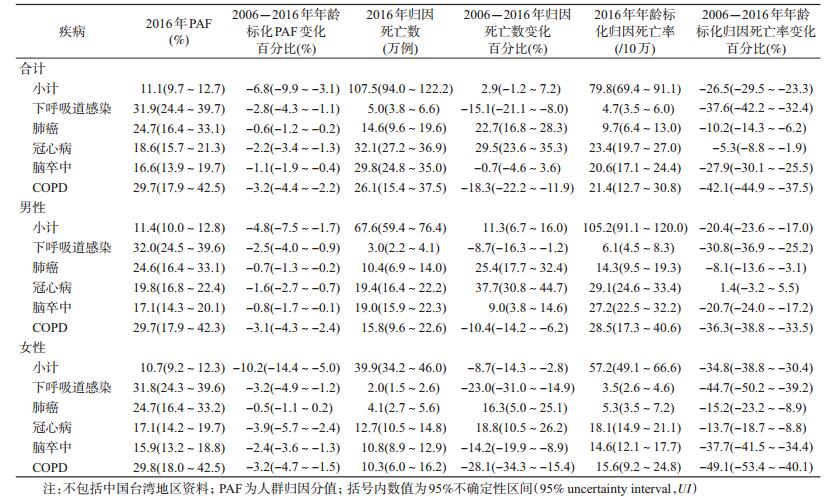
2.分病种的归因疾病负担:2016年,有近1/3的下呼吸道感染死亡是由于室外空气污染导致,而只有近1/5的冠心病和脑卒中死亡是由于室外空气污染导致。在室外空气污染造成的死亡中,冠心病和脑卒中的占比超过一半(57.6%);与2006年比较,所有相关疾病的年龄标化归因死亡率均有所下降,其中冠心病的下降幅度最小,较2006年下降5.3%,下呼吸道感染和COPD的下降幅度较大,较2006年分别下降37.6%、42.1%,见表 1。
3.分性别的归因疾病负担:2016年,室外空气污染造成的归因疾病负担,男性的归因死亡数是女性的1.7倍;与2006年比较,男性的归因死亡数增长11.3%,女性则下降8.7%,二者的年龄标化归因死亡率均下降,女性下降幅度高于男性,女性下降34.8%,男性下降20.4%;分病种看,女性的每一种疾病的归因死亡率均下降,男性除冠心病以外,其他疾病的归因死亡率均下降,见表 1。
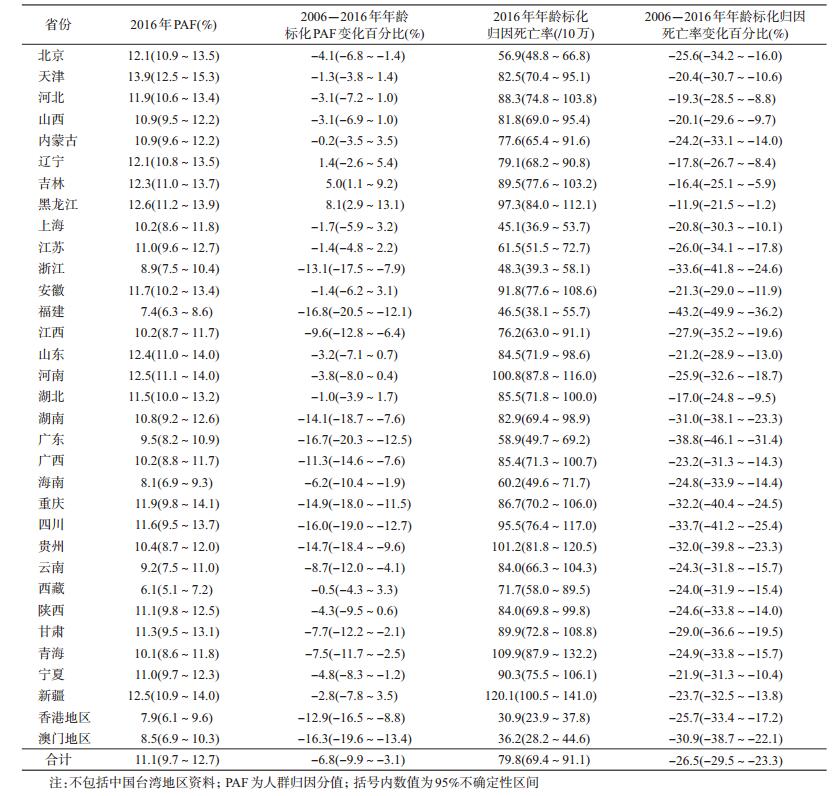
4.分省份的归因疾病负担:①PAF:2016年室外空气污染造成的PAF,天津最高(13.9%),西藏最低(6.1%),其次,京津冀地区、山东、河南、东北三省、重庆和新疆等地相对较高,香港地区、澳门地区、福建、海南等地相对较低,见图 1;与2006年相比,17个省份的PAF下降,下降幅度从-4.1%~-16.8%,吉林、黑龙江的PAF值略有增加(5.0%、8.1%)。其余14个省份没有明显变化,见表 2。②年龄标化归因死亡率,新疆的标化归因死亡率最高(120.1/10万),香港地区最低(30.9/10万),此外,青海、贵州、河南、黑龙江、四川、安徽、宁夏、甘肃等地相对较高,澳门地区、上海、福建、浙江、北京等地相对较低,见图 1;与2006年相比,所有省份的年龄标化归因死亡率均下降,下降幅度从-11.9%(黑龙江)到-43.2%(福建),广东、浙江、贵州、湖南、四川、重庆和甘肃等地下降幅度相对较高,东北三省、湖北、河北、山西等地下降幅度相对较低,见表 2。

|
| 图 1 2016年中国各省份室外空气污染PAF和年龄标化归因死亡率 |
2016年,室外空气污染(PM2.5)给中国带来了巨大的疾病负担,全球由于室外空气污染导致的死亡中,超过1/4发生在中国,是影响中国人群健康的第3位危险因素[11]。室外空气污染导致的疾病负担主要来自心脑血管疾病、COPD和肺癌,虽然下呼吸道感染与室外空气污染关系最密切,但是由于下呼吸道感染死亡率已大幅下降,心脑血管疾病等慢性病成为影响人群健康的主要疾病,室外空气污染导致的死亡主要体现在慢性病。
不同省份间的室外空气污染疾病负担存在差异,这主要与各地室外空气污染水平和相关疾病死亡水平有关。通过PAF可以看出各地室外空气污染暴露上的差异,京津冀地区、东北三省以及山东、河南和新疆等地的PAF较高,反映了较高的空气污染水平;从年龄标化归因死亡率来看,新疆、青海等西部地区,以及河南、黑龙江、安徽等地相对较高,而北京的年龄标化归因死亡率相对较低,这是因为北京虽然空气污染水平较高,但是其心脑血管疾病和COPD等疾病的死亡率相对较低[12],因此,尽管北京的PAF较高,但归因疾病负担并非处于较高水平。
虽然2016年室外空气污染导致的疾病负担巨大,但是与2006年相比有所下降。原因主要有两个方面,一方面是室外空气污染状况改善,大约一半的省份室外空气污染归因分值有所下降。中国政府近年来加大空气污染治理力度,2012年发布新的《环境空气质量标准》,把PM2.5列入空气污染监测和治理范围,之后发布了《节能减排“十二五”规划》、《大气污染防治行动计划》,2015年8月修订通过《中华人民共和国大气污染防治法》,并对污染最重的京津冀地区采取了重点干预措施,从环保部发布的信息来看,全国环境空气质量总体上有所改善,但是北方地区冬季污染依然较重(特别是进入采暖期后)[13];另一方面,医疗状况的改善和进步减少了相关疾病的死亡,中国COPD年龄标化死亡率与2006年相比下降了40.2%、脑卒中下降了27.0%[14]。分地区看,东北三省的空气污染问题值得关注,这3个省份的室外空气污染PAF较高,并且吉林和黑龙江两省的归因分值与2006年相比有所上升,同时,这3个省份的年龄标化归因死亡率也较高,下降幅度相对较低,提示东北三省可能在空气污染治理与卫生服务等方面与其他地区存在差距,需进一步关注。本研究充分利用现有各类数据,通过适宜的模型进行估计,可以保证不同地区、不同年份之间研究结果的可比性,对于评价不同地区不同人群由于空气污染造成的健康危害,制定有针对性的政策具有重要的意义。
本研究存在局限性。如空气污染数据的收集,在夜晚或者多云天气里,无法通过卫星观察来收集数据,而一些地区的地面监测点数量又十分有限,导致模型估计数据的不确定区间较大,未来需要各地加强空气污染的监测,提高数据的准确度,并建立中国的疾病负担研究体系。
利益冲突 无
| [1] |
The United States EPA. Integrated Science Assessment (ISA) for particulate matter (Final Report, Dec 2009)[R/OL]. EPA/600/R-08/139F. Washington, D.C.: U.S. Environmental Protection Agency. (2009-12-15)[2018-05-07]. https://www.epa.gov/isa.
|
| [2] |
The United States EPA. Integrated Science Assessment (ISA) for sulfur oxides-health criteria (Final)[R/OL]. EPA/600/R-17/451. Washington, D.C.: U.S. Environmental Protection Agency. (2017-12-14)[2018-05-07]. https://www.epa.gov/isa.
|
| [3] |
Romieu I, Samet JM, Smith KR, et al. Outdoor air pollution and acute respiratory infections among children in developing countries[J]. J Occup Environ Med, 2002, 44(7): 640-649. DOI:10.1097/00043764-200207000-00010 |
| [4] |
Huang YT, Al-Hegelan M. Adverse effects of outdoor air pollution[J]. Clin Pulm Med, 2012, 19(1): 14-20. DOI:10.1097/CPM.0b013e318240524b |
| [5] |
Liu Q, Xu C, Ji GX, et al. Effect of exposure to ambient PM2.5 pollution on the risk of respiratory tract diseases:a Meta-analysis of cohort studies[J]. J Biomed Res, 2017, 31(2): 130-142. DOI:10.7555/JBR.31.20160071 |
| [6] |
GBD 2016 Risk Factors Collaborators. Global, regional, and national comparative risk assessment of 84 behavioural, environmental and occupational, and metabolic risks or clusters of risks, 1990-2016:a systematic analysis for the Global Burden of Disease Study 2016[J]. Lancet, 2017, 390(10100): 1345-1422. DOI:10.1016/S0140-6736(17)32366-8 |
| [7] |
Chen Z, Wang JN, Ma GX, et al. China tackles the health effects of air pollution[J]. Lancet, 2013, 382(9909): 1959-1960. DOI:10.1016/S0140-6736(13)62064-4 |
| [8] |
Shaddick G, Thomas ML, Jobling A, et al. Data integration model for air quality:a hierarchical approach to the global estimation of exposures to ambient air pollution[J]. J Royal Stat Soc Ser C, 2018, 67(1): 231-253. DOI:10.1111/rssc.12227 |
| [9] |
GBD 2015 Risk Factors Collaborators. Global, regional, and national comparative risk assessment of 79 behavioural, environmental and occupational, and metabolic risks or clusters of risks, 1990-2015:a systematic analysis for the Global Burden of Disease Study 2015[J]. Lancet, 2016, 388(10053): 1659-1724. DOI:10.1016/S0140-6736(16)31679-8 |
| [10] |
GBD 2016 Causes of Death Collaborators. Global, regional, and national age-sex specific mortality for 264 causes of death, 1980-2016:a systematic analysis for the Global Burden of Disease Study 2016[J]. Lancet, 2017, 390(10100): 1151-1210. DOI:10.1016/S0140-6736(17)32152-9 |
| [11] |
Institute for Health Metrics and Evaluation (IHME). GBD compare data visualization[EB/OL]. Seattle, WA: IHME, University of Washington. (2016)[2018-06-04]. http://vizhub.healthdata.org/gbd-compare.
|
| [12] |
Zhou MG, Wang HD, Zhu J, et al. Cause-specific mortality for 240 causes in China during 1990-2013:a systematic subnational analysis for the Global Burden of Disease Study 2013[J]. Lancet, 2016, 387(10015): 251-272. DOI:10.1016/S0140-6736(15)00551-6 |
| [13] |
环境保护部. 2016年全国空气质量状况[EB/OL]. (2017-01-23)[2018-06-01]. http://www.mep.gov.cn/xxgk/hjyw/201701/t20170123_395142.shtml. The Ministry of Environmental Protection. National air quality status in 2016[EB/OL]. (2017-01-23)[2018-06-01]. http://www.mep.gov.cn/xxgk/hjyw/201701/t20170123_395142.shtml. |
| [14] |
Global Burden of Disease Collaborative Network. Global Burden of Disease Study 2016(GBD 2016) Results. Seattle, United States: Institute for Health Metrics and Evaluation (IHME)[EB/OL]. (2017)[2018-06-04]. http://ghdx.healthdata.org/gbd-results-tool.
|