 2017, Vol. 38
文章信息
- 王鲁茜, 阳波, 闫梅英, 唐雅清, 刘重程, 王瑞琴, 李飒, 马琳, 阚飙.
- Wang Luxi, Yang Bo, Yan Meiying, Tang Yaqing, Liu Zhongcheng, Wang Ruiqin, Li Sa, Ma Lin, Kan Biao.
- 中国西南3省(自治区)伤寒/副伤寒流行的时空聚集性特征及变迁研究
- Spatial and temporal clustering characteristics of typhoid and paratyphoid fever and its change pattern in 3 provinces in southwestern China, 2001-2012
- 中华流行病学杂志, 2017, 38(11): 1504-1508
- Chinese Journal of Epidemiology, 2017, 38(11): 1504-1508
- http://dx.doi.org/10.3760/cma.j.issn.0254-6450.2017.11.013
-
文章历史
收稿日期: 2017-05-15


2. 102206 北京, 中国疾病预防控制中心传染病预防控制所传染病预防控制国家重点实验室
2. State Key Laboratory for Communicable Disease Prevention and Control, Institute for Communicable Disease Control and Prevention, Chinese Center for Disease Control and Prevention, Beijing 102206, China
伤寒和副伤寒是由伤寒沙门菌(Salmonella typhi)和甲、乙、丙型副伤寒沙门菌(S. paratyphitype A,B and C)引起的以发热为主要表现的全身性疾病,统称为肠热症(enteric fever)。临床上伤寒、副伤寒难于区分,因此我国传染病防治法将其按同一传染病管理。伤寒/副伤寒经粪-口途径传播,世界各地均有发生,但暴发和流行多集中在发展中国家及地区[1-3]。云南、贵州、广西3省(自治区)是我国伤寒/副伤寒流行最为严重的地区[4]。随着农村改水改厕工作的开展,饮水和环境卫生状况的改善及伤寒Vi疫苗的推广使用,我国伤寒/副伤寒发病率大幅下降[5],但在西南地区的高发状态仍未消除。流行病学调查证实伤寒/副伤寒在云南等地具有时空聚集性[6]。为此,本研究对2001-2012年云南、贵州、广西3省(自治区)伤寒/副伤寒发病数据进行了回顾性时空流行病学分析,初步明确了该病在西南地区的分布特点及聚集区变迁过程。
资料与方法1.资料来源:2001-2012年云南、贵州、广西3省(自治区)以县为单位的伤寒/副伤寒分月发病数及人口数据来源于中国疾病预防控制信息系统(China Information System for Diseases Control and Prevention,CISDCP)[7]。CISDCP中报告的伤寒/副伤寒主要为临床诊断病例,未作病原学区分,鉴于两类疾病症状与病原相似、感染和传播相同,因此本研究中将两者合并分析。
2.研究方法:
(1)统计学描述:2001年1月至2012年12月,按发病时间整理云南、贵州、广西3省(自治区)伤寒/副伤寒发病数据。发病数的季节性和周期性变化通过按月线图呈现。采用Excel 2007、SPSS 19. 0软件进行分析。
(2)伤寒/副伤寒专题地图:将3省(自治区)291个县2001-2012年伤寒/副伤寒年均发病率通过行政代码与1:100万云南、贵州、广西3省(自治区)行政地图匹配并进行颜色渲染,生成伤寒/副伤寒发病等级地图。根据年均发病率划分为3类:低发病区即年均发病率<10/10万;中等发病区即年均发病率为10/10万~100/10万;高发病区即年均发病率>100/10万[3]。采用ArcGIS 10.1(ESRI Inc.,Redlands,CA,USA)软件进行分析。
(3)时空聚集性分析:将3省(自治区)291个县(市)2001年1月至2012年12月每月伤寒/副伤寒病例数、人口数根据空间位置分年度进行时空聚集性分析。以小于总人口的50%为空间尺度,研究时间的90%(10个月)为时间尺度扫描计算确定云南、贵州、广西3省(自治区)伤寒/副伤寒发病聚集区。其分析原理:对于服从Poisson分布的发病资料建立一个可改变位置及大小的圆柱(柱的横截面为空间维度窗口,纵截面为时间维度窗口),窗口的圆心随地理位置变动,半径按规则从0增至一定范围,检验的零假设为窗口内外发病危险度相同,备择假设为窗口内的发病危险度高于窗口外,通过计算窗口内理论发病数与实际发病数对数似然比(log likelihood ratio,LLR)来评价扫描窗口内发病的异常程度,公式:
1.流行情况:2001-2012年云南、贵州、广西3省(自治区)共报告伤寒/副伤寒病例191 004例,占全国同期病例数(371 864例)的51.37%。其中贵州省病例数最多(87 482例),云南省次之(85 423例),广西壮族自治区最少(18 099例)。12年间3省(自治区)伤寒/副伤寒年均发病率为13.42/10万,远高于全国年均发病率(2.43/10万),各年发病率及病例分布变化情况见图 1。12年间3省(自治区)伤寒/副伤寒流行呈总体下降趋势,2001-2006年为明显下降期,发病率由30.15/10万降至10.83/10万(年均发病率21.12/10万);2007-2012年发病率趋于稳定,波动于4.75/10万~6.83/10万(年均发病率5.73/10万),仍高于全国平均水平。2001-2006年贵州省伤寒/副伤寒病例数下降最为明显,云南省、广西壮族自治区病例数无显著变化(图 1)。2007-2012年云南省病例数在3省(自治区)中所占比例最高,广西壮族自治区病例数保持稳定,贵州省病例数仍持续减少。

|
| 图 1 2001-2012年云南、贵州、广西3省(自治区)伤寒/副伤寒发病率及报告发病例数 |
2.病例的时空分布:2001-2012年云南、贵州、广西3省(自治区)伤寒/副伤寒流行的高峰时间一致,呈现季节相关性,夏秋季高发,冬春季较少。伤寒/副伤寒在3省(自治区)分布广泛,291个县(市)均有病例报告,并且病例呈现聚集性(图 2)。年均发病率>10/10万的县(市)共有113个,包括6个年均发病率>100/10万的高发病县(市)(云南省保山、澄江、元江,贵州省贵阳、遵义、兴义)。高、中发病率县(市)主要分布于玉溪至贵阳一线的带状区域,西南部与老挝、缅甸接壤。高、中发县(市)包含了3省(自治区)84.32%的伤寒/副伤寒病例数,但人口数仅占3省(自治区)人口的34.35%。年均发病率<10/10万的县(市)共178个,病例数占3省(自治区)病例数的15.68%,人口数占3省(自治区)总人口的65.65%。

|
| 图 2 2001-2012年云南、贵州、广西3省(自治区)伤寒/副伤寒年均发病率 |
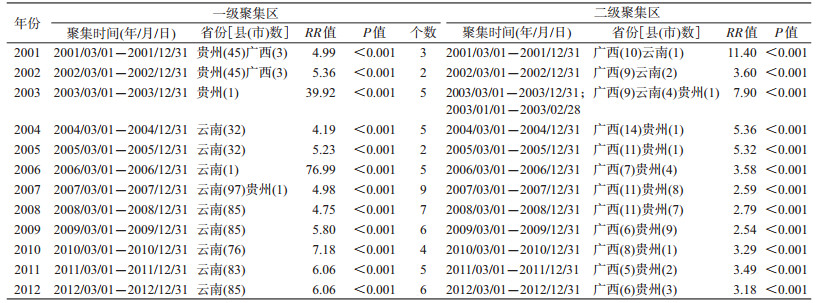
3.时空聚集性分析:SaTScan扫描分析显示,2001年、2002年云南、贵州、广西3省(自治区)伤寒/副伤寒发病的一级聚集区位于贵州省安顺、遵义、贵阳等48个县(市),聚集时间为3-12月,RR值为4.99(2001年)、5.36(2002年);二级聚集区主要分布于广西壮族自治区东北部的桂林及云南省南部与缅甸接壤的勐海、景洪等县(市),RR值为11.4(2001年)、3.60(2002年)。2003年发病一级聚集区为贵州省遵义市,与2003年当地伤寒暴发有关,RR值为39.92。与贵州省伤寒/副伤寒下降趋势相符,2004年开始3省(自治区)伤寒/副伤寒发病的一级聚集区转移至云南省部分县(市),如2004年、2005年一级聚集区位于云南省玉溪、弥勒等与贵州省和广西壮族自治区相邻的县(市),RR值为4.19(2004年)、3.99(2005年)。2006年云南省元江哈尼族自治县发生伤寒/副伤寒暴发,时空聚集性分析显示该县为伤寒/副伤寒一级聚集区,RR值达76.99。2007-2012年3省(自治区)伤寒/副伤寒发病的一级聚集区、二级聚集区位置相对固定,一级聚集区位于以玉溪为中心的云南西南部县(市),二级聚集区均位于广西东北部的桂林及贵州中部的贵阳等县(市)(图 3)。各年度一级、二级聚集区的聚集时间及RR值见表 1。

|
| 图 3 2001-2012年云南、贵州、广西3省(自治区)伤寒/副伤寒发病时空聚集 |
随着社会经济发展及卫生相关建设[10],我国伤寒/副伤寒发病总体呈现平稳下降趋势,但在云南、贵州、广西3省(自治区)依然高发,年发病数占全国的一半以上。本研究分析显示,伤寒/副伤寒发病主要分布于云南玉溪至贵州贵阳一线的带状区域及广西桂林地区的113个中高发病率县(市)[占3省(自治区)291个县(市)的39%],这些地区覆盖了3省(自治区)80%以上的病例,为防控的重点地区。
时空扫描发现云南、贵州、广西3省(自治区)伤寒/副伤寒病例的时空分布是非随机性的。时间分布上,3省(自治区)伤寒/副伤寒既有5-10月肠道传染病季节性发病高峰特点[1, 3, 6],也存在某些地区有超过数年的长时间聚集现象。5-10月为3省(自治区)夏秋季,气温高、雨水丰沛。气温和环境温度升高一方面利于细菌外环境存活,另一方面导致冷饮、凉菜的食用率升高,而丰沛的降雨和3省(自治区)特殊的咯斯特地貌极易导致水源污染,从而导致肠道感染风险增大[11-13]。空间分布上,随着3省(自治区)病例数/发病率消长,发病聚集区逐渐由贵州省转移至云南省。分析其原因,可能与2000年贵州省卫生行政部门采取一系列针对性防控措施,当地伤寒/副伤寒发病数大幅下降有关[14]。另外考虑可能与不同省份伤寒/副伤寒流行强度的此消彼长有关,2000年开始伤寒Vi疫苗在我国西南地区广泛使用,其后伤寒发病率快速下降[5]。而甲型副伤寒在以云南省为代表的西南地区开始流行,一些地区超过伤寒成为优势病原菌并成为新的公共卫生问题[4, 15]。与广西、贵州地区农村水型传播为主的特点不同,云南地区伤寒/副伤寒的发病以城镇为多[11, 14, 16]。如经济发达、自来水普及率高的玉溪市以甲型副伤寒所致的食源性感染和食源性暴发为主[16]。3省(自治区)伤寒/副伤寒的流行特点与印度尼西亚Jakarta市的研究相符,伤寒的发病与家庭成员的不良卫生习惯有关,而副伤寒主要由不洁饮食引起[2]。提示随着社会化进程,伤寒/副伤寒的发病将呈现经济发达地区以甲型副伤寒所致的食源性传播为主,而不发达地区或发展中地区仍以伤寒所致的水源性感染和暴发为主。
传染病时空聚集现象可能受气候、当地历史疫情和周边地区疫情影响,虽然目前3省(自治区)伤寒/副伤寒的发病呈下降趋势,但每年感染的病例数仍不容忽视。通过比较,3省(自治区)年度空间聚集范围及时间聚集跨度波动不大,伤寒/副伤寒的发病在3省(自治区)呈现地方病化的现象,进一步推测伤寒/副伤寒与当地历史发病水平、既往本底感染情况、特殊的气候地理因素及经济条件、卫生状况等关系密切,特别是喀斯特地貌引起的经水传播在3省(自治区)伤寒/副伤寒持续流行与地方病化过程中的作用应引起关注[12-15]。建议采取针对性措施降低本地感染水平,控制聚集发生。此外,以云南玉溪市为主的安全饮水覆盖率高、以甲型副伤寒感染为主的新流行区,其传播、感染模式尚缺乏系统性研究,导致这些新流行区持续流行的原因、是否存在有特殊传播模式等,还需要开展系统监测和分析。
利益冲突: 无
| [1] | Bhan MK, Bahl R, Bhatnagar S. Typhoid and paratyphoid fever[J]. Lancet, 2005, 366(9487): 749–762. DOI:10.1016/S0140-6736(05)67181-4 |
| [2] | Vollaard AM, Soegianto A, van Asten HAGH, et al. Risk factors for typhoid and paratyphoid fever in Jakarta, Indonesia[J]. JAMA, 2004, 291(21): 2607–2615. DOI:10.1001/jama.291.21.2607 |
| [3] | Crump JA, Luby SP, Mintz ED. The global burden of typhoid fever[J]. Bull World Health Organ, 2004, 82(5): 346–353. |
| [4] |
闫梅英, 梁未丽, 李伟, 等.
1995-2004年全国伤寒/副伤寒的流行分析[J]. 疾病监测, 2005, 20(8): 401–403.
Yan MY, Liang WL, Li W, et al. Epidemics of typhoid and paratyphoid fever from 1995 through 2004 in China[J]. Dis Surveill, 2005, 20(8): 401–403. DOI:10.3784/j.issn.1003-9961.2005.08.005 |
| [5] | Ochiai RL, Wang XY, Seidlein LV, et al. Salmonella paratyphi A rates, Asia[J]. Emerg Infect Dis, 2005, 11(11): 1764–1766. DOI:10.3201/eid1111.050168 |
| [6] |
王鲁茜, 闫梅英, 方立群, 等.
云南省伤寒副伤寒空间分布特征及其气候影响因素研究[J]. 中华流行病学杂志, 2011, 32(5): 485–489.
Wang LX, Yan MY, Fang LQ, et al. Typhoid and paratyphoid fever in Yunnan province:distributional patterns and the related meteorological factors[J]. Chin J Epidemiol, 2011, 32(5): 485–489. DOI:10.3760/cma.j.issn.0254-6450.2011.05.015 |
| [7] | Wang LD, Wang Y, Jin SG, et al. Emergence and control of infectious diseases in China[J]. Lancet, 2008, 372(9649): 1598–1605. DOI:10.1016/S0140-6736(08)61365-3 |
| [8] | Kulldorff M. SaTScanTM v6.1:software for the spatial, temporal, and space-time scan statistics[EB/OL]. Information Management Services, Inc., 2006. http://www.satscan.org/. |
| [9] | Kulldorff M, Heffernan R, Hartman J, et al. A space-time permutation scan statistic for disease outbreak detection[J]. PLoS Med, 2005, 2(3): e59. DOI:10.1371/journal.pmed.0020059 |
| [10] |
中国爱国卫生运动委员会办公室. 全国农村改水受益人口统计[R].
Office of Patriotic Health Campaign Committee MOHPR. The statistics for national rural drinking water supply[R]. |
| [11] |
高金霞, 张静.
2004-2007年中国大陆地区伤寒、副伤寒暴发疫情流行特征及危险因素分析[J]. 疾病监测, 2008, 23(11): 698–701.
Gao JX, Zhang J. Analysis of the epidemiological characteristics and risk factors of typhoid and paratyphoid outbreak in China, 2004 to 2007[J]. Dis Surveill, 2008, 23(11): 698–701. DOI:10.3784/j.issn.1003-9961.2008.11.012 |
| [12] | Ahmad K. Experts call for surveillance of drug-resistant typhoid at a global level[J]. Lancet, 2002, 359(9306): 592. DOI:10.1016/S0140-6736(02)07777-2 |
| [13] |
吴绍贵.
我国喀斯特地貌的形成机制及分布[J]. 魅力中国, 2009(28): 120.
Wu SG. Formation mechanism and distribution of Karst landform in China[J]. Charm China, 2009(28): 120. |
| [14] |
唐光鹏, 张静, 刘发文, 等.
贵州省伤寒副伤寒高发地区综合防治[J]. 预防医学情报杂志, 2011, 27(7): 483–487.
Tang GP, Zhang J, Liu FW, et al. Comprehensive prevention and control of typhoid/paratyphoid in high incidence area in Guizhou province[J]. J Prev Med Inf, 2011, 27(7): 483–487. |
| [15] |
孙军玲, 张静, 阚飙, 等.
2012年全国伤寒和副伤寒重点监测数据分析[J]. 疾病监测, 2014, 29(11): 875–879.
Sun JL, Zhang J, Kan B, et al. Key surveillance for typhoid/paratyphoid fever in China, 2012[J]. Dis Surveill, 2014, 29(11): 875–879. DOI:10.3784/j.issn.1003-9961.2014.11.009 |
| [16] |
张莹, 张静.
云南省伤寒、副伤寒高发地区流行特征分析[J]. 疾病监测, 2010, 25(7): 538–541.
Zhang Y, Zhang J. Epidemiology of enteric fever in area with high incidence in Yunnan province[J]. Dis Surveill, 2010, 25(7): 538–541. DOI:10.3784/j.issn.1003-9961.2010.07.010 |