 2017, Vol. 38
文章信息
- 耳玉亮, 金叶, 叶鹏鹏, 纪翠蓉, 汪媛, 邓晓, 高欣, 段蕾蕾, 王临虹.
- Er Yuliang, Jin Ye, Ye Pengpeng, Ji Cuirong, Wang Yuan, Deng Xiao, Gao Xin, Duan Leilei, Wang Linhong.
- 1990年与2013年中国70岁及以上老年人跌倒疾病负担分析
- Disease burden on falls among elderly aged 70 and over in the Chinese population, in 1990 and 2013
- 中华流行病学杂志, 2017, 38(10): 1330-1334
- Chinese Journal of Epidemiology, 2017, 38(10): 1330-1334
- http://dx.doi.org/10.3760/cma.j.issn.0254-6450.2017.10.007
-
文章历史
收稿日期: 2017-03-06


2. 100050 北京, 中国疾病预防控制中心慢性非传染性疾病预防控制中心
2. National Center for Chronic and Non-communicable Disease Control and Prevention, Chinese Center for Disease Control and Prevention, Beijing 100050, China
跌倒是全球老年人的重要健康问题,跌倒造成的死亡、残疾、功能受限、活动受限等后果,严重影响老年人的健康水平[1]。跌倒是我国≥65岁老年人因伤害死亡的第一位原因[2],也是我国>60岁老年人因伤害就诊的第一位原因[3-4]。研究显示,中国老年人跌倒发生率高达18.3%[5],跌倒是老年人群面临的重要健康问题。全球疾病负担(GBD)研究利用多种来源的数据进行综合估计,除使用死亡率指标外,还使用过早死亡损失寿命年(YLL)、伤残损失寿命年(YLD)和伤残调整寿命年(DALY)等相关指标来评价人群健康状况。既往研究显示,跌倒是造成中国≥65岁老年人DALY负担的第一位伤害原因[6]。本研究就跌倒给中国老年人造成的健康影响和近20年的变化情况进行描述,为制定老年人跌倒干预策略措施提供参考。
资料与方法1.资料来源:来自GBD2013中国分省疾病负担研究,该研究利用统一、可比的研究方法全面地分析和估计1990-2013年中国33个省份、204种死因的分省疾病负担,具体研究背景及方法参考文献[7-8]。GBD2013对中国数据的估计利用多个来源的数据,伤害数据主要来自全国伤害监测系统,全国疾病监测点系统、全国妇幼卫生监测网、中国CDC死因登记报告信息系统、中国澳门地区和香港地区死因数据以及一些已发表的文献或报告[9]。
2.疾病分类与编码:不同年代不同来源的死因数据,分别采用《疾病和有关健康问题的国际统计分类》ICD-9和ICD-10将死因分类映射到GBD死因分类中。本研究将ICD-9编码中为E880~E886、E888、E929涵盖的部分编码以及ICD-10编码为W00~W19涵盖的部分编码归为跌倒,详细编码见文献[10];不被认可为根本死因的编码(垃圾编码)会被重新归类至可做根本死因的分类中[9-10]。
3.分析指标:采用GBD2013结果中的死亡数/标化死亡率、YLL/标化YLL率、YLD/标化YLD率、DALY/标化DALY率作为测量跌倒造成疾病负担的主要指标,DALY=YLL+YLD,其中YLD的伤残权重来自9个国家(孟加拉、印度尼西亚、秘鲁、坦桑尼亚、美国、匈牙利、意大利、瑞典和荷兰)人群调查和网络调查后的统计结果,相关估计方法见文献[11-12]。年龄别YLL率、YLD率、DALY率的计算为各年龄组损失的寿命年数除以该年龄组人口数。
4.数据分析:本研究分析1990-2013年中国人群跌倒的死亡数、YLL、YLD、DALY等指标,为了消除不同年代、不同地区人口构成的影响,使用GBD2013全球标准人口对死亡率、YLL率、YLD率、DALY率进行标化。通过计算不同年龄组、不同性别人群1990-2013年≥70岁老年人跌倒各标化率的变化,分析近年来我国跌倒疾病负担的变化情况。各指标2013年和1990年变化率计算方法为某指标2013年与1990年变化差值除以该指标1990年值后×100%。
结果1.跌倒疾病负担:2013年中国有4.88万≥70岁老年人因跌倒而死亡,跌倒标化死亡率61.71/10万。因跌倒造成的YLL、YLD和DALY分别是43.96万人年、29.58万人年和73.54万人年,YLL占DALY的59.78%。YLL率、YLD率和DALY率分别为555.87/10万、373.98/10万和929.85/10万。见表 1。
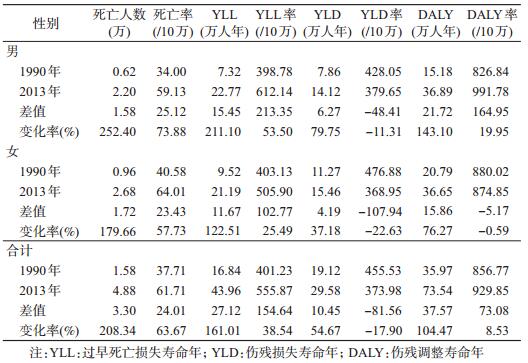
(1)性别分布:≥70岁男性跌倒死亡率(59.13/10万)小于女性(64.01/10万),而男性YLL率(612.14/10万)和DALY率(991.78/10万)高于女性YLL率(505.90/10万)和DALY率(874.85/10万),男、女性YLD率相似。见表 2。

(2)年龄分布:高年龄组老年人群因跌倒死亡数、跌倒死亡率、DALY数、DALY率高于低年龄组,其中≥80岁年龄组人群跌倒死亡率和DALY率分别为151.90/10万和1 597.63/10万,分别为74~79岁人群的7.78倍和2.75倍。不同年龄组内,男、女性死亡率、DALY率有所不同,70~79岁人群中男性跌倒死亡率、DALY率大于女性;≥80岁年龄组女性跌倒死亡率大于男性,女性DALY率与男性基本相同。见表 2。
2.1990-2013年跌倒疾病负担变化:
(1)总体变化:2013年中国因跌倒死亡的≥70岁老年人数(4.88万)是1990年(1.58万)的3.09倍。2013年≥70岁老年人因跌倒造成的YLL、YLD和DALY分别是43.96万人年、29.58万人年和73.54万人年;与1990年相比,YLL、YLD和DALY分别增加161.01%、54.67%和104.47%。YLL占DALY的比例由1990年的46.82%上升至2013年的59.78%。
2013年≥70岁人群因跌倒标化死亡率61.71/10万,较1990年的37.71/10万增加63.67%。标化的YLL率和DALY率分别从1990年的401.23/10万和856.77/10万上升到2013年的555.87/10万和929.85/10万;上升幅度为38.54%和8.53%。而标化YLD率由1990年的455.53/10万,下降为373.98/10万,降幅17.90%。见表 1。
(2)不同性别人群跌倒疾病负担变化:从绝对数量上看,与1990年相比,2013年男、女性≥70岁人群因跌倒造成死亡数、YLL、YLD和DALY均有大幅度增加,其中男性在各项指标上的增幅都高于女性。见表 1。与1990年相比,2013年男、女性≥70岁人群的跌倒死亡率均有所增加,≥70岁男性死亡率增加幅度为73.88%,高于女性增加幅度(57.73%)。与1990年相比,2013年不同性别≥70岁人群的YLD率均有所降低,男性YLD率下降11.31%,女性下降22.63%,女性降幅约为男性的2倍。2013年男、女性YLL率较1990年均有所上升,男性上升53.50%,女性上升25.49%。与1990年比较,男性DALY率上升19.25%,女性DALY率变化不大,下降0.59%。见表 1。
(3)不同年龄组人群跌倒疾病负担变化:与1990年相比,除70~74岁女性人群的死亡率和DALY率、75~79岁女性DALY率这3项指标外,2013年男性和女性其他年龄组因跌倒导致死亡数、死亡率、DALY、DALY率均呈现不同幅度的增加。不同性别年龄组增加幅度不同,但总体上呈现出高年龄组疾病负担增加幅度大于低年龄组的特点。与1990年比较,2013年70~74岁、75~79岁年龄组的女性人群DALY率分别下降18.33%和10.09%,见表 2。
讨论跌倒给中国老年人造成沉重的疾病负担。早在2002年WHO在全球疾病负担报告就已指出:我国跌倒/坠落伤害的疾病负担在全世界最高,造成伤残调整生命年(DALYs)损失约为世界其他地区的2倍[13]。国内研究也显示,在中国,跌倒是中国老年人第一位因伤害死亡原因,其死亡率远高于全人群跌倒死亡率[2],跌倒是造成我国≥65岁老年人群因伤害损失DALY的第一位原因[6]。本研究显示,2013年我国约4.88万名≥70岁的老年人因为跌倒而死亡,平均每天约134人因跌倒死亡。如以我国规定的≥60岁界定为老年人这一标准,因跌倒造成的死亡数量还会有所增加。研究还发现,不论男、女性,跌倒造成的死亡数、标化死亡率、DALY值和标化DALY率都呈现随年龄增加而增加的现状,表明跌倒给老年人造成的疾病负担随着其年龄增加而越发严重,这与全球跌倒的流行特点相一致[10]。跌倒已构成威胁老年人健康的重要原因,应作为老年人伤害预防工作和研究的优先和重点领域,年龄越高的老年人,越应该重视跌倒的预防。
1990-2013年老年人群跌倒疾病负担有所增加。2013年中国≥70岁人群因跌倒死亡数量是1990年的3.09倍,YLL、YLD、DALY值也都呈现不同幅度的增加,造成跌倒疾病负担绝对数量的增加主要的原因之一是中国人口的快速老龄化。中国65岁以上老年人口由1990年的0.63亿增加至2010年的1.19亿[14-15],研究预测,中国社会快速老龄化要持续到2030年,2030年后我国人口老龄化速度会相对减慢[16],据此可以预测,如果跌倒给老年人造成的死亡率、伤残率不变,未来一段时间跌倒给老年人带来的疾病负担仍将有所增加。
本研究结果还显示1990-2013年中国≥70岁人群因跌倒死亡率、YLL率和DALY率分别上升63.67%、38.54%和8.53%。其中男、女性跌倒标化死亡率的增幅分别是73.88%和57.73%,远高于同期中国≥70岁人群肺癌死亡率增幅(男性36.56%、女性28.31%)[17]。美国等国家的研究也发现老年人因跌倒死亡率有所上升的趋势[18]。老年人跌倒死亡率上升可能的原因是中国人群期望寿命同期提升8.5岁[8-9],高龄老年人比例增加。20世纪90年代起,中国老年人高血压、糖尿病、总体慢性病患病率都有大幅增加[15, 18-20]。身体脆弱性增加,使得老年人跌倒后严重程度和死亡风险增加[21]。第二,我国“空巢”老年人的数量和比例迅速增加,跌倒后,因身边缺乏照顾,可能延误就诊和治疗,造成更严重的后果[22]。造成老年人群跌倒死亡率增加的确切原因有待进一步研究。
我国需开展全面的老年人跌倒预防工作。目前中国社会正处于老龄化的快速进程中[23],老年人口的绝对数量仍会快速增加[16],本研究第一次使用国际公认的GBD数据,从全国水平明确≥70岁人群跌倒死亡率在1990-2013年间快速增加,明确指出老年人跌倒疾病负担的严重性。发达国家的研究已证明通过科学预防可有效减少老年人跌倒的发生[24]。我国跌倒预防在老年人健康保健中尚未得到充分重视,应尽早将跌倒预防纳入老年人健康保健的优先工作领域,积极采取应对措施以减轻跌倒给老年人造成的疾病负担。
本研究存在局限性。作为GBD2013的一部分,本研究同样有GBD2013方法学上的局限性[7, 9],特别是我国伤害数据相对缺乏,可能对伤害疾病负担估算产生一定影响。此外,受限于GBD2013数据的可及性,本研究未以更符合中国国情的≥60岁人群作为老年人群而进行分析,也缺乏对城市和农村地区的比较分析,需要进一步开展后续研究。
利益冲突: 无
| [1] | Beard JR, Officer AM, Cassels AK. The world report on ageing and health[J]. Gerontologist, 2016, 56(Suppl 2): S163–166. |
| [2] |
中国疾病预防控制中心慢性非传染性疾病预防控制中心, 国家卫生和计划生育委员会统计信息中心.中国死因监测数据集2015[M]. 北京: 中国科学技术出版社, 2016.
National Center for Chronic and Non-communicable Disease Control and Prevention, Chinese Centre for Disease Control and Prevention, Statistical Information Center of the National Health and Family Planning Commission.The National Disease Surveillance System Death Surveillance Data Sets 2015[M]. Beijing: China Science and Technology Press, 2016. |
| [3] |
耳玉亮, 段蕾蕾, 叶鹏鹏, 等.
2014年全国伤害监测系统老年人非故意伤害病例特征分析[J]. 中国健康教育, 2016, 32(4): 312–317.
Er YL, Duan LL, Ye PP, et al. Analysis on the characteristics of unintentional injuries among the elderly from Chinese National Injury Surveillance System, 2014[J]. Chin J Health Educ, 2016, 32(4): 312–317. DOI:10.16168/j.cnki.issn.1002-9982.2016.04.005 |
| [4] |
中国疾病预防控制中心慢性非传染性疾病预防控制中心.全国伤害医院监测数据集(2015)[M]. 北京: 人民卫生出版社, 2016.
National Center for Chronic and Non-Communicable Disease Control and Prevention, Chinese Centre for Disease Control and Prevention.National Injury Surveillance Dataset (2015)[M]. Beijing: People's Medical Publishing House, 2016. |
| [5] |
高茂龙, 宋岳涛.
中国老年人跌倒发生率Meta分析[J]. 北京医学, 2014, 36(10): 796–798.
Gao ML, Song YT. Meta-analysis of the prevalence of fall in elderly in China[J]. Beijing Med J, 2014, 36(10): 796–798. |
| [6] |
王黎君, 刘韫宁, 刘世炜, 等.
1990年与2010年中国人群伤害疾病负担分析[J]. 中华预防医学杂志, 2015, 49(4): 321–326.
Wang LJ, Liu YN, Liu SW, et al. Status injury burden in 1990 and 2010 for Chinese people[J]. Chin J Prev Med, 2015, 49(4): 321–326. DOI:10.3760/cma.j.issn.0253-9624.2015.04.009 |
| [7] | GBD 2013 DALYs and HALE Collaborators, Murray CJL, Barber RM, et al. Global, regional, and national disability-adjusted life years (DALYs) for 306 diseases and injuries and healthy life expectancy (HALE) for 188 countries, 1990-2013:quantifying the epidemiological transition[J]. Lancet, 2015, 386(10009): 2145–2191. DOI:10.1016/S0140-6736(15)61340-X |
| [8] | GBD 2013 Mortality and Causes of Death Collaborators. Global, regional, and national age-sex specific all-cause and cause-specific mortality for 240 causes of death, 1990-2013:a systematic analysis for the Global Burden of Disease Study 2013[J]. Lancet, 2015, 385(9963): 117–171. DOI:10.1016/S0140-6736(14)61682-2 |
| [9] | Zhou MG, Wang HD, Zhu J, et al. Cause-specific mortality for 240 causes in China during 1990-2013:a systematic subnational analysis for the Global Burden of Disease Study 2013[J]. Lancet, 2016, 387(10015): 251–272. DOI:10.1016/S0140-6736(15)00551-6 |
| [10] | Haagsma JA, Graetz N, Bolliger I, et al. The global burden of injury:incidence, mortality, disability-adjusted life years and time trends from the Global Burden of Disease study 2013[J]. Inj Prev, 2016, 22(1): 3–18. DOI:10.1136/injuryprev-2015-041616 |
| [11] | Lozano R, Naghavi M, Foreman K, et al. Global and regional mortality from 235 causes of death for 20 age groups in 1990 and 2010:a systematic analysis for the Global Burden of Disease Study 2010[J]. Lancet, 2012, 380(9859): 2095–2128. DOI:10.1016/S0140-6736(12)61728-0 |
| [12] | Vos T, Flaxman AD, Naghavi M, et al. Years lived with disability (YLDs) for 1160 sequelae of 289 diseases and injuries 1990-2010:a systematic analysis for the Global Burden of Disease Study 2010[J]. Lancet, 2012, 380(9859): 2163–2196. DOI:10.1016/S0140-6736(12)61729-2 |
| [13] | World Health Organization. The injury Chart Book:a graphical overview of the global burden of injuries[R]. Geneva:WHO, 2002. |
| [14] |
中华人民共和国卫生部.2009中国卫生统计年鉴[M]. 北京: 中国协和医科大学出版社, 2009.
Ministry of Health, the People's Republic of China.2009 China Health Statistical Yearbook[M]. Beijing: Beijing Union Medical University Press, 2009. |
| [15] |
国家卫生和计划生育委员会.2013中国卫生和计划生育统计年鉴[M]. 北京: 中国协和医科大学出版社, 2013.
National Health and Family Planning Commission of the People's Republic of China.2013 China Statistical Yearbook of Health and Family Planning[M]. Beijing: Beijing Union Medical University Press, 2013. |
| [16] |
邬沧萍, 王琳, 苗瑞凤.
中国特色的人口老龄化过程、前景和对策[J]. 人口研究, 2004, 28(1): 8–15.
Wu CP, Wang L, Miao RF. Process, prospects and countermeasures of population aging with Chinese characteristics[J]. Popul Res, 2004, 28(1): 8–15. DOI:10.3969/j.issn.1000-6087.2004.01.002 |
| [17] |
刘韫宁, 刘江美, 殷鹏, 等.
1990年与2010年中国恶性肿瘤疾病负担研究[J]. 中华预防医学杂志, 2015, 49(4): 309–314.
Liu YN, Liu JM, Yin P, et al. The disease burden of malignant tumor in China, 1990 and 2010[J]. Chin J Prev Med, 2015, 49(4): 309–314. DOI:10.3760/cma.j.issn.0253-9624.2015.04.006 |
| [18] |
全国血压抽样调查协作组.
中国人群高血压患病率及其变化趋势[J]. 高血压杂志, 1995(Suppl): 7–13.
PRC National Blood Pressure Survey Cooperative Group. Prevalence and development trends of hypertension in China[J]. Chin J Hypertens, 1995(Suppl): 7–13. |
| [19] |
中国疾病预防控制中心慢性非传染性疾病预防控制中心.中国慢性病及其危险因素监测(2010)——老年健康专题报告[M]. 北京: 人民卫生出版社, 2014.
National Center for Chronic and Non-communicable Disease Control and Prevention, Chinese Centre for Disease Control and Prevention.Report on the Status of Elderly Health:Chronic Disease Risk Factor Surveillance in China (2010)[M]. Beijing: People's Medical Publishing House, 2014. |
| [20] |
王克安, 李天麟, 向红丁.
中国糖尿病流行特点研究——糖尿病和糖耐量低减患病率调查[J]. 中华流行病学杂志, 1998, 19(5): 282–285.
Wang KA, Li TL, Xiang HD. Study on the epidemiological characteristics of diabetes mellitus and IGT in China[J]. Chin J Epidemiol, 1998, 19(5): 282–285. DOI:10.3760/j.issn:0254-6450.1998.05.007 |
| [21] | Bergen G, Stevens MR, Burns ER. Falls and fall injuries among adults aged ≥ 65 Years-United States, 2014[J]. MMWR Morb Mortal Wkly Rep, 2016, 65(37): 993–998. DOI:10.15585/mmwr.mm6537a2 |
| [22] |
黄润龙.
我国空巢老人家庭状态[J]. 人口与经济, 2005(2): 57–62.
Huang RL. The family condition of empty-nest household in China[J]. Popul Econ, 2005(2): 57–62. |
| [23] |
中华人民共和国国家统计局. 2010年第六次全国人口普查主要数据公报(第1号)[R]. 北京: 中华人民共和国国家统计局, 2011.
National Bureau of Statistics of the People's Republic of China. Communiqué of the National Bureau of Statistics of the People's Republic of China on Major Figures of the 2010 Population Census[1] (No.1)[R]. Beijing:National Bureau of Statistics of the People's Republic of China, 2011. |
| [24] | Gillespie LD, Robertson MC, Gillespie WJ, et al. Interventions for preventing falls in older people living in the community[J]. Cochrane Database Syst Rev, 2012(9). DOI:10.1002/14651858.CD007146.pub3 |