 2017, Vol. 38
文章信息
- 李志芳, 黄慧瑶, 石菊芳, 郭春光, 邹霜梅, 刘成成, 王洋, 王乐, 朱松林, 吴寿岭, 代敏 .
- Li Zhifang, Huang Huiyao, Shi Jufang, Guo Chunguang, Zou Shuangmei, Liu Chengcheng, Wang Yang, Wang Le, Zhu Songlin, Wu Shouling, Dai Min .
- 结直肠癌疾病自然史模型研究的系统综述:体系分类、参数分析及推荐构建我国人群特异性模型
- A systematic review of worldwide natural history models of colorectal cancer: classification, transition rate and a recommendation for developing Chinese population-specific model
- 中华流行病学杂志, 2017, 38(2): 253-260
- CHINESE JOURNAL OF EPIDEMIOLOGY, 2017, 38(2): 253-260
- http://dx.doi.org/10.3760/cma.j.issn.0254-6450.2017.02.024
-
文章历史
收稿日期: 2016-08-22


2. 100021 北京, 国家癌症中心/中国医学科学院北京协和医学院肿瘤医院腹外科;
3. 100021 北京, 国家癌症中心/中国医学科学院北京协和医学院肿瘤医院病理科;
4. 063000 唐山, 开滦总医院肿瘤科;
5. 063000 唐山, 开滦总医院员工健康保障中心;
6. 410006 长沙, 湖南省肿瘤医院肿瘤防治研究办公室
2. Abdominal Surgery, National Cancer Center, Cancer Hospital, Chinese Academy of Medical Sciences, Peking Union Medical College, Beijing 100021, China;
3. Department of Pathology, National Cancer Center, Cancer Hospital, Chinese Academy of Medical Sciences, Peking Union Medical College, Beijing 100021, China;
4. Department of Oncology, Kai-Luan Hospital, Tangshan 063000, China;
5. Health Center for Staff, Kai-Luan Hospital, Tangshan 063000, China;
6. Office for Cancer Control and Research, Hunan Cancer Hospital, Changsha 410006, China
结直肠癌包括结肠癌、直肠癌和肛门癌。我国结直肠癌发病率和死亡率上升速度较快[1]。筛查可明显降低结直肠癌死亡率[2-3],了解结直肠癌的疾病自然史发展过程有助于制定和筛选经济有效的筛查干预措施。近年来国际范围关注结直肠癌筛查效果的研究较多,包括基于实际筛查人群的随访研究和基于模型的疾病自然史及成本效果评价[4-5]。与人群研究相比,模型研究可同时模拟多种干预,无需随访研究所需的长期时间和财力投入,因此较多用于癌症筛查效果评价。目前我国在结直肠癌筛查方面的效果和经济学评价仍然有限,特别是模型研究[6]。本研究重点关注全球范围的结直肠癌模型研究,以了解其疾病自然史状态设置、参数转归情况、与我国常用结直肠癌疾病分类的衔接情况等,最终提出构建我国人群特异性结直肠癌自然史模型的框架建议。
资料与方法1. 检索策略:以“colorectal neoplasms”[MeSH Terms] AND cost[Title/Abstract]) AND Screening[Title/Abstract]为检索式在PubMed文献库中检索,发表日期限定于1995年1月1日至2015年12月31日。初检获得1 022篇,阅读题目和摘要排除不相关文献867篇,初筛纳入文献155篇;精读全文,按照以下标准排除131篇文献:①未报告模型结构68篇;②报告模型结构但无具体参数值46篇;③模型结构及参数值重复17篇,最终纳入24项研究[7-30]。经初步检索以及专业背景了解,发现国内目前有关结直肠癌疾病自然史的模型研究较少,故未在中文库展开系统检索。
2. 数据处理:结直肠癌自然史模型差异主要体现在模型结构,即具体健康或疾病状态设置,以及不同状态间的进展或消退的概率。本文数据摘录按以下3项原则:①文献基本信息包括发表年份、研究人群、覆盖/模拟人数、筛查年龄、筛查技术和频率、模型构建技术,以及具体调试目标、基线参数来源、敏感性分析参数类型等;②模型状态及系统确认应遵循从正常组织至癌前病变,癌前病变至癌及其分期的分区,逐一确认常见的健康状态设置体系;③基于确认的常见模型状态体系,构建细化状态间进展和消退概率数据库并摘录整理。本文以多篇文献系列转归概率的中位数为最终指标,并提供相应数据的最小值和最大值。原始文献中若同时有不同时间跨度的概率数据,则优先摘录1年转归数据。最终结合我国结直肠癌及其腺瘤常用分类系统、文献模型的通用性和创新性、参数信息可获得性等因素,以示意图形式给出推荐的我国人群特异性结直肠癌自然史模型。
结 果1. 文献基本信息:最终纳入24篇采用模型构建技术研究的文献,主要分布于美国(9篇)[7-8, 14, 16-20, 22]、英国(4篇)[13, 15, 25, 30]和法国(3篇)[11, 21, 26]等发达国家,亚洲数量较少,中国人群仅有2篇[12, 27],包括大陆人群1篇[27]。其中主要发表于2008年(4篇)和2010年(5篇)。结直肠癌筛查起始年龄多设定在≥50岁(19篇)。其中22篇文献的研究采用马尔可夫模型,采用贝叶斯模型[20]和其他模型[30]各一篇。14篇文献在研究中做了模型调试,最常见的目标为腺瘤进展概率(7篇)、癌症发病率(6篇)和癌症进展概率(6篇),其次为癌症死亡率和腺瘤发病率。21篇文献开展了敏感性分析,测试变量主要为成本、筛查技术准确性和筛查参与率(表 1)。

2. 健康/疾病状态及体系:21篇文献在模型中设置“健康”状态,其余的研究直接从“腺瘤”状态开始[11, 18, 21];所有文献均设有“腺瘤”和“癌症”健康状态;除1项研究外其余均设有“死亡”状态[28],其中11项研究进一步区分了“结直肠癌死亡”和“其他死因死亡”,9项研究未明确分类,3项研究仅考虑了“结直肠癌死亡”[7, 12, 27]。健康状态间转归概率数据来源多样,包括原创性流行病学研究(18篇)、权威或官方数据(15篇)、团队自身项目积累数据(2篇)以及其他模型数据或假设数据(2篇),见表 1。其中有研究认为75%~85%[8, 16, 24, 29],甚至100%的结直肠癌是由腺瘤发展而来[20],为此本文归纳分析常见腺瘤及结直肠癌的细化状态及参数。
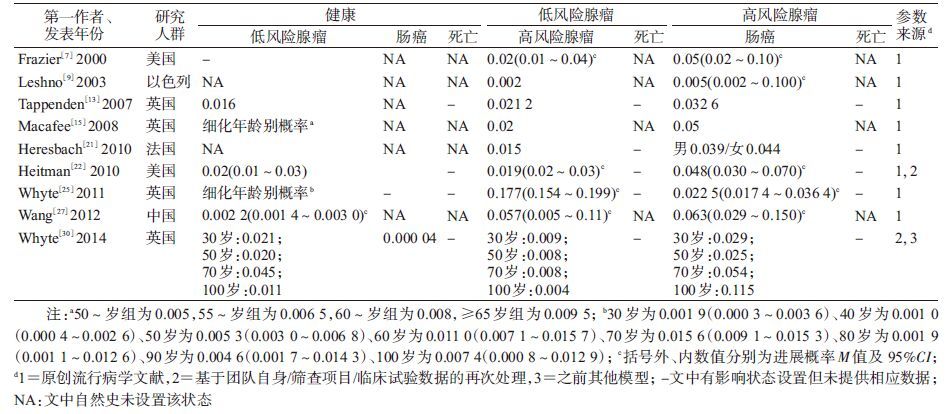
3. 结直肠腺瘤疾病自然史细化状态体系及参数:纳入文献的腺瘤分类系统主要是依据腺瘤风险(9篇)[7, 9, 13, 15, 21-22, 25, 27, 30]和仅按腺瘤大小进行分类,其中后者又多见依据腺瘤<10或≥10 mm(7篇)[10-12, 16, 22-24]和≤5、6~9及≥10 mm(6篇)[8, 10, 13, 15, 19, 21]两种分类。
(1)依据腺瘤风险分类:有6篇文献的研究是将腺瘤分为低风险和高风险[7, 9, 13, 15, 25, 30],其中Frazier等[7]明确定义高风险腺瘤为直径≥10 mm或含有绒毛成分;2篇文献将腺瘤分为进展期和非进展期(进展期定义为直径≥10 mm或组织学有高度异型增生或绒毛膜成分)[22, 27],另1篇则细分为低风险和进展期腺瘤[21](表 2)。上述9篇文献中转归参数可概括为:从“健康”发展为低风险腺瘤1年概率M=0.016 0(0.002 2~0.020 0),低风险腺瘤进展为高风险腺瘤概率M=0.020(0.002~0.177),高风险腺瘤进展为结直肠癌的概率M=0.044(0.005~0.063)。此外,关于腺瘤的消退,仅Heitman等[22]在研究中明确进展期和非进展期腺瘤可逆转为“健康”状态,但未给出参数值。
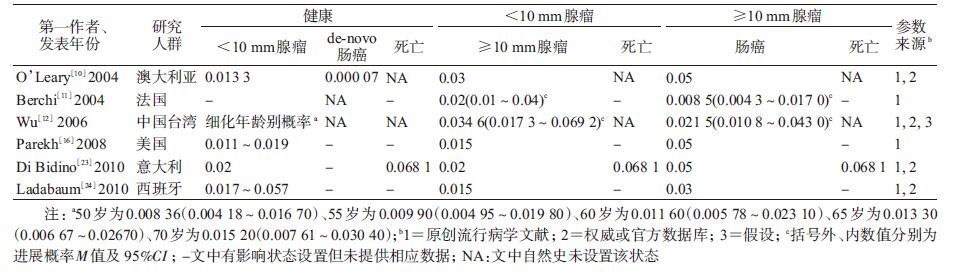
(2)仅依据腺瘤大小(<10或≥10 mm)分类:以腺瘤10 mm为分界的7篇文献中有6篇[10-12, 16, 23-24]提供了转归概率(表 3)。即由“健康”发展为<10 mm腺瘤的1年概率M=0.016 7(0.015 0~0.037 0),腺瘤<10 mm发展为≥10 mm的概率M=0.020(0.015~0.035),≥10 mm腺瘤发展为结直肠癌的概率M=0.040(0.009~0.050)。
(3)仅依据腺瘤大小(≤5、6~9及≥10 mm,微小/小/大)分类:该分类的6篇文献[14, 17, 19-20, 26, 28]得到以下转归参数,由“健康”发展为≤5 mm(微小)腺瘤的概率M=0.013(0.009~0.019),微小腺瘤发展为6~9 mm(小)腺瘤的概率M=0.043(0.020~0.085),小腺瘤发展为≥10 mm(大)腺瘤的概率M=0.044(0.020~0.125),大腺瘤发展为结直肠癌的概率M=0.034(0.030~0.040)。Greuter等[28]的模型假设大腺瘤需经过进展期腺瘤(≥10 mm或有绒毛膜成分/高度异型增生)路径发展为癌,并假设腺瘤可逆转至“健康”,小腺瘤至微小腺瘤、大腺瘤至小腺瘤的1年消退概率分别为0.0~0.6和0.0~0.4[28]。还有1篇文献假设各健康状态均有死于结直肠癌的风险(表 4)[20]。

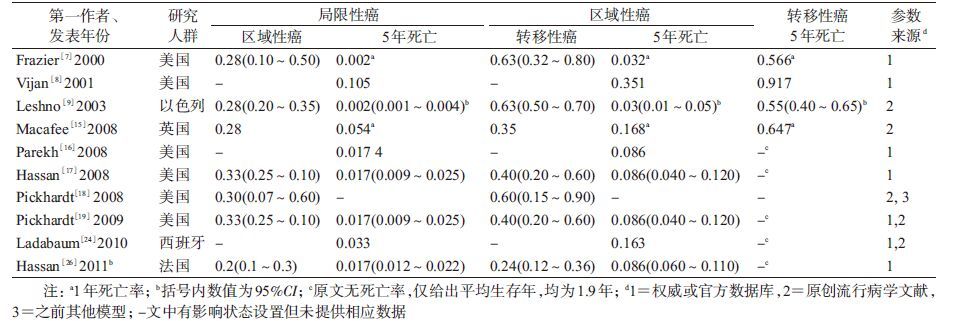
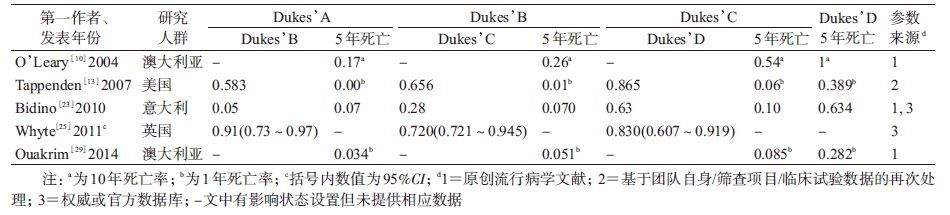
4. 结直肠癌疾病自然史细化状态体系及参数:除了个别研究将结直肠癌笼统分为早期和晚期[14, 27]或临床前期和早晚期[12, 20]外,最常见的分期系统主要有按癌灶范围(局限性/区域性/转移性癌)(10篇[7-9, 15-19, 24, 26])、Dukes’分期(7篇[10-11, 13, 23, 25, 29-30])和TNM分期(3篇[21-22, 28])。
(1)按癌灶范围分期系统:10篇文献的结果概括为局限性癌进展为区域性癌的概率M=0.28(0.20~0.33),区域性癌进展为转移癌的概率M=0.40(0.24~0.63),见表 5。
(2)按Dukes’分期系统:7篇以Dukes’分期的模型中有5篇[10, 13, 23, 25, 29]提供转归概率。即Dukes’A期进展为B期、B期进展为C期和C期进展为D期的概率M值依次约为0.583(0.050~0.910)、0.656(0.280~0.720)和0.830(0.630~0.865),见表 6。
(3)按TNM分期系统:仅2篇提供了具体参数值[21-22],其中Heresbach等[21]的模型由Ⅰ期向Ⅱ期、Ⅱ期向Ⅲ期、Ⅲ期Ⅳ期癌的进展概率分别为0.30、0.45和0.50。
5. de novo路径:除常见的“腺瘤-癌”路径,纳入文献中有5篇提及“de novo路径”[14, 17, 19, 26, 28]。其中Greuter等[28]定义该路径为从“正常内皮”或“健康”直接进展成癌,其余4篇[14, 17, 19, 26]虽无明确定义,但提供的进展概率分别为0.000 4~0.001 6、0.000 1~0.000 9、0.000 08~0.000 16和0.000 08~0.001 60。此外,还有2项研究虽然未明确提出“de novo路径”,但给出了“正常内皮”至Dukes’A期癌的进展概率,分别为0.000 07和0.000 04[10, 30]。
6. 其他疾病状态系统及参数:24篇文献中有1项模型研究(Greuter等[28])认为15%的结直肠癌来自于锯齿状病变(包括无蒂锯齿状腺瘤和增生性息肉),但只有无蒂锯齿状腺瘤有转化成癌的可能。该研究提供了细化年龄别健康至锯齿状病变的概率,小锯齿状病变(<10 mm)进展为大锯齿状病变(≥10 mm)的概率为0.012~0.028;只有增生性息肉有消退的可能:小增生性息肉(<10 mm)转归至正常内皮、大增生性息肉(≥10 mm)转归至小增生性息肉(<10 mm)的概率分别为0.0~0.1和0.3~0.4[28]。
7. 年龄别参数:纳入24篇文献的年龄别转归概率信息少且可比性低。其中依据腺瘤风险分类的报道仅3篇:Macafee等[15]在2008年给出了每年龄组相差5岁共4个年龄段(50~54、55~59、60~64和≥65岁)数据;而来自同一团队不同年份的研究也有差异:Whyte等[25]在2011年提供了30~100岁每个年龄组相差10岁的8个年龄段数据,2014年的报道则整合为30、50、70和100岁的4个年龄点数据[30](表 2)。依据腺瘤大小<10或≥10 mm和≤5、6~9及≥10 mm分类的研究均仅有1项研究提供了年龄别参数,前者为50~70岁间每组相差5岁共5个年龄段数据(表 3)[12],后者为20~90岁8个年龄段参数估计(表 4)[28]。
8. 我国人群特异性结直肠癌模型:综合考虑我国临床常规及现有大型癌症筛查项目常用分类系统的实情以及模型的通用性和创新性、参数信息的可获得性等因素,本研究初步推荐出我国人群特异性结直肠癌疾病自然史模型结构框架(图 1)。

|
| 注:方框为健康/疾病状态,箭头为可能的发展/转归方向,虚线为尚不确定的方向; 图内任何状态都有可能发生结直肠癌以外的死亡 图 1 构建我国人群特异性结直肠癌自然史模型的结构 |
对全球近10年结直肠癌疾病自然史模型研究汇总发现,目前该类型研究的文献报道数量有限。癌前病变的状态设置仍以腺瘤为主,但不同研究的细化设置有差异,缺少不同疾病状态间转归概率数据且提供的数据可比性一般。癌症分期系统表现多样,多以按癌灶范围和Dukes’分期系统常见,但目前我国临床多用TNM分期系统,这对构建我国人群特异性结直肠癌疾病自然史模型数据的对接提出挑战。
本研究存在局限性。因采集文献庞杂,在制定检索策略时仅关注了PubMed文献库,可能存在重要英文文献的漏检。由于摘录原始数据限制,本研究未能开展数据的整合分析。
对于结直肠癌的分类系统,尽管本研究纳入的文献较多使用癌灶范围及Dukes’分期系统,但在我国实际临床工作中,早期多使用LRD分类及Dukes’分期系统,近期常应用TNM分期[31-32]。因此,若拟将本研究获得的参数与我国近期实际临床及大型结直肠癌筛查项目的疾病分类体系相对接,应优先考虑TNM分期系统。同时需要注意,本研究发现近10年全球结直肠癌疾病自然史模型研究文献中TNM分期转归参数有限,可能需要参考LRD分类系统的参数数据,在临床和病理专家指导下进行参数转换以获得近似估算值;此外也可收集归纳基于我国结直肠癌的TNM分期预后生存数据,将其转化以获得更稳定的TNM分期进展参数集。
腺瘤分类系统多样,本研究归纳得出的两类3种分类系统中,以“腺瘤风险”分类更综合全面(兼顾了腺瘤大小、形态学和组织病理学信息)。我国目前临床病理也多依照2010版《消化系统肿瘤WHO分类》[33],其报告中也兼有以上信息,且我国农村和城市癌症早诊早治项目结直肠癌筛查技术方案中也综合考虑了腺瘤大小、形态和病理分型的“风险分类”[31-32]。因此,我国实际临床及公共卫生项目实施中若使用本研究获得参数,应优先考虑“腺瘤风险”分类系统。
结直肠癌癌前病变还应有其他多种状态。尽管“锯齿状病变”路径报道较少,仍提示了研究方向,即结直肠癌并非全部由腺瘤发展而来,故在建立整个结直肠癌疾病自然史模型中应予以参考[28]。而“de novo路径”则对筛查干预的意义不显著,构建模型时可不予考虑。
总之,今后的研究可参考本文推荐的我国人群特异性结直肠癌模型框架,以构建可对我国结直肠癌筛查方案进行精准评价的模型平台。更期待结直肠癌筛查队列大样本长期流行病学随访数据,不断优化模型。
利益冲突: 无
| [1] |
张玥, 石菊芳, 黄慧瑶, 等.
中国人群结直肠癌疾病负担分析[J]. 中华流行病学杂志, 2015, 36(7): 709–714.
Zhang Y, Shi JF, Huang HY, et al. Burden of colorectal cancer in China[J]. Chin J Epidemiol, 2015, 36(7): 709–714. DOI:10.3760/cma.j.issn.0254-6450.2015.07.010 |
| [2] | Levin B, Lieberman DA, McFarland B, et al. Screening and surveillance for the early detection of colorectal cancer and adenomatous polyps,2008:a joint guideline from the American Cancer Society,the US Multi-Society Task Force on Colorectal Cancer,and the American College of Radiology[J]. Gastroenterology, 2008, 134(5): 1570–1595. DOI:10.1053/j.gastro.2008.02.002 |
| [3] | Pignone M, Rich M, Teutsch SM, et al. Screening for colorectal cancer in adults at average risk:a summary of the evidence for the U.S. Preventive Services Task Force[J]. Ann Intern Med, 2002, 137(2): 132–141. DOI:10.7326/0003-4819-137-2-200207160-00015 |
| [4] | Gulliford MC, Bhattarai N, Charlton J, et al. Cost-effectiveness of universal strategy of brief dietary intervention for primary prevention in primary care:population-based cohort study and Markov model[J]. Cost Eff Resour Alloc, 2014, 12(1): 4. DOI:10.1186/1478-7547-12-4 |
| [5] | Lejeune C, Dancourt V, Arveux P, et al. Cost-effectiveness of screening for colorectal cancer in France using a guaiac test versus an immunochemical test[J]. Int J Technol Assessm Health Care, 2010, 26(1): 40–47. DOI:10.1017/S026646230999078X |
| [6] |
黄慧瑶, 石菊芳, 代敏.
中国大肠癌筛查的卫生经济学评价研究进展[J]. 中华预防医学杂志, 2015, 49(8): 747–751.
Huang HY, Shi JF, Dai M. Research progress in health economic evaluation of colorectal cancer screening in China[J]. Chin J Prev Med, 2015, 49(8): 747–751. DOI:10.3760/cma.j.issn.0253-9624.2015.08.017 |
| [7] | Frazier AL, Colditz GA, Fuchs CS, et al. Cost-effectiveness of screening for colorectal cancer in the general population[J]. JAMA, 2000, 284(15): 1954–1961. DOI:10.1001/jama.284.15.1954 |
| [8] | Vijan S, Hwang EW, Hofer TP, et al. Which colon cancer screening test? A comparison of costs,effectiveness,and compliance[J]. Am J Med, 2001, 111(8): 593–601. DOI:10.1016/S0002-9343(01)00977-9 |
| [9] | Leshno M, Halpern Z, Arber N. Cost-effectiveness of colorectal cancer screening in the average risk population[J]. Health Care Manag Sci, 2003, 6(3): 165–174. DOI:10.1023/A:1024488007043 |
| [10] | O'Leary BA, Olynyk JK, Neville AM, et al. Cost-effectiveness of colorectal cancer screening:comparison of community-based flexible sigmoidoscopy with fecal occult blood testing and colonoscopy[J]. J Gastroenterol Hepatol, 2004, 19(1): 38–47. DOI:10.1111/j.1440-1746.2004.03177.x |
| [11] | Berchi C, Bouvier V, Réaud JM, et al. Cost-effectiveness analysis of two strategies for mass screening for colorectal cancer in France[J]. Health Econom, 2004, 13(3): 227–238. DOI:10.1002/(ISSN)1099-1050 |
| [12] | Wu GHM, Wang YM, Yen AMF, et al. Cost-effectiveness analysis of colorectal cancer screening with stool DNA testing in intermediate-incidence countries[J]. BMC Cancer, 2006, 6(1): 136. DOI:10.1186/1471-2407-6-136 |
| [13] | Tappenden P, Chilcott J, Eggington S, et al. Option appraisal of population-based colorectal cancer screening programmes in England[J]. Gut, 2007, 56(5): 677–684. DOI:10.1136/gut.2006.095109 |
| [14] | Pickhardt PJ, Hassan C, Laghi A, et al. Cost-effectiveness of colorectal cancer screening with computed tomography colonography[J]. Cancer, 2007, 109(11): 2213–2221. DOI:10.1002/(ISSN)1097-0142 |
| [15] | Macafee DAL, Waller M, Whynes DK, et al. Population screening for colorectal cancer:the implications of an ageing population[J]. Br J Cancer, 2008, 99(12): 1991–2000. DOI:10.1038/sj.bjc.6604788 |
| [16] | Parekh M, Fendrick AM, Ladabaum U. As tests evolve and costs of cancer care rise:reappraising stool-based screening for colorectal neoplasia[J]. Aliment Pharmacol Ther, 2008, 27(8): 697–712. DOI:10.1111/j.1365-2036.2008.03632.x |
| [17] | Hassan C, Zullo A, Winn S, et al. Cost-effectiveness of capsule endoscopy in screening for colorectal cancer[J]. Endoscopy, 2008, 40(5): 414–421. DOI:10.1055/s-2007-995565 |
| [18] | Pickhardt PJ, Hassan C, Laghi A, et al. Clinical management of small (6-to 9-mm) polyps detected at screening CT colonography:a cost-effectiveness analysis[J]. Am J Roentgenol, 2008, 191(5): 1509–1516. DOI:10.2214/AJR.08.1010 |
| [19] | Pickhardt PJ, Hassan C, Laghi A, et al. CT colonography to screen for colorectal cancer and aortic aneurysm in the medicare population:cost-effectiveness analysis[J]. Am J Roentgenol, 2009, 192(5): 1332–1340. DOI:10.2214/AJR.09.2646 |
| [20] | Rutter CM, Savarino JE. An evidence-based microsimulation model for colorectal cancer:validation and application[J]. Cancer Epidemiol Biomarkers Prev, 2010, 19(8): 1992–2002. DOI:10.1158/1055-9965.EPI-09-0954 |
| [21] | Heresbach D, Chauvin P, Grolier J, et al. Cost-effectiveness of colorectal cancer screening with computed tomography colonography or fecal blood tests[J]. Eur J Gastroenterol Hepatol, 2010, 22(11): 1372–1379. DOI:10.1097/MEG.0b013e32833eaa71 |
| [22] | Heitman SJ, Hilsden RJ, Au F, et al. Colorectal cancer screening for average-risk North Americans:an economic evaluation[J]. PLoS Med, 2010, 7(11): e1000370. DOI:10.1371/journal.pmed.1000370 |
| [23] | Di Bidino RD, Cicchetti A, Corio M, et al. Impact of technology overlapping:a case study on colorectal cancer screening[J]. Technol Health Care, 2010, 18(4/5): 303–315. DOI:10.3233/THC-2010-0594 |
| [24] | Ladabaum U, Ferrandez A, Lanas A. Cost-effectiveness of colorectal cancer screening in high-risk Spanish patients:use of a validated model to inform public policy[J]. Cancer Epidemiol Biomarkers Prev, 2010, 19(11): 2765–2776. DOI:10.1158/1055-9965.EPI-10-0530 |
| [25] | Whyte S, Walsh C, Chilcott J. Bayesian calibration of a natural history model with application to a population model for colorectal cancer[J]. Med Decis Making, 2011, 31(4): 625–641. DOI:10.1177/0272989X10384738 |
| [26] | Hassan C, Benamouzig R, Spada C, et al. Cost effectiveness and projected national impact of colorectal cancer screening in France[J]. Endoscopy, 2011, 43(9): 780–793. DOI:10.1055/s-0030-1256409 |
| [27] | Wang ZH, Gao QY, Fang JY. Repeat colonoscopy every 10 years or single colonoscopy for colorectal neoplasm screening in average-risk Chinese:a cost-effectiveness analysis[J]. Asian Pac J Cancer Prev, 2012, 13(5): 1761–1766. DOI:10.7314/APJCP.2012.13.5.1761 |
| [28] | Greuter MJE, Xu XM, Lew JB, et al. Modeling the adenoma and serrated pathway to colorectal cancer (ASCCA)[J]. Risk Anal, 2014, 34(5): 889–910. DOI:10.1111/risa.12137 |
| [29] | Ouakrim DA, Boussioutas A, Lockett T, et al. Cost-effectiveness of family history-based colorectal cancer screening in Australia[J]. BMC Cancer, 2014, 14(1): 261. DOI:10.1186/1471-2407-14-261 |
| [30] | Whyte S, Harnan S. Effectiveness and cost-effectiveness of an awareness campaign for colorectal cancer:a mathematical modeling study[J]. Cancer Causes Control, 2014, 25(6): 647–658. DOI:10.1007/s10552-014-0366-6 |
| [31] |
李増山, 李青.
2010年版消化系统肿瘤WHO分类解读[J]. 中国病理学杂志, 2011, 40(5): 351–354.
Li ZS, Li Q. The latest 2010 WHO classification of tumors of digestive system[J]. Chin J Pathol, 2011, 40(5): 351–354. DOI:10.3760/cma.j.issn.0529-5807.2011.05.019 |
| [32] |
中国癌症基金会. 癌症早诊早治项目[EB/OL].[2016-03-15]. http://www.cfchina.org.cn/list.php?catid=118.
Cancer Foundation of China. Cancer screening program[EB/OL].[2016-03-15]. http://www.cfchina.org.cn/list.php?catid=118. |
| [33] |
代敏, 石菊芳, 李霓.
中国城市癌症早诊早治项目设计及预期目标[J]. 中华预防医学杂志, 2013, 47(2): 179–182.
Dai M, Shi JF, Li N. The design and expectation of cancer screening program in urban China[J]. Chin J Prev Med, 2013, 47(2): 179–182. DOI:10.3760/cma.j.issn.0253-9624.2013.02.018 |