 2017, Vol. 38
文章信息
- 曲红梅, 白亚娜, 魁发瑞, 胡晓斌, 裴鸿波, 任晓卫, 申希平 .
- Qu Hongmei, Bai Yana, Kui Farui, Hu Xiaobin, Pei Hongbo, Ren Xiaowei, Shen Xiping .
- 组合模型对恶性肿瘤死亡率拟合度评价及预测方法的研究
- Effect of combination model on fitting cancer mortality and prediction
- 中华流行病学杂志, 2017, 38(1): 117-120
- Chinese journal of Epidemiology, 2017, 38(1): 117-120
- http://dx.doi.org/10.3760/cma.j.issn.0254-6450.2017.01.022
-
文章历史
收稿日期: 2016-04-21


2. 730000 兰州大学公共卫生学院流行病与统计学教研室;
3. 730030 兰州, 西北民族大学医院外科
2. Center for Cancer Prevention and Control of Lanzhou University, Teaching and Research Section of Epidemiology and Biostatistics, School of Public Health, Lanzhou University, Lanzhou 730000, China;
3. Department of Surgery, The Hospital of Northwest University for Nationalities, Lanzhou 730030, China
为了解金昌队列恶性肿瘤未来发展趋势,制定切实可行的恶性肿瘤防治策略,应用6种预测方法对该队列2001-2013年恶性肿瘤死亡率拟合,并探讨恶性肿瘤预测方法,最终遴选单项模型建立组合模型并对恶性肿瘤死亡率进行趋势预测。
资料与方法应用金昌队列恶性肿瘤死亡率2001-2013年恶性肿瘤死亡率数据来建立死亡率预测模型,并预测2014-2016年恶性肿瘤死亡率。
1.模型的遴选:通过动态数列[1]、线性回归[2]、指数平滑[3]、自回归移动平均(ARIMA)模型[4]、灰色模型[GM(1,1)][5]、Joinpoint回归(Joinpoint regression)[6]6种模型进行单项模型的拟合并评价模型的方法学,遴选拟合精度较高的预测模型。恶性肿瘤死亡率与年份序列值之间呈线性关系,因此资料满足以年份序列值为自变量x,恶性肿瘤死亡率为因变量y做曲线拟合的条件。利用年份与恶性肿瘤死亡率建立Joinpoint回归,并对2001-2013年队列人群恶性肿瘤死亡率进行拟合。
2.模型评价:为了评价预测方法的准确性,即拟合的精确度,本研究采用4个误差度量指标评价拟合效果[7]:均方误差(MSE)、平均绝对误差(MAE)、平均绝对百分误差(MAPE)和拟合精度。
3.模型的优化组合:组合模型(combination model)是将≥2种模型赋予适当的权重系数进行预测,以提高预测的精度。①组合模型权重系数的计算基于算术平均法、方差倒数法、均方误差倒数法、简单加权平均法4种方法[8];②组合模型的拟合精度评价采用以上模型评价方法;③模型的预测是基于2001-2013年恶性肿瘤死亡率数据预测2014-2018年恶性肿瘤死亡率。
4.统计学分析:采用Excel 2010、SPSS 18.0软件进行动态数列、GM(1,1)、线性回归、指数平滑、ARIMA模型的预测分析。利用美国国家癌症研究所研发的Joinpoint Regression Program 4.1.1.3软件进行Joinpoint回归分析。检验水准α=0.05。
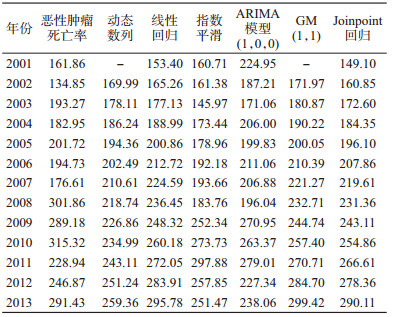
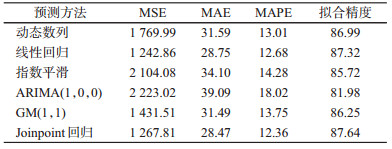
结果1.单项拟合预测方法的效果评价:采用6种单性预测方法拟合的2001-2013年恶性肿瘤死亡率见表 1。6种预测单项方法用于恶性肿瘤死亡率的预测方法的比较,Joinpoint线性回归拟合精度最高(87.64%),线性回归、动态数列、GM(1,1)、指数平滑、ARIMA模型拟合精度分别为87.32%、86.99%、86.25%、85.72%、81.98%(表 2)。
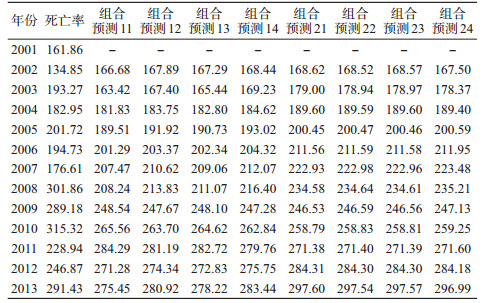
2.组合模型拟合及方法学评价:将ARIMA模型(1,0,0)与GM(1,1)、GM(1,1)与线性回归建立组合模型进行模型优化,2001-2013年恶性肿瘤死亡率组合预测模型拟合值见表 3。结果提示GM(1,1)与线性回归组合模型4种赋予权重的方法,MAE、MAPE及MSE均小于ARIMA(1,0,0)与GM(1,1)的组合方式。GM(1,1)与线性回归组合方式优于ARIMA(1,0,0)与GM(1,1)组合方式。在两种模型组合方式中,算术平均法与均方误差倒数法预测效果较好。
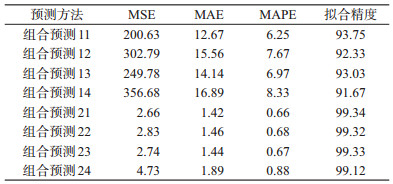
如表 4所示,恶性肿瘤死亡率组合模型预测精度>90%,均高于上述任一单项预测方法。其中基于4种权重计算法的GM(1,1)与线性回归的组合方式MSE、MAE、MAPE均小于ARIMA(1,0,0)与GM(1,1)组合方式(基于4种权重系数计算法)。GM(1,1)与线性回归的组合方式预测精度>99%,均高于ARIMA(1,0,0)与GM(1,1)组合方式。其中以基于算术平均法及均方误差倒数法的权重计算[GM(1,1)与线性回归]组合模型预测效果最好。
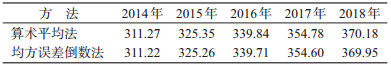
3.恶性肿瘤死亡率组合预测:组合预测中,以GM(1,1)与线性回归的组合模型拟合效果最好,故用基于算术平均法、均方误差倒数法计算的权重系数的组合模型[GM(1,1)与线性回归]预测2014-2018年金昌队列人群恶性肿瘤死亡率,预测结果见表 5、图 1。

|
| 注:CM为组合预测 图 1 组合模型用于2001-2013年金昌队列恶性肿瘤 |
近年来,国内外有许多学者在恶性肿瘤死亡率的预测中使用多种单项预测方法。如动态数列平均增长速度[1]、线性回归[2]、曲线拟合[9]、指数平滑[3, 10]、ARIMA模型[4, 10]、GM(1,1)[5, 11-12]等,取得了较好的预测效果。其中动态数列平均增长速度、线性回归是恶性肿瘤趋势分析常用的方法,指数平滑、GM(1,1)、ARIMA模型、Joinpoint回归分析却较少应用[6, 13-15]。
本研究Joinpoint回归拟合精度达到87.64%,线性回归、动态数列、GM(1,1)、指数平滑、ARIMA模型(1,0,0,)预测精度分别为87.32%、86.99%、86.25%、85.72%、81.98%。队列恶性肿瘤死亡率数据波动大,故在预测中指数平滑预测效果优于ARIMA模型(1,0,0),且因隐含指数规律,故GM(1,1)预测效果较好。本研究Joinpoint回归模型拟合精度大于GM(1,1)、指数平滑法,与线性回归法拟合精度相当。Joinpoint回归分析是将年份死亡率曲线分为若干有统计学意义的区段,并对死亡率进行分段分析,分析开始于最小的折点,检验是否有一个或者更多个折点有统计学意义,双侧检验P<0.05认为折点有统计学意义。在2001-2013年金昌队列人群恶性肿瘤死亡率分析中,有0个折点,年份死亡率曲线均未被分段。国内外少数学者将Joinpoint回归分析用于癌症死亡率及发病率的研究[16-17]。Joinpoint回归也提供了年百分比的变化(APC)、平均年百分比变化(AAPC)等指标。此外,还考虑年龄对死亡率或发病率的影响,将直线按年龄分段计算斜率或APC。因此,Joinpoint分析比传统线性回归更有实际意义。
本研究组合预测中,GM(1,1)与线性回归组合方式优于ARIMA模型(1,0,0)与GM(1,1)组合方式。不同曲线类型组合而成的模型精度高于同类型曲线的组合模型精度。GM(1,1)与线性回归组合、ARIMA模型(1,0,0)与GM(1,1)的组合中,算术平均法与均方误差倒数法权重的计算预测效果较好[18]。在以往恶性肿瘤预测中,组合模型应用较少[9-10, 19],且组合模型权重的计算多用Saaty权重法[10]。其他领域组合模型研究表明[19-20],组合模型精度高的先决条件,首先是参与组合的模型不是越多越好,模型数量为2~5个。故本研究选取了2种单项模型进行组合。均为GM(1,1)(指数曲线)与线性回归(线性)的组合优于其他组合方式。另外,组合模型权重系数的计算也很关键。本研究恶性肿瘤死亡率预测中,组合模型算术平均法与均方误差倒数法误差较小,预测效果优于单项预测法。
总之,本研究遴选出拟合精度较好的预测方法仅适合于金昌队列2001-2013年这个时段,因恶性肿瘤的发生和死亡受多种因素的影响,且有长期变化趋势,故随着时间变化,还需探讨不同的预测模型。
利益冲突: 无
| [1] |
鲍俊屹, 白亚娜, 尚慧, 等.
某职业队列人群中老年肺癌患者分布特征10年变化趋势[J]. 中国老年学杂志 , 2014, 34(21) : 6166–6168.
Bao JY, Bai YN, Shang H, et al. 10-year trend of the distribution characteristics of an occupational cohort of elderly patients with lung cancer[J]. Chin J Gerontol , 2014, 34(21) : 6166–6168. DOI:10.3969/j.issn.1005-9202.2014.21.104 |
| [2] |
高姗.上海市区原发性肝癌的流行病学研究[D].上海:复旦大学, 2011.
Gao S. Epidemiological studies of primary liver cancer in urban Shanghai[D]. Shanghai:Fudan University, 2011. |
| [3] |
杨昌跃.大姚县青石棉污染区肺癌和间皮瘤死亡率的调查及其趋势预测[D].成都:四川大学, 2005.
Yang CY. Study on mortality and its trends of lung cancer and mesothelioma in the crocidolite contamiated area in Dayao county[D]. Chengdu:Sichuan University, 2005. |
| [4] |
何庭辉, 柳青.
广州市荔湾区恶性肿瘤死亡率时间序列预测模型分析[J]. 疾病控制杂志 , 2006, 10(6) : 630–632.
He TH, Liu Q. Analysis on the predictive model of the time series of cancer mortality in Liwan district, Guangzhou[J]. Chin J Dis Control Prev , 2006, 10(6) : 630–632. DOI:10.3969/j.issn.1674-3679.2006.06.025 |
| [5] |
洪光烈, 宋红兵, 汪丛峰, 等.
基于灰色数列GM (1, 1)模型的恶性肿瘤死亡趋势的预测及分析[J]. 中国肿瘤 , 2011, 20(7) : 503–505.
Hong GL, Song HB, Wang CF, et al. A study of GM (1, 1) model for predicting the mortality trends of malignant tumors[J]. China Cancer , 2011, 20(7) : 503–505. |
| [6] | Ilic M, Ilic I. Gynaecological cancer mortality in Serbia, 1991-2010:a joinpoint regression analysis[J]. Asian Pacific J Cancer Prev , 2015, 16(1) : 157–162. DOI:10.7314/APJCP.2015.16.1.157 |
| [7] |
蒋传进.基于模型遴选规则的自适应组合预测研究[D].上海:东华大学, 2014.
Jiang CJ. The research of adaptive combination forecasting based on rule guildline of selecting models[D]. Shanghai:Donghua University, 2014. |
| [8] |
戴华娟.组合预测模型及其应用研究[D].长沙:中南大学, 2007.
Dai HJ. Combination forecasting model and application research[D]. Changsha:Central SouthUniversity, 2007. |
| [9] |
韩兢, 王洁贞, 胡平, 等.
恶性肿瘤死亡率预测模型的探讨[J]. 中国卫生统计 , 1998, 15(5) : 5–8.
Han J, Wang JZ, Hu P, et al. An inquiry of the forecast model of malignant tumor mortality[J]. Chin J Health Stat , 1998, 15(5) : 5–8. |
| [10] |
陈勇.启东1972-2001年恶性肿瘤发病趋势分析及预测模型研究[D].南京:南京医科大学, 2005.
Chen Y. Trend analysis and prediction model of malignant tumor in Qidong 1972-2001[D]. Nanjing:Nanjing Medical University, 2005. |
| [11] |
孙彬, 何穗智.
灰色系统残差与Verhulst模型预测恶性肿瘤死亡[J]. 预防医学情报杂志 , 2011, 27(8) : 604–607.
Sun B, He SZ. Application of the grey system residual error model and grey Verhulst model on forecasting malignant tumor death[J]. J Prev Med Inf , 2011, 27(8) : 604–607. |
| [12] |
潘凤莲, 陈哲.
GM (1, 1)模型在子宫颈癌死亡率预测中的应用[J]. 海南医学院报 , 2013, 19(1) : 92–95.
Pan FL, Chen Z. Application of GM (1, 1) model in predicting mortality rate of cervical cancer[J]. J Hainan Med Univ , 2013, 19(1) : 92–95. DOI:10.13210/j.cnki.jhmu.2013.01.031 |
| [13] | Cayuela A, Rodríguez-Domínguez S, López-Campos JL, et al. Joinpoint regression analysis of lung cancer mortality, Andalusia 1975-2000[J]. Ann Oncol , 2004, 15(5) : 793–796. DOI:10.1093/annonc/mdh170 |
| [14] |
王庆生, 陈万青, 郑荣寿, 等.
癌症年龄别发病率的Joinpoint线性回归分析及其在癌症防控中的意义[J]. 中国肿瘤 , 2013, 22(3) : 180–185.
Wang QS, Chen WQ, Zheng RS, et al. Joinpoint linear regression analysis of cancer age-specificincidence rate and its significance for cancer control[J]. Chin Cancer , 2013, 22(3) : 180–185. DOI:10.11735/j.issn.1004-0242.2013.03.A201302046 |
| [15] |
陈万青, 郑荣寿, 曾红梅, 等.
中国恶性肿瘤发病趋势分析和预测[J]. 中华预防医学杂志 , 2012, 46(7) : 581–586.
Chen WQ, Zheng RS, Zeng HM, et al. Trend analysis and prediction of cancer incidence in China[J]. Chin J Prev Med , 2012, 46(7) : 581–586. DOI:10.3760/cma.j.issn.0253-9624.2012.07.002 |
| [16] | Dehkordi ZF, Tazhibi M, Babazade S. Application of joinpoint regression in determining breast cancer incidence rate change points by age and tumor characteristics in women aged 30-69(years) and in Isfahan city from 2001 to 2010[J]. J Educ Health Promot , 2014, 3 : 115. DOI:10.4103/2277-9531.145917 |
| [17] | López-Campos JL, Ruiz-Ramos M, Soriano JB. Mortality trends in chronic obstructive pulmonary disease in Europe, 1994-2010:a joinpoint regression analysis[J]. Lancet Respir Med , 2014, 2(1) : 54–62. DOI:10.1016/S2213-2600(13)70232-7 |
| [18] |
唐小我.
最优组合预测方法及其应用[J]. 数理统计与管理 , 1992, 11(1) : 31–35.
Tang XW. The optimal combined forecasting method and its application[J]. Appl Stat Manag , 1992, 11(1) : 31–35. DOI:10.13860/j.cnki.sltj.1992.01.007 |
| [19] |
陈亦新, 田辉.
应用组合模型分析预测恶性肿瘤死亡率[J]. 黑龙江医学 , 2000(5) : 24–25.
Chen YX, Tian H. Analysis and prediction malignant tumor mortality by combination model[J]. Heilongjiang Med J , 2000(5) : 24–25. DOI:10.3969/j.issn.1004-5775.2000.05.024 |
| [20] |
姜明辉.商业银行个人信用评估组合预测方法研究[D].哈尔滨:哈尔滨工业大学, 2006.
Jiang MH. Study on combining forecast methods for personal credit evaluation in commercial banks[D]. Harbin:Harbin Institute of Technology, 2006. |