 2016, Vol. 37
文章信息
- 胡强, 江朝强, 张维森, 郑家强, 徐琳, 靳雅丽, 饶穗丽, 郑海清, 林大庆 .
- Hu Qiang, Jiang Chaoqiang, Zhang Weisen, Cheng Karkeung, Xu Lin, Jin Yali, Rao Suili, Zheng Haiqing, Lam Taihing .
- 广州市中老年人体脂率与常规肥胖指标相关性及其对应值的研究
- Correlation between body fat percentage and general obesity indexes in middle aged and old people in Guangzhou
- 中华流行病学杂志, 2016, 37(10): 1341-1344
- CHINESE JOURNAL OF EPIDEMIOLOGY, 2016, 37(10): 1341-1344
- http://dx.doi.org/10.3760/cma.j.issn.0254-6450.2016.10.005
-
文章历史
收稿日期: 2016-03-14


2. 英国伯明翰大学公共卫生与流行病学系;
3. 999077 香港大学公共卫生学院
2. Department of Public Health and Epidemiology, University of Birmingham, UK;
3. Department of Community Medicine, School of Public Health, University of Hong Kong, Hong Kong 999077, China
肥胖是目前全球性健康问题[1-2]。而临床上诊断肥胖的关键是需要确定一个合适的体脂水平界值。据WHO报告[3],与欧洲白种人相比,亚洲人群在较低的BMI水平即表现出较高的糖尿病、心血管疾病患病风险。韩国学者对韩国成年男性的研究提示,体脂率(BFP)较BMI是诊断心血管代谢紊乱更重要的指标[4]。目前国际上一直沿用WHO提出的男性<25%和女性<35%作为BFP适宜参考值[5],而此切点值是对应于BMI为30 kg/m2的白种人[6-7],并不适用于中国人群,且目前国内尚缺乏相应的BFP适宜参考值。为此,本研究利用“广州生物库队列研究”基线数据,分析BFP与BMI、腰围(WC)、腰臀比(WHR)等常规肥胖判定指标的相关性,探讨适宜于我国中老年人群的BFP切点值。
对象与方法1. 研究对象:本研究数据基于“广州生物库队列研究”(GBCS)平台[8-9]。GBCS选取广州市尊老康乐协会中年龄≥50岁,能自行到广州医科大学附属第十二人民医院,并自愿参加免费体检和接受健康问卷调查的广州市居民,2003-2008年分三期招募30 518名。从第3期始GBCS增加BFP检测,其中接受BFP检测且一般人口学资料完整者共计7 751人,本研究选择其中相对健康者作为研究对象。参照先前研究[10],入组条件判定为年龄50~85岁,在过去6个月内无住院记录,无自报高血压、糖尿病、冠心病、肿瘤、慢性支气管炎、精神疾病,且未服用阿司匹林、降压药、降糖药者。最终共纳入研究对象3 490(男性797、女性2 693)人。GBCS经广州市医学伦理学会审查批准,研究对象均签署知情同意书。
2. 研究方法:采用电子化问卷调查获得基本资料,内容包括一般人口特征、社会经济状况(文化程度、职业、个人年收入)、生活方式(体力活动及吸烟、饮酒情况)等。问卷调查由6~8名有医学背景并受过专门培训合格的助理护士完成。受试者按常规采用量尺测量身高,并精确到0.1 cm;采用生物电阻抗人体脂肪测量仪(百利达 BF-350,日本)测量体重和BFP,体重读数精确到0.1 kg,BFP读数精确到0.1%;取受试者髋最高点和肋下缘最低点,利用皮尺测量WC;取受试者臀大肌最凸处测量臀围,读数精确到0.1 cm。对其中348名研究对象分别测量餐前和餐后BFP,其组内相关系数(ICC)为0.928,提示使用生物电阻抗法测量BFP稳定性良好。
3. 相关指标定义: ①吸烟指目前吸烟且达一年以上或戒烟未满一年;不吸烟指目前不吸烟或吸烟未达一年;戒烟指以前吸烟,但现在不吸烟达一年以上。②饮酒指过去一年内至少每月饮一次白酒、啤酒或其他酒精饮料;不饮酒指从未饮酒或过去一年饮酒每月少于一次;戒酒指既往有饮酒但过去一年未饮酒。③体力活动划分采用WHO提供的国际体力活动问卷(IPAQ),根据其活动强度和代谢能量(MET)分为不足、中等和活跃3个等级。
4. 统计学分析: 采用SPSS 19.0软件进行统计学分析。一般人口学特征、计量资料用x±s表示,性别间比较采用独立样本t检验;计数资料的性别构成比较采用 χ2检验。研究对象随机平分为预测组和验证组。预测组用于建立BFP预测方程,推算适宜BFP;验证组用于验证预测所得适宜BFP切点值的合理性。BMI、WC和WHR与BFP的关系通过曲线拟合分析确定最佳回归模型。另外采用单因素线性回归分析判定性别、年龄、体力运动、吸烟、饮酒等对BFP的影响,再根据确定的BFP与BMI、WC和WHR各自关系的拟合回归模型,引入性别、年龄、体力活动、饮酒和吸烟等因素进行逐步回归分析确定最后的BFP预测方程。利用ROC曲线下面积分析判定预测BFP最适宜指标。显著性或选入模型标准为P<0.05。
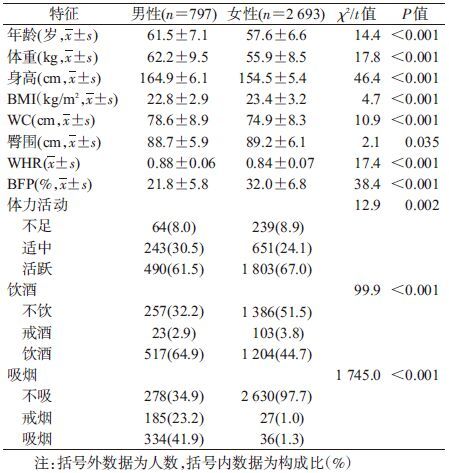
结果1. 一般特征:3 490名研究对象中男性平均年龄大于女性4岁;男性身高和体重均大于女性,但女性BMI和BFP均显著高于男性,BFP(%)平均为29.7(95%CI:29.4~29.9),其中男性为21.8(95%CI:21.4~22.2),女性为32.0(95%CI:31.8~32.3);男性饮酒率和吸烟率均显著高于女性(P<0.001);男性和女性体力活动活跃者均超过60%(表 1)。
2. 回归方程的建立:
(1)单因素回归分析:将预测组按性别分层后以BFP为因变量,分别以BMI、WC、WHR、年龄、体力活动、吸烟和饮酒为自变量进行单因素线性回归分析,结果显示无论男性或女性,仅BMI、WC、WHR、年龄对BFP的影响有统计学意义(P<0.01),体力活动、吸烟、饮酒对BFP的影响无统计学意义。
(2)多元回归方程分析:通过曲线拟合分析发现二次方程能更好描述BMI与BFP的关系。通过生成变量BMI2,以BFP为因变量,BMI、BMI2、性别、年龄、体力活动、吸烟、饮酒为自变量进行多因素线性逐步回归分析,结果显示,年龄、体力活动、吸烟、饮酒对BFP的影响无统计学意义,最终进入模型的自变量有BMI、BMI2、性别。回归方程为BFP(%)=(-23.47-8.87×性别)+2.94×(BMI)-0.024×(BMI)2,其中性别男性赋值为1,女性赋值为0。以此模型建立的回归方程推算,得出用BMI(kg/m2)反映肥胖程度的各切点值为18.5、24、25、28和30,对应的BFP(%)分别为男性13.8、24.3、26.1、31.1和34.2,女性22.7、33.2、35.0、40.0和43.0。模型确定系数R2=0.805,表明采用此模型能够解释广州市中老年人群BFP约80.5%的变异。
经曲线拟合分析发现WC、WHR与BFP呈直线关系,通过多因素逐步回归,得出WC与BFP的回归方程为BFP(%)=(-3.66-11.6×性别)+0.56×(WC)-0.11×年龄,其中男性WC=90 cm时对应的BFP为28.7%,女性WC=80 cm时对应的BFP为34.7%,R2=0.657;WHR与BFP的回归方程为BFP(%)=(-1.86-11.5×性别)+48.6×(WHR)-0.12×年龄,其中男性WHR=0.9所对应的BFP为23.3%,女性WHR=0.85所对应的BFP为32.3%,R2=0.437。
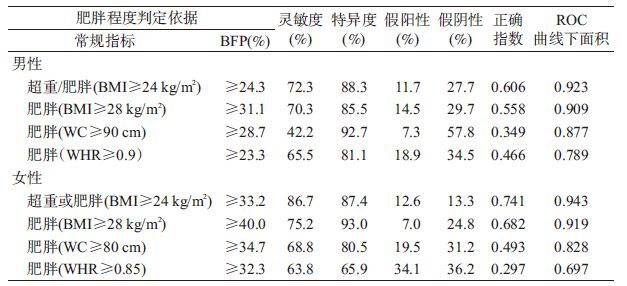
3. 基于BMI、WC、WHR确定BFP的切点值对肥胖判定的灵敏度和特异度:利用验证组分别以BMI、WC、WHR各切点值作为判定肥胖程度的金标准,BFP对应切点值为诊断标准进行筛检试验。表 2显示,基于BMI为24 kg/m2(超重)预测所得的BFP进行肥胖程度判断,ROC曲线下面积最大,男性为0.923,女性为0.943;灵敏度和特异度分别为男性72.3%、88.3%;女性86.7%、87.4%。
虽然BMI是用于判断肥胖程度和预测人群健康风险的常用指标,但不能区分人体脂肪重量和肌肉重量。而BFP却能弥补其不足,且能反映性别间差异。以往研究将男性BFP>25%、女性BFP>35%作为诊断标准用于临床和流行病学研究[11-14],但此切点值只是对应于BMI为30 kg/m2的白种人。大量研究表明与欧洲人群相比,同一BMI水平亚洲人群有相对较高的BFP[13, 15-16]。由于种族差异以及BMI判定肥胖标准的不同,此切点值显然不适用于中国人群。
本研究采用曲线优度拟合和多元逐步回归模型建立BFP与BMI的回归方程,发现BMI与BFP呈二次方程关系,且有性别差异,与相关研究结果基本一致[13, 17-19]。本研究分析发现BFP与BMI的相关性最好,所得的回归方程决定系数最大,以BFP和BMI判定肥胖程度的一致性(灵敏度、特异度)和ROC曲线下面积均最大,说明BFP与BMI的相关性和判定肥胖程度的一致性最好。
本研究中BMI切点值24 kg/m2和28 kg/m2所对应的BFP分别为男性≥24.3%和31.1%,女性≥33.2%和40.0%。显示BMI在25 kg/m2所对应的BFP分别为男性26.1%、女性35.0%。而Chang等[13]对我国台湾地区20岁以上成年人的研究结果表明,BMI 25 kg/m2所对应的BFP男性为25%,女性为38%,分别略低和稍高于本研究切点值。基于BMI≥30 kg/m2为肥胖标准而提出的BFP切点值,本研究男性为34.2%,女性为43.0%,均高于越南研究结果(男女性分别为30%和40%)[17]。Chen等[20]对我国香港地区41~63岁中老年妇女研究发现,BMI切点值24 kg/m2和28 kg/m2所对应的BFP分别为35.9%和39.5%,与本研究结果基本一致。
本研究有局限性。首先,研究对象源自广州市50岁及以上中老年人群,而BFP与年龄有关[17-18],其结果不能外推到其他年龄段人群;其次,研究对象均生活在经济较发达的广州市,其结论不一定适应于农村地区和北方人群;再者,本文的BFP切点值是基于BMI而获得,该参考值能否很好预测人群健康风险,尤其是肥胖相关疾病,有待进一步证实。
总之,BMI与BFP具有良好的相关性,基于BMI≥24 kg/m2为中国人群超重标准,其对应的广州市中老年人BFP切点值分别为男性24.0%,女性33.0%。
| [1] | Ng M, Fleming T, Robinson M, et al. Global,regional,and national prevalence of overweight and obesity in children and adults during 1980-2013:a systematic analysis for the Global Burden of Disease Study 2013[J]. Lancet , 2014, 384 (9945) : 766–781 DOI:10.1016/S0140-6736(14)60460-8 |
| [2] | Kelly T, Yang W, Chen CS, et al. Global burden of obesity in 2005 and projections to 2030[J]. Int J Obes (Lond) , 2008, 32 (9) : 1431–1437 DOI:10.1038/ijo.2008.102 |
| [3] | WHO Expert Consultation. Appropriate body-mass index for Asian populations and its implications for policy and intervention strategies[J]. Lancet , 2004, 363 (9403) : 157–163 DOI:10.1016/S0140-6736(03)15268-3 |
| [4] | Cho YG, Song HJ, Kim JM, et al. The estimation of cardiovascular risk factors by body mass index and body fat percentage in Korean male adults[J]. Metabolism , 2009, 58 (6) : 765–771 DOI:10.1016/j.metabol.2009.01.004 |
| [5] | No authors listed. Physical status:the use and interpretation of anthropometry. Report of a WHO expert committee[J]. World Health Organ Tech Rep Ser , 1995, 854 : 1–452 |
| [6] | Deurenberg P, Weststrate JA, Seidell JC. Body mass index as a measure of body fatness:age-and sex-specific prediction formulas[J]. Br J Nutr , 1991, 65 (2) : 105–114 DOI:10.1079/BJN19910073 |
| [7] | Deurenberg P, Yap M, van Staveren WA. Body mass index and percent body fat:a meta analysis among different ethnic groups[J]. Int J Obes Relat Metab Disord , 1998, 22 (12) : 1164–1171 DOI:10.1038/sj.ijo.0800741 |
| [8] | Jiang CQ, Thomas GN, Lam TH, et al. Cohort profile:the Guangzhou Biobank cohort study,a Guangzhou-Hong Kong-Birmingham collaboration[J]. Int J Epidemiol , 2006, 35 (4) : 844–852 DOI:10.1093/ije/dyl131 |
| [9] | Kavikondala S, Schooling CM, Jiang CQ, et al. Pathways to obesity in a developing population:the Guangzhou Biobank Cohort Study[J]. Int J Epidemiol , 2009, 38 (1) : 72–82 DOI:10.1093/ije/dyn221 |
| [10] | 许少君, 江朝强, 张维森, 等. 中老年人自评健康与轻度认知障碍的相关性[J]. 中国慢性病预防与控制 , 2015, 23 (2) : 96–100 Xu SJ, Jiang CQ, Zhang WS, et al. Correlation between self-rating health and mild cognitive impairment in middle-aged and elderly residents[J]. Chin J Prev Control Chron Dis , 2015, 23 (2) : 96–100 |
| [11] | He M, Tan KCB, Li ETS, et al. Body fat determination by dual energy X-ray absorptiometry and its relation to body mass index and waist circumference in Hong Kong Chinese[J]. Int J Obes Relat Metab Disord , 2001, 25 (5) : 748–752 DOI:10.1038/sj.ijo.0801612 |
| [12] | Deurenberg-Yap M, Chew SK, Deurenberg P. Elevated body fat percentage and cardiovascular risks at low body mass index levels among Singaporean Chinese,Malays and Indians[J]. Obes Rev , 2002, 3 (3) : 209–215 DOI:10.1046/j.1467-789X.2002.00069.x |
| [13] | Chang CJ, Wu CH, Chang CS, et al. Low body mass index but high percent body fat in Taiwanese subjects:implications of obesity cutoffs[J]. Int J Obes Relat Metab Disord , 2003, 27 (2) : 253–259 DOI:10.1038/sj.ijo.802197 |
| [14] | Romero-Corral A, Somers VK, Sierra-Johnson J, et al. Accuracy of body mass index in diagnosing obesity in the adult general population[J]. Int J Obes (Lond) , 2008, 32 (6) : 959–966 DOI:10.1038/ijo.2008.11 |
| [15] | Deurenberg-Yap M, Schmidt G, van Staveren WA, et al. The paradox of low body mass index and high body fat percentage among Chinese,Malays and Indians in Singapore[J]. Int J Obes Relat Metab Disord , 2000, 24 (8) : 1011–1017 DOI:10.1038/sj.ijo.0801353 |
| [16] | Wang J, Thornton JC, Russell M, et al. Asians have lower body mass index (BMI) but higher percent body fat than do whites:comparisons of anthropometric measurements[J]. Am J Clin Nutr , 1994, 60 (1) : 23–28 |
| [17] | Ho-Pham LT, Lai TQ, Nguyen MTT, et al. Relationship between body mass index and percent body fat in vietnamese:implications for the diagnosis of obesity[J]. PLoS One , 2015, 10 (5) : e127198 DOI:10.1371/journalPone.0127198 |
| [18] | Meeuwsen S, Horgan GW, Elia M. The relationship between BMI and percent body fat,measured by bioelectrical impedance,in a large adult sample is curvilinear and influenced by age and sex[J]. Clin Nutr , 2010, 29 (5) : 560–566 DOI:10.1016/j.clnu.2009.12.011 |
| [19] | Pasco JA, Nicholson GC, Brennan SL, et al. Prevalence of obesity and the relationship between the body mass index and body fat:cross-sectional,population-based data[J]. PLoS One , 2012, 7 (1) : e29580 DOI:10.1371/journal.pone.0029580 |
| [20] | Chen YM, Ho SC, Lam SSH, et al. Validity of body mass index and waist circumference in the classification of obesity as compared to percent body fat in Chinese middle-aged women[J]. Int J Obes , 2006, 30 (6) : 918–925 DOI:10.1038/sj.ijo.0803220 |