 2016, Vol. 37
文章信息
- 齐金蕾, 王黎君, 周脉耕, 刘韫宁, 刘江美, 刘世炜, 曾新颖, 殷鹏.
- Qi Jinlei, Wang Lijun, Zhou Maigeng, Liu Yunning, Liu Jiangmei, Liu Shiwei, Zeng Xinying, Yin Peng.
- 1990-2013年中国男性前列腺癌疾病负担分析
- Disease burden of prostate cancer among men in China, from 1990 to 2013
- 中华流行病学杂志, 2016, 37(6): 778-782
- Chinese Journal of Epidemiology, 2016, 37(6): 778-782
- http://dx.doi.org/10.3760/cma.j.issn.0254-6450.2016.06.007
-
文章历史
- 投稿日期: 2016-03-04


2. 100050 北京, 中国疾病预防控制中心慢性非传染性疾病预防控制中心综合防控与评价室;
3. 100050 北京, 中国疾病预防控制中心慢性非传染性疾病预防控制中心
2. Division of Integrated Prevention and Evaluation, Chinese Center for Disease Control and Prevention, Beijing 100050, China;
3. National Center for Chronic and Noncommunicable Disease Control and Prevention, Chinese Center for Disease Control and Prevention, Beijing 100050, China
前列腺癌是全世界男性生殖系统常见的恶性肿瘤之一[1],根据全球肿瘤统计数据结果显示(GLOBOCAN 2012),2012年全球估计约有110万新发前列腺癌病例,在男性恶性肿瘤中排名第二位。前列腺癌在不同地区分布有一定差异,2012年发达国家前列腺癌标化发病率及死亡率分别为69.5/10万和10.0/10万,发展中国家和不发达国家的标化发病率及死亡率分别为14.5/10万和6.6/10万[2]。既往文献报道,我国男性前列腺癌发病及死亡均处于较低水平,但呈现逐年上升趋势[3, 4, 5]。为描述和分析我国1990年及2013年前列腺癌的发病和死亡情况及发展趋势,重点关注前列腺癌伤残和早死造成的疾病负担及其变化情况,本研究利用2013年全球疾病负担研究(GBD2013)中国分省疾病负担研究项目数据进行分析,为我国前列腺癌防治工作提供科学依据。
资料与方法1. 资料来源:数据来源于GBD2013中国分省部分,该研究利用多方可靠的、具有代表性的数据来源,利用统一、可比的方法全面分析1990-2013年多个国家的疾病负担,具体研究背景及方法参见文献[6, 7, 8, 9]。中国的发病数据来源于全国肿瘤登记数据和文献检索,GBD2013通过登记的完整性和资料的可靠性统一评价1990-2013年肿瘤登记资料质量,选取完整性和可靠性较好的登记处资料进行汇总分析;死亡数据主要来源全国疾病监测点系统死因监测、全国妇幼卫生监测网、中国CDC死因登记报告信息系统、全国肿瘤登记数据以及澳门地区和香港地区死因数据[8]。
2. 疾病分类与编码:死因数据先后采用《疾病和有关健康问题的国际统计分类》ICD-9和ICD-10进行编码,本研究按照GBD死因分类进行重新归类。前列腺癌编码范围:ICD-10(C61-C61.9,D29.1,D40.0),ICD-9(185-185.9,222.2,236.5)。测量指标:由于人群中前列腺癌发病率很难准确获得,而前列腺癌死亡率相对准确,且前列腺癌死亡发病比(mortality incidence ratio,MI ratio)相对稳定。因此,在相关研究中多采用MI ratio即利用死亡率估算该人群的发病率。GBD2013研究利用我国不同年份肿瘤监测点登记资料中前列腺癌发病和死亡数据,计算监测人群的发病率和死亡率,MI Ratio=死亡率/发病率,计算出不同省份、不同年龄别、性别和不同年份的肺癌死亡发病比,利用中国CDC死因登记报告信息系统死亡数据估算不同年份、地区分年龄组、前列腺癌发病数据,具体方法见文献[6]。采用伤残调整寿命年(DALY)、过早死亡损失寿命年(YLL)、伤残损失寿命年(YLD)作为测量前列腺癌造成的疾病负担指标,主要计算公式:DALY= YLL+ YLD,YLL估算方法为不同年龄组前列腺癌死亡数乘以对应分组的期望寿命值,YLD估算方法为不同年龄组患病例数乘以伤残权重,具体方法见文献[7, 10]。年龄别YLL率、YLD率和DALY率的计算为各年龄组“损失生命年数”除以该年龄组的人口数。
3. 数据分析:本研究利用前列腺癌发病数、死亡数、标化发病率、标化死亡率和前列腺癌死亡数占男性恶性肿瘤死亡数的比例等指标分析1990-2013年中国男性前列腺癌发病和死亡变化情况,并利用DALY 、YLL、YLD及其标化率和前列腺癌造成的疾病负担占男性恶性肿瘤的疾病负担的比例等指标分析前列腺癌从发病到死亡所造成的疾病负担及变化趋势。前列腺癌是老年男性的常见恶性肿瘤,50岁以下病例少见,因此在计算年龄别发病率及死亡率等指标时共划分为8组(0~、50~、55~、60~、65~、70~、75~、≥80岁组)。为保证数据具有可比性,采用GBD2013世界标准人口对1990年和2013年的前列腺癌发病率、死亡率、DALY率、YLL率和YLD率分别进行标化[8, 9]。
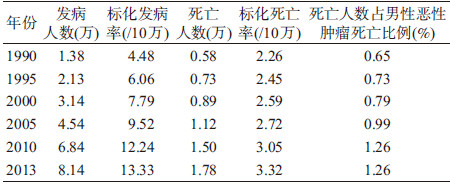
结果1. 前列腺癌发病及死亡情况:2013年我国男性因前列腺癌发病例数达8.14万,较1990年的1.38万例增加490.27%;标化发病率由1990年的4.48/10万增至2013年的13.33/10万,增加197.54%。我国前列腺癌的死亡人数逐年增加,与1990年相比,2013年的死亡人数增加206.86%,标化死亡率也由1990年的2.26/10万增至3.32/10万,增加46.90%;前列腺癌死亡数占男性恶性肿瘤死亡数的比例也逐年增加,从1990年的0.65%增至2013年的1.26%,增加93.84%,各项指标均呈现逐年递增趋势(表 1)。
2. 年龄组发病及死亡变化趋势:0~49岁的男性发病率较低,随着年龄增长,发病率明显升高,≥80岁的男性前列腺癌发病率最高。前列腺癌发病率从1990年的0.51/10万增至2013年的1.30/10万,增加154.90%;≥80岁年龄组增加202.29%;65~69岁组增幅最大,为228.65%(1990年:17.76/10万;2013年:27.63/10万),见图 1。

|
| 图 1 1990年和2013年中国不同年龄组男性前列腺癌发病率变化比较 |
1990年和2013年我国男性前列腺癌死亡率均随着年龄的增长而升高,0~49岁组死亡率最低,≥80岁组死亡率最高(图 2),与1990年相比,2013年我国50岁以下年龄组男性前列腺癌死亡率增长相对缓慢,由1990年的0.04/10万增至0.05/10万,增加27.79%;≥80岁年龄组死亡变化幅度最大,为58.56%(1990年:49.15/10万;2013年:77.93/10万)。
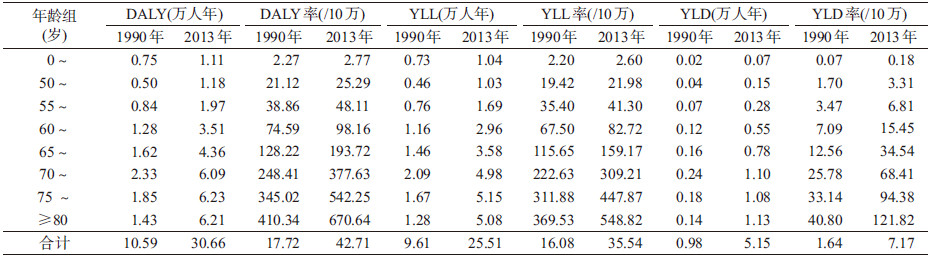
3. 前列腺癌造成的疾病负担:1990年我国男性前列腺癌造成的DALY 、YLL和YLD分别为10.59、9.61和0.98万人年,与之相比,2013年三类指标分别增加189.43%(30.66万人年)、165.37%(25.51万人年)和425.56%(5.15万人年)。DALY标化率由1990年的33.60/10万增至2013年的50.31/10万,增加49.73%;YLD标化率上升速度较快,增加168.78%(1990年3.21/10万,2013年8.62/10万)。与1990年相比,2013年前列腺癌造成的DALY占男性恶性肿瘤造成的DALY比例也存在明显变化,其变化值为0.48,增加120.11%,年增长率为1.03%;前列腺癌造成的YLL占男性恶性肿瘤造成的YLL比例从3.04%增至7.77%,增加155.90%,年增长率为1.04%,见表 2。

|
| 图 2 1990年和2013年中国不同年龄组男性前列腺癌死亡率变化比较 |

4. 年龄组疾病负担指标变化:0~49岁年龄组各项指标均最低,DALY、YLL和YLD在70~79岁组达到最高值,≥80岁略有下降,见表 3。与1990年相比,2013年各指标在不同年龄组均有明显增加,1990-2013年DALY增加20.07万人年,见表 2。
前列腺癌是目前全世界男性最常见的恶性肿瘤之一。2012年全球男性恶性肿瘤中,前列腺癌排名第二位。澳大利亚和新西兰的前列腺癌发病率和死亡率居全球首位,分别为111.6/10万和12.9/10万,亚洲东部地区的发病率和死亡率分别为10.5/10万和3.1/10万。与之相比,2013年我国男性前列腺癌的标化发病率略低于东亚地区平均水平,标化死亡率略高于该水平,但标化发病率及标化死亡率均低于全球平均水平[2]。2014年美国癌症统计报道,美国前列腺癌发病数量居男性恶性肿瘤首位,占所有男性恶性肿瘤构成的27%;前列腺癌死亡率排列男性恶性肿瘤死亡率第二位,其死亡数占男性恶性肿瘤死亡的比例约为10%[11],而2013年我国前列腺癌死亡数所占男性恶性肿瘤的构成为1.26%。
从全球范围来看,我国属于前列腺癌低发国家,但研究结果显示,许多发达国家前列腺癌的死亡率已呈逐年下降趋势,包括美国北部、大洋洲、欧洲地区北部和西部等地区[12],而我国男性前列腺癌发病例数、死亡人数、标化发病率及死亡率均呈现逐年快速增加趋势,从1990-2013年间前列腺癌发病数和死亡数上升幅度高达490.27%和206.86%。因此如何制定相应的防治策略和措施,控制前列腺癌的发病及死亡刻不容缓。
此外,随着前列腺癌发病例数和死亡人数的不断增加,所造成的DALY、YLL、YLD及其标化率均逐年增加,对我国社会经济及医疗卫生带来沉重负担。本研究结果显示,1990-2013年前列腺癌占所有男性恶性肿瘤造成的疾病负担比例也逐年上升,DALY、YLL和YLD的构成变化也存在一定差异,DALY从1990年的0.40%增至2013年的0.88%,增加120.11%,而YLL从3.04%增至7.77%,增加155.90%,提示尽管我国男性前列腺癌病例的筛查能力逐年提高,新发病例逐年增加,但早诊断早治疗水平仍落后于发达国家,病例被诊断出来时多为疾病中晚期病变[13],导致因患有前列腺癌早死所致的寿命损失年逐年增加且涨幅较快。我国部分经济发达地区研究结果显示,前列腺癌病例在当地三级医疗机构接受治疗的5年生存率仅为72.6%[14],远低于其他发达国家(如2005-2011年美国前列腺癌病例的5年生存率高达98.9%[15])。
本研究对不同年龄组人群分析发现,前列腺癌发病和死亡主要集中在高年龄病例,并随着年龄的增长而出现快速增高趋势,≥80岁年龄组的发病和死亡均最高。国外相关研究结果也发现,65岁以上男性的前列腺癌发病数占全部病例的80%。60岁以下男性患前列腺癌的可能性仅为1/55,而60~80岁的患病可能性则升高到1/7[1]。值得注意的是,1990-2013年间我国65~69岁年龄组男性前列腺癌发病率增幅最快,这可能与人群暴露因素的变化相关[3]。前列腺癌发病原因和机制尚不明确,但有研究表明,前列腺癌与遗传因素、环境、性激素水平和生活方式等因素相关,饮食方面如高热量、高脂肪饮食及肥胖明显增加前列腺癌发生的危险性[16]。此外根据既往文献报道显示,不同地区的前列腺癌发病及死亡水平存在一定差异[17],1990-2013年该疾病的空间分布特点及其变化有待于进一步深入分析。随着我国生活水平不断提高,人口老龄化不断加剧,前列腺癌对男性生活质量影响及其造成的疾病负担将会进一步扩大。
利益冲突 无| [1] Arcangeli S,Pinzi V,Arcangeli G. Epidemiology of prostate cancer and treatment remarks[J]. World J Radiol,2012,4(6):241-246. DOI:10.4329/wjr.v4.i6.241. |
| [2] Torre LA,Bray F,Siegel RL,et al. Global cancer statistics,2012[J]. CA Cancer J Clin,2015,65(2):87-108. DOI:10.3322/caac.21262. |
| [3] 彭鹏,龚杨明,鲍萍萍,等. 中国2008年前列腺癌发病、死亡和患病情况的估计及预测[J]. 中华流行病学杂志,2012,33(10):1056-1059. DOI:10.3760/cma.j.issn.0254-6450.2012.10.014. Peng P,Gong YM,Bao PP,et al. Estimates and prediction of prostate cancer incidence,mortality and prevalence in China,2008[J]. Chin J Epidemiol,2012,33(10):1056-1059. DOI:10.3760/cma.j.issn.0254-6450.2012.10.014. |
| [4] 韩苏军,张思维,陈万青,等. 中国前列腺癌发病现状和流行趋势分析[J]. 临床肿瘤学杂志,2013,18(4):330-334. DOI:10.3969/j.issn.1009-0460.2013.04.009. Han SJ,Zhang SW,Chen WQ,et al. Analysis of the status and trends of prostate cancer incidence in China[J]. Chin Clin Oncol,2013,18(4):330-334. DOI:10.3969/j.issn.1009-0460. 2013. 04.009. |
| [5] 雷涛,毛伟敏,杨红健,等. 中国城乡11市县常见恶性肿瘤发病趋势分析[J]. 中华流行病学杂志,2009,30(11):1165-1170. DOI:10.3760/cma.j.issn.0254-6450.2009.11.019. Lei T,Mao WM,Yang HJ,et al. Study on cancer incidence through the Cancer Registry Program in 11 Cities and Counties,China[J]. Chin J Epidemiol,2009,30(11):1165-1170. DOI:10.3760/cma.j.issn.0254-6450.2009.11.019. |
| [6] Fitzmaurice C,Dicker D,Pain A,et al. The global burden of cancer 2013[J]. JAMA Oncol,2015,1(4):505-527. DOI:10.1001/jamaoncol.2015.0735. |
| [7] Murray CJL,Barber RM,Foreman KJ,et al. Global,regional,and national disability-adjusted life years (DALYs) for 306 diseases and injuries and healthy life expectancy (HALE) for 188 countries,1990-2013:quantifying the epidemiological transition[J]. Lancet,2015,386(10009):2145-2191. DOI:10.1016/S0140-6736(15)61340-X. |
| [8] Zhou MG,Wang HD,Zhu J,et al. Cause-specific mortality for 240 causes in China during 1990-2013:a systematic subnational analysis for the Global Burden of Disease Study 2013[J]. Lancet,2016,387(10015):251-272. DOI:10.1016/S0140-6736(15)00551-6. |
| [9] Forouzanfar MH,Alexander L,Anderson HR,et al. Global,regional,and national comparative risk assessment of 79 behavioural,environmental and occupational,and metabolic risks or clusters of risks in 188 countries,1990-2013:a systematic analysis for the Global Burden of Disease Study 2013[J]. Lancet,2015,386(10010):2287-2323. DOI:10.1016/S0140-6736(15)00128-2. |
| [10] Vos T,Flaxman AD,Naghavi M,et al. Years lived with disability (YLDs) for 1160 sequelae of 289 diseases and injuries 1990-2010:a systematic analysis for the Global Burden of Disease Study 2010[J]. Lancet,2012,380(9859):2163-2196. DOI:10.1016/S0140-6736(12)61729-2. |
| [11] Siegel R,Ma JM,Zou ZH,et al. Cancer statistics,2014[J]. CA Cancer J Clin,2014,64(1):9-29. DOI:10.3322/caac.21208. |
| [12] Center MM,Jemal A,Lortet-Tieulent J,et al. International variation in prostate cancer incidence and mortality rates[J]. Eur Urol,2012,61(6):1079-1092. DOI:10.1016/j.eururo.2012. 02.054. |
| [13] 韩苏军,张思维,陈万青,等. 中国前列腺癌死亡现状及流行趋势分析[J]. 中华泌尿外科杂志,2012,33(11):836-839. DOI:10.3760/cma.j.issn.1000-6702.2012.11.010. Han SJ,Zhang SW,Chen WQ,et al. Analysis of the status and trends of prostate cancer mortality in China[J] Chin J Urol,2012,33(11):836-839. DOI:10.3760/cma.j.issn.1000-6702. 2012.11.010. |
| [14] Shao Q,Ouyang J,Fan YZ,et al. Prostate cancer in the senior men from rural areas in east district of China:contemporary management and 5-year outcomes at multi-institutional collaboration[J]. Cancer Lett,2012,315(2):170-177. DOI:10.1016/j.canlet.2011.09.035. |
| [15] U.S. National Institutes of Health. Surveillance,epidemiology,and end results program[EB/OL].[2015-11-18]. http://seer.cancer.gov/statfacts/html/prost.html. |
| [16] Nelson WG,DeMarzo AM,Yegnasubramanian S. The diet as a cause of human prostate cancer//Zappia V,Panico S,Russo GL,et al. Advances in nutrition and cancer[M]. Berlin Heidelberg:Springer,2014:51-68. DOI:10.1007/978-3-642-38007-5_4. |
| [17] 李鸣,张思维,马建辉,等. 中国部分市县前列腺癌发病趋势比较研究[J]. 中华泌尿外科杂志,2009,30(6):368-370. DOI:10.3760/cma.j.issn.1000-6702.2009.06.003. Li M,Zhang SW,Ma JH,et al. A comparative study on incidence trends of prostate cancer in part of cities and counties in China[J]. Chin J Urol,2009,30(6):368-370. DOI:10.3760/cma.j.issn.1000-6702.2009.06.003. |