 2015, Vol. 36
文章信息
- 秦晨曦, 余灿清, 杜怀东, 郭彧, 卞铮, 吕筠, 周汇燕, 谭云龙, 陈君石, 陈铮鸣, 李立明.
- Qin Chenxi, Yu Canqing, Du Huaidong, Guo Yu, Bian Zheng, Lyu Jun, Zhou Huiyan, Tan Yunlong, Chen Junshi, Chen Zhengming, Li Liming.
- 中国10个地区成年人食物摄入频率特征差异的分析
- Differences in diet intake frequency of adults:findings from half a million people in 10 areas in China
- 中华流行病学杂志, 2015, 36(9): 911-916
- Chinese Journal of Epidemiology, 2015, 36(9): 911-916
- http://dx.doi.org/10.3760/cma.j.issn.0254-6450.2015.09.001
-
文章历史
- 投稿日期: 2015-02-13


2. 英国牛津大学;
3. 中国医学科学院;
4. 国家食品安全风险评估中心
2 University of Oxford;
3 Chinese Academy of Medical Sciences;
4 National Center for Food Safety Risk Assessment of China
不健康膳食是慢性病及死亡的高危因素之一[1]。研究显示,至2010年复合膳食因素所致的居民伤残调整寿命年和死亡分别占16.3%和30.6%,水果及未精制谷类摄入水平较低是重要危险因素[2]。改善膳食习惯对我国慢性病防治具有重要意义。由于我国各地区的膳食习惯差异巨大,需要了解不同地区膳食摄入特征才能有针对性地提出膳食建议。近年发表文献中虽可见全国多个地区的人群膳食摄入情况调查[3, 4, 5],但研究人群样本量较小,鲜有不同地区人群膳食摄入情况的比较分析。本研究利用中国慢性病前瞻性研究(CKB)项目覆盖的10个地区51万自然人群的基线调查数据描述食物摄入频率的地区差异。 对象与方法
1. 研究对象:对CKB项目中512 891名30~79岁有完整基线数据的调查对象进行分析[6, 7, 8]。为简化表述且方便识别,以城市名称表示城市项目点,以省份名称表示农村项目点。
2. 研究内容和定义:问卷调查采用牛津大学项目组开发的专用问卷,由经过统一培训的调查员面对面询问获得,包括一般人口社会学信息(性别、年龄、受教育程度、家庭年收入水平)和膳食摄入信息。膳食摄入信息为过去一年内12个食物组的平均摄入频率,食物组类别和摄入频率等级如下。
(1)食物组:①大米;②面食;③杂粮(玉米、高粱、地瓜等);④肉类及其制品;⑤家禽及其制品;⑥水产/海鲜品;⑦蛋类及其制品;⑧新鲜蔬菜;⑨豆制品(包括豆浆);⑩腌制蔬菜;11新鲜水果;12乳类及其制品(牛奶、酸奶等)。
(2)摄入频率:①“每天都吃”;②“每周有4~6天吃”;③“每周有1~3天吃”;④“每月吃数次”;⑤“不吃/极少吃”。
基线调查时的926人在基线调查后1年内(平均5.4个月)被重复调查,调整性别和年龄后计算两次调查食物摄入频率间的Spearman相关系数,结果显示,食物摄入频率一致性良好。
3. 统计学分析:由于本研究中“每周有4~6天吃”人群所占比例较低,故将食物摄入频率合并为3类:①“7天/周”;②“1~6天/周”(包括“每周有4~6天吃”与“每周有1~3天吃”);③“≤1天/周”(“每月吃数次”与“不吃/极少吃”)。利用logistic模型调整年龄与性别后,分10个项目地区计算人群的食物摄入频率构成比(%),并比较不同地区间以及北方城市、南方城市、北方农村、南方农村项目地区间构成比的差异。数据分析使用SAS 9.3软件。 结 果
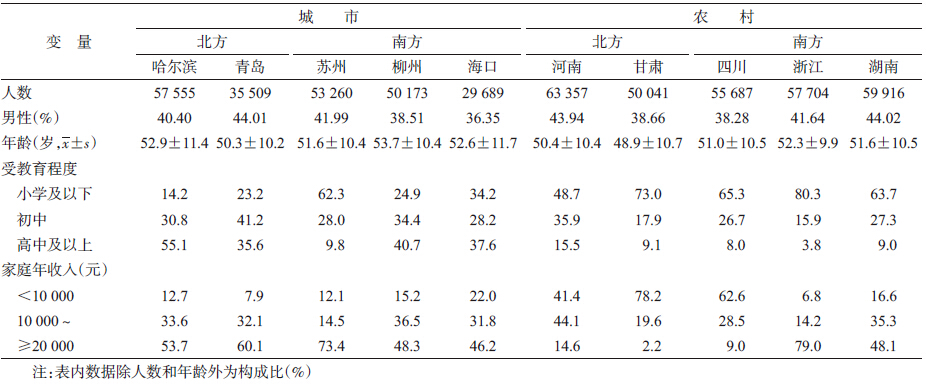
1. 一般情况:共纳入512 891名研究对象,平均年龄(51.5±10.7)岁,男性占41.0%,农村地区个体占55.9%。10个地区研究对象的基本特征见表 1。各地研究对象的性别、年龄分布差异有统计学意义(P<0.001)。
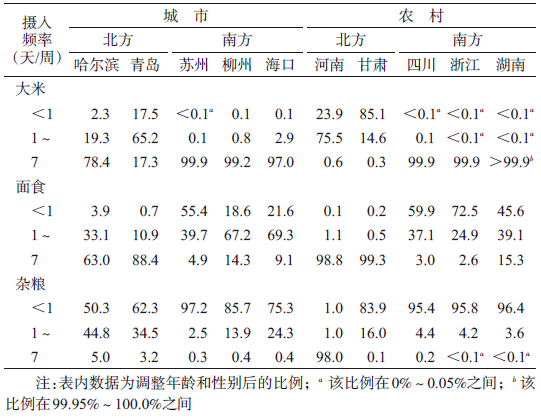
2. 谷类食物摄入频率:10个地区中南方城市(99.0%)和农村(99.9%)地区人群每天摄入的谷类食物以大米为主。北方农村(99.0%)地区和北方城市如青岛(88.4%)人群则以面食为主,而哈尔滨人群每天摄入大米(78.4%)和面食(63.0%)的人群比例均过半。在每天摄入杂粮比例上,仅河南达98.0%,其余地区不足5.0%,见表 2和图 1。
 |
| 注:调整年龄和性别后比例 图 1 CKB 10个项目地区人群每天摄入大米比例与每天摄入面食比例(%) |
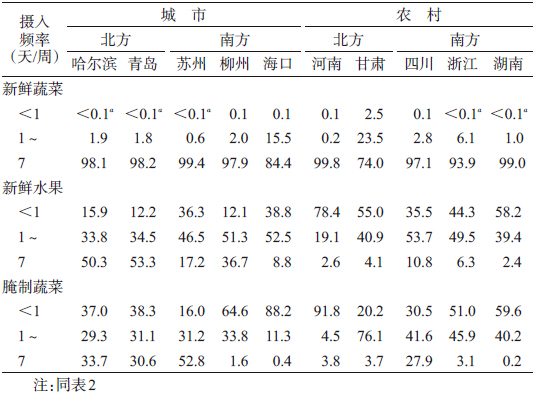
3. 蔬菜与水果摄入频率:比较不同地区人群每天摄入新鲜蔬菜比例,南方城市(95.5%)、北方城市(98.1%)和南方农村(96.7%)略高于北方农村(88.5%),且北方农村以甘肃为最低(74.0%),见表 3和图 2。城市(北方32.5%,南方22.0%)地区人群每天摄入新鲜水果的比例明显高于农村(北方3.8%,南方9.9%),青岛最高(53.3%)、湖南最低(2.4%)。每天摄入腌制蔬菜比例存在相似城乡分布特征,苏州最高(52.8%)。
 |
| 注:仅展示1~6天/周和7天/周构成比 图 2 CKB南北城市、农村项目地区人群12组食物摄入频率构成比(%) |
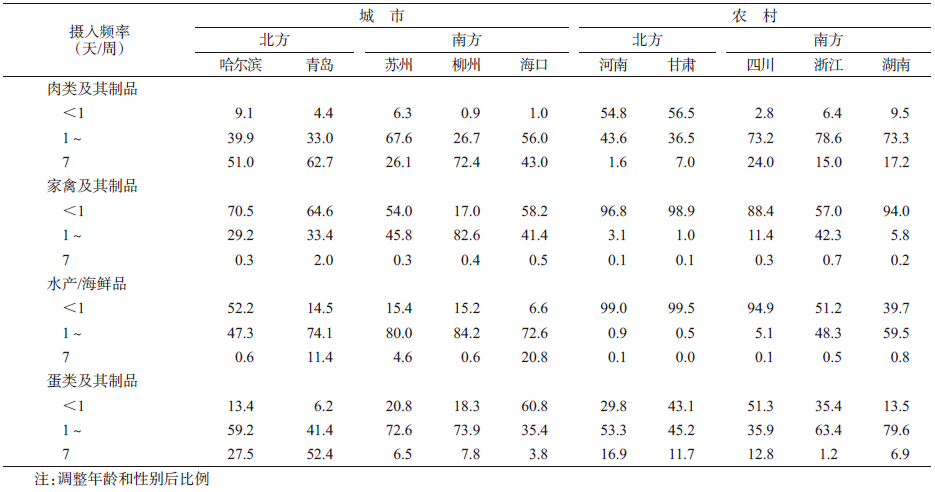
4. 动物性食物摄入频率:南北方均有城市地区人群每天摄入肉类及其制品比例明显高于农村地区,该比例以柳州人群最多(72.4%),河南最少(1.6%),见表 4和图 2。由于大部分地区人群每天摄入家禽及其制品、水产/海鲜品比例较低,故比较每周至少1 d比例在南北方均存在城市高于农村。此外,海口人群每天摄入水产/海鲜品比例最高(20.8%),青岛次之(11.4%)。北方城市(37.1%)人群每天摄入蛋类及其制品高于南方城市(6.5%),北方农村(14.6%)高于南方农村(6.9%),其中比例最高的青岛(52.4%)与最低的浙江(1.2%)相差42倍以上。
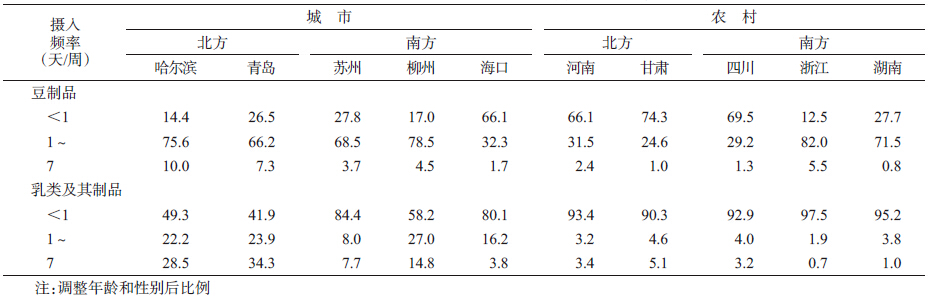
5. 豆制品与乳类及其制品摄入频率:比较每天摄入豆制品比例,城市(北方9.0%,南方3.6%)人群高于农村(北方1.8%,南方0.5%)、北方高于南方,以哈尔滨(10.0%)最高,甘肃(1.0%)最低(表 5和图 2)。北方城市(30.9%)人群每天摄入乳类及其制品最高,特别是青岛(34.3%),明显高于其他地区。
本研究利用CKB项目基线调查数据,比较分析10个项目地区人群的12组食物摄入频率特征。由于个体每天摄入食物的种类和量不断改变,等量的食物一次摄入与多次摄入所产生的健康效应未必相同,研究食物摄入频率可以更好地反映个体的食物选择情况。本研究调整性别和年龄后发现,12组食物摄入频率在各项目地区人群中存在差异。
本研究发现CKB各地区人群每天摄入大米、面食频率的特征存互补现象(哈尔滨除外)。这与我国南方地区以大米为主、北方地区以面食为主的食物消费特征相关。《中国居民膳食指南》推荐每次摄入50~100 g粗粮或全谷类制品,每周5~7次[9],本研究中仅有河南大部分人群达到每天摄入量。河南省一项分层多级整群随机样营养调查显示,农村地区平均每日薯类摄入量达172.5 g[10],提示薯类可能是河南项目地区人群摄入杂粮的重要来源之一。
随着城镇化进程推进,超市、便利店、餐馆等更加普及[11, 12],食物可及性提高,居民收入水平也不断提高,动物性食物摄入量也随之增加[13, 14, 15]。2002年中国居民营养与健康状况调查发现城市地区人群猪肉、牛羊肉、禽肉、水产品、豆制品、乳类及其制品的摄入频率明显高于农村地区[16],与本研究结果一致。此外,水产/海鲜品的摄入还与该地区渔业资源相关,如2011年山东省、江苏省水产养殖面积分别占全国水产养殖总面积的10.0%、9.8%,分列第二、三位[16],海南则以海产品捕捞业为主[17]。与2002年中国居民营养与健康状况调查相比[16],本研究发现除甘肃项目点外其余城市、农村项目点间人群每天摄入新鲜蔬菜比例相对较高。既往研究发现收入水平及受教育程度与新鲜蔬菜、水果摄入量成正比[18],但也有研究者认为摄入新鲜蔬菜比新鲜水果更容易受饮食文化的影响[19, 20]。新鲜蔬菜在中国传统饮食文化的重要地位可能导致本研究中新鲜蔬菜摄入地区差异不明显。此外,由于CKB项目为前瞻性队列研究,未采用概率抽样选择研究地区和人群,且未调查<30岁人群,故本研究仅描述10个项目地区的队列成员在食物摄入频率上的地区差异。
近年研究发现,红肉及加工肉制品摄入水平与心血管疾病[21]、糖尿病[22]发病风险成正比;高精制白米摄入量也可增加糖尿病患病风险[23],而我国人群食用的大米几乎均为精制白米。反之,长期摄入未精制过的谷类、新鲜蔬菜水果则可降低心血管疾病[24, 25, 26]、糖尿病[25, 26, 27]及部分癌症[28]的发病风险。本研究提示,研究中国人群膳食与慢性病关系时应充分考虑地区差异。
本研究存在局限性。CKB项目基线调查中只对各食物组摄入频率情况进行描述分析,虽然可以反映食物选择情况,但食物组的摄入量同样需要关注。
| [1] WHO. Global status report on noncommunicable diseases 2010[M]. Geneva:World Health Organization,2011. |
| [2] Yang GH, Wang Y,Zeng YX,et al. Rapid health transition in China,1990-2010:findings from the Global Burden of Disease Study 2010[J]. Lancet,2013,381(9882):1987-2015. |
| [3] Yin P,Zhang M,Li YC,et al. Survey of dietary intake of Chinese adults in 2010[J]. Chin J Prev Med,2012,46(8):692-696. (in Chinese) 殷鹏,张梅,李镒冲,等. 2010年我国成年人主要食物摄入状况调查[J]. 中华预防医学杂志,2012,46(8):692-696. |
| [4] Su C,Zhang B,Wang HJ,et al. The status and trend of cereal consumption among Chinese adults in nine provinces (municipality) from 1989 to 2006[J]. Chin J Prev Med,2011,45(9):798-801. (in Chinese) 苏畅,张兵,王惠君,等. 1989-2006年中国九省(区)居民谷类食物消费状况及变化趋势[J]. 中华预防医学杂志,2011,45(9):798-801. |
| [5] Zhai FY,Wang HJ,Du SF,et al. The changing trend of dietary pattern of Chinese population—an eight provinces case study in China[J]. Acta Nutr Sin,2002,24(4):342-346. (in Chinese) 翟凤英,王惠君,杜树发,等. 中国八省成人膳食结构变化趋势分析——中国八省实例研究[J]. 营养学报,2002,24(4):342-346. |
| [6] Chen ZM,Chen JS,Collins R,et al. China Kadoorie Biobank of 0.5 million people:survey methods,baseline characteristics and long-term follow-up[J]. Int J Epidemiol,2011,40(6):1652-1666. |
| [7] Chen ZM,Lee LM,Chen JS,et al. Cohort profile:the Kadoorie Study of Chronic Disease in China (KSCDC) [J]. Int J Epidemiol,2005,34(6):1243-1249. |
| [8] Li LM,Lv J,Guo Y,et al. The China Kadoorie Biobank:related methodology and baseline characteristics of the participants[J]. Chin J Epidemiol,2012,33(3):249-255. (in Chinese) 李立明,吕筠,郭彧,等. 中国慢性病前瞻性研究:研究方法和调查对象的基线特征[J]. 中华流行病学杂志,2012,33(3):249-255. |
| [9] Chinese Nutrition Society. Dietary guidelines for Chinese residents[M]. Lhasa:China Tibet People's Press,2008. (in Chinese) 中国营养学会. 中国居民膳食指南[M]. 拉萨:西藏人民出版社,2008. |
| [10] Zhang SF,Zhang D,Zhang GM,et al. Survey of dietary intake of urban and rural residents with different levels of income in Henan province [J]. South Chin J Prev Med,2003,29(4):45-47. (in Chinese) 张书芳,张丁,张光明,等. 河南省城乡居民不同经济水平的膳食营养状况分析[J]. 华南预防医学,2003,29(4):45-47. |
| [11] Wang Z,Chern WS. Effects of rationing on the consumption behavior of Chinese urban households during 1981-1987[J]. J Compar Econ,1992,16(1):1-26. |
| [12] Dong XX,Hu BC. Regional difference in food consumption away from home of urban residents:a panel data analysis[J]. Agric Agric Sci Proced,2010,1:271-277. |
| [13] Popkin BM,Du S. Dynamics of the nutrition transition toward the animal foods sector in China and its implications:a worried perspective[J]. J Nutr,2003,133(11 Suppl 2):S3898-3906. |
| [14] Zhai FY,Du SF,Wang ZH,et al. Dynamics of the Chinese diet and the role of urbanicity,1991-2011[J]. Obes Rev,2014,15 Suppl 1:S16-26. |
| [15] Zhai FY,Wang HJ,Du SF,et al. Lifespan nutrition and changing socio-economic conditions in China[J]. Asia Pac J Clin Nutr,2007,16 Suppl 1:S374-382. |
| [16] Ma GS,Kong LZ. The ninth report of Chinese national nutrition and health survey:2002 behavior and lifestyle[M]. Beijing:People's Medical Publishing House,2006. (in Chinese) 马冠生,孔灵芝. 中国居民营养与健康状况调查报告之九:2002行为和生活方式[M]. 北京:人民卫生出版社,2006. |
| [17] Bureau of Fisheries,Ministry of Agriculture. China fishery yearbook 2013 [M]. Beijing:China Agriculture Press,2013. (in Chinese) 农业部渔业局. 中国渔业统计年鉴 2013[M]. 北京:中国农业出版社,2013. |
| [18] Lu JY, Zhang YM, Guo JC. The positive analysis of fishery production function in Hainan province [J]. Fisher Sci,2005,24(12):50-53. (in Chinese) 卢江勇,张玉梅,过建春. 海南省渔业生产函数实证分析[J]. 水产科学,2005,24(12):50-53. |
| [19] Pollard J,Kirk SFL,Cade JE. Factors affecting food choice in relation to fruit and vegetable intake:a review[J]. Nutr Res Rev,2002,15(2):373-387. |
| [20] Kamphuis CB, Giskes K, de Bruijn GJ,et al. Environmental determinants of fruit and vegetable consumption among adults:a systematic review[J]. Br J Nutr,2006,96(4):620-635. |
| [21] Landais E, Bour A, Gartner A, et al. Socio-economic and behavioural determinants of fruit and vegetable intake in Moroccan women[J]. Public Health Nutr,2015,18(5):809-816. |
| [22] Abete I, Romaguera D, Vieira AR, et al. Association between total,processed,red and white meat consumption and all-cause,CVD and IHD mortality:a meta-analysis of cohort studies[J]. Br J Nutr,2014,112(5):762-775. |
| [23] Micha R,Michas G,Mozaffarian D. Unprocessed red and processed meats and risk of coronary artery disease and type 2 diabetes—an updated review of the evidence[J]. Curr Atheroscler Rep,2012,14(6):515-524. |
| [24] Hu EA,Pan A,Malik V,et al. White rice consumption and risk of type 2 diabetes:meta-analysis and systematic review[J]. BMJ,2012,344:e1454. |
| [25] Threapleton DE,Greenwood DC,Evans CE,et al. Dietary fibre intake and risk of cardiovascular disease:systematic review and meta-analysis[J]. BMJ,2013,347:f6879. |
| [26] Cho SS,Qi L,Fahey GC Jr, et al. Consumption of cereal fiber,mixtures of whole grains and bran,and whole grains and risk reduction in type 2 diabetes,obesity,and cardiovascular disease[J]. Am J Clin Nutr,2013,98(2):594-619. |
| [27] Hartley L,Igbinedion E,Holmes J,et al. Increased consumption of fruit and vegetables for the primary prevention of cardiovascular diseases[J]. Cochrane Database Syst Rev,2013,6:CD009874. |
| [28] Li M,Fan YL,Zhang XW,et al. Fruit and vegetable intake and risk of type 2 diabetes mellitus:meta-analysis of prospective cohort studies[J]. BMJ Open,2014,4(11):e005497. |