 2015, Vol. 36
文章信息
- 樊萌语, 吕筠, 郭彧, 卞铮, 余灿清, 杜怀东, 周汇燕, 谭云龙, 陈君石, 陈铮鸣, 李立明. 2015.
- Fan Mengyu, Lyu Jun, Guo Yu, Bian Zheng, Yu Canqing, Du Huaidong, Zhou Huiyan, Tan Yunlong, Chen Junshi, Chen Zhengming, Li Liming. 2015.
- 中国慢性病前瞻性研究: 10 个项目地区成人体力活动和休闲静坐时间特征差异的分析
- Regional differences on patterns of physical activity and leisure sedentary time: findings from the China Kadoorie Biobank study, including a million people from 10 regions
- 中华流行病学杂志, 2015, 36(8): 779-785
- Chinese Journal of Epidemiology, 2015, 36(8): 779-785
- http://dx.doi.org/10.3760/cma.j.issn.0254-6450.2015.08.002
-
文章历史
- 投稿日期:2015-01-09


2. 中国医学科学院;
3. 英国牛津大学;
4. 国家食品安全风险评估中心
2. Chinese Academy of Medical Sciences;
3. Clinical Trial Service Unit and Epidemiological Studies Unit, Nuffield Department of Population Health, University of Oxford;
4. China National Center for Food Safety Risk Assessment
少体力活动和静态生活方式是导致主要慢性病发生和死亡的重要危险因素之一[1]。体力活动水平与静坐行为对健康的影响是独立的[2];不同类型(即工作、交通出行、家务和休闲)、不同强度的体力活动也可能产生不同的健康效应[3, 4, 5, 6]。近年来开展的中国人群体力活动行为调查,大多仅评价某一类型的体力活动水平,且较少测量每周静坐时间。同时,发表的论文中多只报告调查对象总体或分城乡和人口社会学特征的指标水平,未见不同地区人群体力活动及静坐行为特征的比较分析。本研究旨在利用中国慢性病前瞻性研究(China Kadoorie Biobank,CKB)项目的基线调查数据描述项目覆盖的10个地区自然人群在不同类型、不同强度和总体力活动水平及每周休闲静坐时间的地区差异[7, 8, 9]。
对象与方法1. 研究对象:本研究资料来自CKB项目10个调查点的基线数据(2004-2008年)。项目地区包括5个城市和5个农村,为简化表述且方便识别,以城市名称表示城市项目点,以省份名称表示农村项目点[9]。项目的详细介绍参见文献[7, 8, 9]。有完整基线调查数据的调查对象共512 891人[7, 8, 10]。本研究剔除对象:①自报曾患或现患冠心病(n=15 472)、卒中(n=8 884)、肿瘤(n=2 577)者;②未报告任何体力活动或静坐行为者(n=81);③自报的所有体力活动和静坐行为的每天累计时间超过20 h者(n=813)。
2. 研究内容:一般人口社会学信息(性别、年龄、受教育程度、家庭年收入、职业)、体力活动和静坐行为情况通过调查员面对面询问获得。调查分农业劳动者和非农业劳动者询问过去一年内个体主要从事的工作和交通出行类体力活动类别及其每周(或天)累计时间。调查进一步询问每名研究对象业余时间参加体育锻炼的活动类型、频率和每周累计时间,以及每周从事家务活动和休闲相关静坐行为的累计时间。
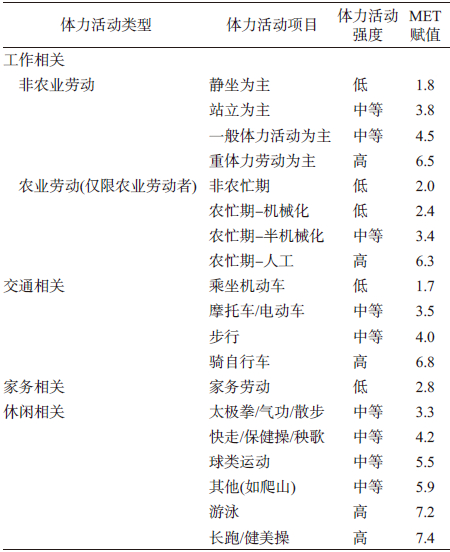
3. 统计学分析:本研究参考2011年更新的《体力活动概要》确定各项体力活动的能量代谢水平[11],即以代谢当量(metabolic equivalent of task,MET)反映活动强度,具体赋值方案见文献[12]。同时,参照美国疾病预防控制中心(CDC)和美国运动医学会(ACSM)的推荐标准[13],根据MET赋值将体力活动划分为3种强度:低强度(<3 METs)、中等强度(3~6 METs)、高强度(>6 METs)。各项体力活动的属性及其MET赋值见表 1。个体每天从事某类体力活动的水平(MET-h/d)为:某类体力活动的MET赋值×从事该类体力活动的累计时间(h/d)。在此基础上,计算每天4种不同类型、3种不同强度及总体力活动水平。关于休闲静坐行为,本研究以每周休闲静坐时间除以7得到通常情况下的平均每天休闲静坐时间(h/d)。连续变量(4种不同类型、3种不同强度及总体力活动水平,每天静坐时间)分别按全部研究对象变量水平的四分位数进行分组。本文分性别和10个项目地区描述人群的体力活动和静坐行为特征。对年龄(10岁1组,共5组)变量进行直接标准化处理,以全部研究对象作为标准人口,相关结果报告标准化后的频数、百分比,或x、sx。数据分析使用Stata 13.1软件。
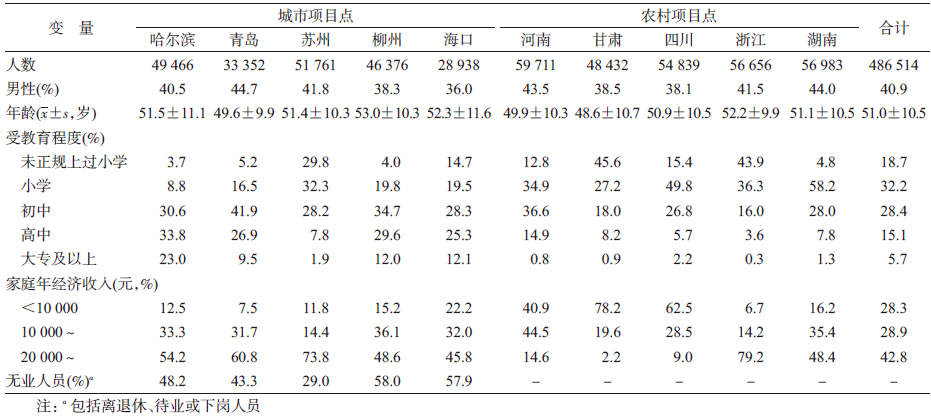
1. 一般情况:本研究纳入分析486 514人,平均年龄(51.0±10.5)岁,男性占40.9%,农村地区个体占56.9%。10个项目地区研究对象的基本特征见表 2。各地区研究对象的性别、年龄、受教育程度、家庭年经济收入和在业状态的分布差异有统计学意义(P<0.001)。
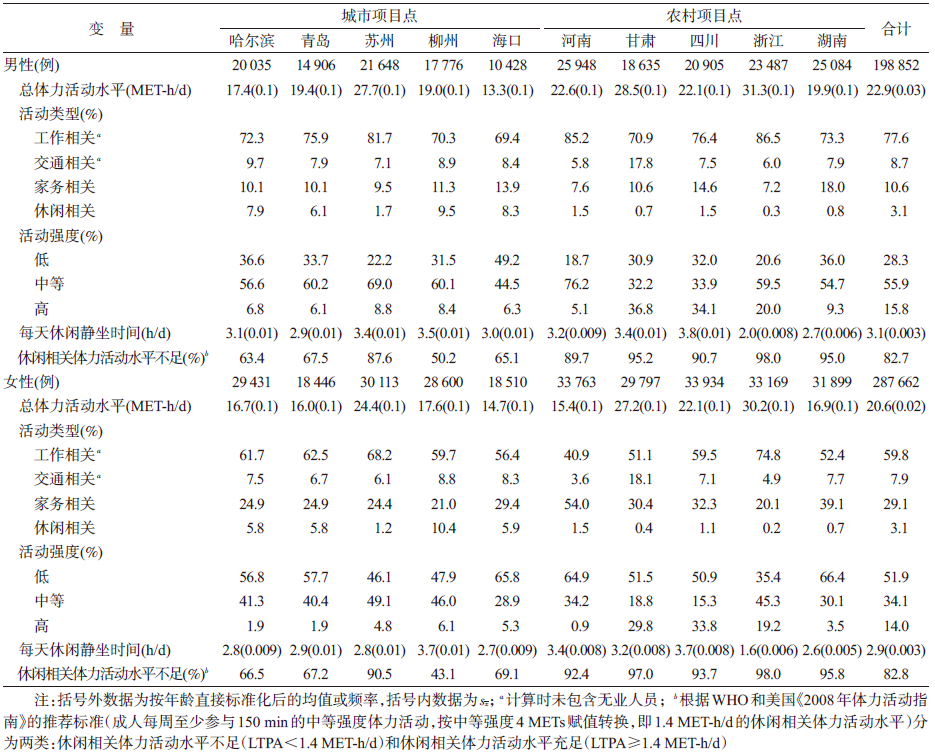
2. 总体力活动水平与休闲静坐时间:全部研究对象平均每天总体力活动水平(MET-h/d)为21.5±13.8,男性(22.9)高于女性(20.6)。按全部研究对象体力活动水平的四分位数分组,与女性相比,男性每天活动水平处于最低(<P25;男24.6% vs. 女20.6%)及最高(>P75;男30.1% vs. 女16.9%)组的人数比例均更多。浙江、甘肃和苏州项目点的每天总体力活动水平最高,海口最低(表 3,图 1)。全部研究对象平均每天休闲静坐时间为(3.0±1.5)h/d,约83.3%的个体每天休闲静坐时间超过2.0 h。男性每天静坐时间(3.1 h/d)略高于女性(2.9 h/d)。四川项目点的每天休闲静坐时间最多,浙江最少(表 3,图 1)。同时观察体力活动水平与静坐行为,在总体力活动水平属于上四分位数的人群中,每天休闲静坐时间超过2 h的比例达到了53.5%。浙江项目点的男性和女性个体不仅每天静坐时间最少,且总体力活动水平明显高于其他地区(图 2)。
 |
| 注:采用每天总体力活动水平和每天静坐时间直接标准化后的均值做图; U为城市项目点; R为农村项目点 图1 10个项目地区不同性别人群每天总体力活动水平及静坐时间 |
 |
| 注:同图1 图2 10个项目地区不同性别人群每天总体力活动水平与静坐时间的比较 |
3. 体力活动类型:男性每天的总体力活动水平中,工作、交通、家务、休闲相关体力活动(MET-h/d)的平均水平及其构成依次为20.5(77.6%)、2.3(8.7%)、2.8(10.6%)和0.8(3.1%);女性依次为15.8(59.8%)、2.1(7.9%)、7.7(29.1%)和0.8(3.1%)(表 3)。其中,报告每周至少有一次休闲相关体力活动的个体仅占全部研究对象的20.4%。男性工作相关体力活动所占比例,浙江和河南项目点最高,海口最低;女性则以浙江最高,河南最低。无论男性还是女性,交通相关体力活动所占比例,甘肃项目点明显高于其他地区,河南最低。男性中的家务相关体力活动所占比例,湖南项目点最高,河南和浙江最低;女性则以河南和湖南项目点最高,浙江最低。无论男性还是女性,休闲相关体力活动所占比例在柳州项目点最高;除苏州外,城市项目点休闲活动所占比例明显高于农村项目点(表 3,图 3)。
 |
| 图3 10个项目地区不同性别人群总体力活动水平分类型和强度的构成 |
4. 体力活动强度:男性每天的总体力活动水平中,低、中等和高强度体力活动(MET-h/d)的平均水平及其构成依次为6.5(28.3%)、12.8(55.9%)和3.6 (15.8%),女性依次为10.7(51.9%)、7.0(34.1%)和2.9(14.0%)(表 3)。其中,报告有任何高强度体力活动的个体占全部研究对象的40.1%。甘肃、四川和浙江3个农村项目点的高强度体力活动所占比例明显高于其他项目点。海口、哈尔滨、青岛和湖南项目点中,低强度体力活动的构成高于其他地区(表 3,图 3)。
讨 论本研究利用中国人群前瞻性队列的基线调查数据,剔除患有主要慢性病的个体后,结果显示10个项目地区人群的体力活动特征(总体力活动水平、活动类型、活动强度)和休闲静坐时间存在明显的地区差异。2006年中国九省区健康与营养调查的结果显示[14],18岁以上调查人群中每天总体力活动水平:男性15.4 MET-h/d,女性16.5 MET-h/d。CKB项目30~79岁队列成员的总体力活动水平略高(男性22.9 MET-h/d,女性20.6 MET-h/d),可能与本文分析样本中排除了患有主要慢性病的个体有关。作为一项前瞻性队列研究,CKB项目并未采用概率抽样法选择研究地区和人群。因此,本研究中各项目地区的分析结果仅用以展示CKB项目募集到的队列成员在体力活动特征和静坐时间上的大体水平及存在的明显的地区差异。
目前国外通用的关于体力活动的推荐标准都是针对休闲相关体力活动。例如,WHO和美国《2008年体力活动指南》推荐成人每周至少参与150 min的中等强度体力活动[15],按中等强度4 METs赋值转换,即对应数值约为1.4 MET-h/d的休闲相关体力活动水平。按此标准,82.7%的CKB项目人群的休闲相关体力活动水平不足,其中,城市人群约为2/3,农村人群超过90%。研究显示,2004年美国人群休闲相关体力活动不足率为23.7%,远低于CKB人群[16]。然而,与国外发达国家人群以休闲活动为主的模式不同,本研究显示CKB项目地区的男性个体以工作相关体力活动为主,女性以家务和工作相关活动为主,休闲相关活动所占比例均较低,直接应用该标准可能会夸大CKB人群的体力活动不足率。然而,相比于休闲相关体力活动,其他3种类型体力活动与健康结局的相关性仍未得到充分证明。以工作相关体力活动为例,有研究结果提示高强度的工作相关体力活动可增大心血管疾病发生和全死因死亡的风险[17, 18]。另一项研究也指出高强度工作相关体力活动可能对休闲相关体力活动不足的个体具有不利影响[19]。因此,鼓励个体增加休闲相关体力活动水平具有重要的意义。
除体力活动以外,该人群休闲相关的静坐问题更显突出。83.3%的队列成员平均每天休闲静坐时间超过2 h,高于2006年美国人群的该比例(男性74.8%,女性72.2%)[20]。甚至在总体力活动水平属于上四分位数的CKB人群中,静坐时间超过2 h的人群比例也达到了53.5%。近年来,电视、计算机等数字设备的使用率增高、户外活动空间减少所形成的静态的现代生活方式并不少见[21]。而大量研究指出,体力活动和静坐行为与健康结局的关联相互独立[2],即使个体的体力活动水平达到推荐标准,长时间静坐也可增加慢性病的发生风险[22]。虽然中国居民越来越多的了解到参加体力活动可促进健康,但对长时间静坐可引发严重健康问题的认识仍显不足。
本研究显示,CKB人群的体力活动水平特征和每周休闲静坐时间存在明显的地区差异。例如,各项目地区人群的每天总体力活动水平和每天休闲静坐时间,最高与最低的项目地区,男性和女性均相差2倍以上。地区差异主要体现在两个方面。一是城乡差异,主要源自职业行为的差异,从而体现为总体力活动水平和体力活动类型、强度上的差异。但是,随着农村机械化水平的提高和脱离田间劳动人数的增多,农村人群的职业行为将与城市人群逐渐趋同。这种变化模式可导致农村人群的工作相关和高强度体力活动水平快速下降[23]。
二是具体各个项目地区的差异。例如,浙江地区比较突出,总体力活动水平最高且休闲静坐时间最少。而四川项目地区的休闲静坐时间高于其他地区。这些具体地区的差异,不仅与各地文化习俗、惯常的交通出行和娱乐方式相关,还可能受地区运动健身场地数量和可及性、街道连通性、交通系统等建成环境,以及相关的政策环境影响[24],具体的影响因素还有待进一步研究。
本研究存在一定的局限性。体力活动和静坐行为信息采用调查对象自报,存在一定的信息偏倚。调查询问个体过去一年内体力活动和静坐时间的平均水平,无法把握调查对象体力活动和静坐行为的季节性变化。尽管如此,本研究发现目前大部分地区人群体力活动和静坐行为的绝对水平仍存在问题,表现为体力活动水平低、静坐时间长。同时,研究进一步明确了该队列人群在体力活动和静坐行为上存在明显的地区差异。提示各地区应根据各自人群的具体活动特征开展有针对性的干预措施。此外,通过对这样超大规模的队列人群开展长期随访,将有机会深入探讨不同体力活动和静坐行为特征与众多健康结局的关联及其剂量反应关系。
(感谢参加CKB项目的队列成员和各项目地区的现场调查员及项目管理委员会、国家项目办公室、牛津协作中心和10个项目地区办公室的工作人员)
| [1] He J, Gu DF, Wu XG, et al. Major causes of death among men and women in China[J]. New Engl J Med, 2005, 353(11):1124-1134. |
| [2] Patel AV, Bernstein L, Deka A, et al. Leisure time spent sitting in relation to total mortality in a prospective cohort of US adults[J]. Am J Epidemiol, 2010, 172(4):419-429. |
| [3] Abu-Omar K, Rütten A. Relation of leisure time, occupational, domestic, and commuting physical activity to health indicators in Europe[J]. Prev Med, 2008, 47(3):319-323. |
| [4] Powell KE, Paluch AE, Blair SN. Physical activity for health:What kind? How much? How intense? On top of what?[J]. Annu Rev Public Health, 2011, 32:349-365. |
| [5] Holtermann A, Hansen JV, Burr H, et al. The health paradox of occupational and leisure-time physical activity[J]. Br J Sports Med, 2012, 46(4):291-295. |
| [6] Autenrieth CS, Baumert J, Baumeister SE, et al. Association between domains of physical activity and all-cause, cardiovascular and cancer mortality[J]. Eur J Epidemiol, 2011, 26(2):91-99. |
| [7] Li LM, Lv J, Guo Y, et al. The China Kadoorie Biobank:related methodology and baseline characteristics of the participants[J]. Chin J Epidemiol, 2012, 33(3):249-255. (in Chinese) 李立明, 吕筠, 郭彧, 等. 中国慢性病前瞻性研究:研究方法和调查对象的基线特征[J]. 中华流行病学杂志, 2012, 33(3):249-255. |
| [8] Chen ZM, Lee L, Chen JS, et al. Cohort profile:the Kadoorie Study of Chronic Disease in China (KSCDC)[J]. Int J Epidemiol, 2005, 34(6):1243-1249. |
| [9] Lyu J, Guo Y, Bian Z, et al. Regional differences in patterns of alcohol consumption:findings from the China Kadoorie Biobank study on half a million people from 10 regions [J]. Chin J Epidemiol, 2014, 35(8):875-881. (in Chinese) 吕筠, 郭彧, 卞铮, 等. 中国慢性病前瞻性研究:10个项目地区人群饮酒行为特征差异的分析[J]. 中华流行病学杂志, 2014, 35(8):875-881. |
| [10] Chen ZM, Chen JS, Collins R, et al. China Kadoorie Biobank of 0.5 million people:survey methods, baseline characteristics and long-term follow-up[J]. Int J Epidemiol, 2011, 40(6):1652-1666. |
| [11] Ainsworth BE, Haskell WL, Herrmann SD, et al. 2011 Compendium of Physical Activities:a second update of codes and MET values[J]. Med Sci Sports Exerc, 2011, 43(8):1575-1581. |
| [12] Du HD, Bennett D, Li LM, et al. Physical activity and sedentary leisure time and their associations with BMI, waist circumference, and percentage body fat in 0.5 million adults:the China Kadoorie Biobank study[J]. Am J ClinNutr, 2013, 97(3):487-496. |
| [13] Pate RR, Pratt M, Blair SN, et al. Physical activity and public health. A recommendation from the centers for disease control and prevention and the American college of sports medicine[J]. J Am Med Assoc, 1995, 273(5):402-407. |
| [14] Li X. Effect of lifestyle behaviors on blood pressure in Chinese adults from 9 provinces[J]. Food Nutr China, 2013, 19(5):78-82. (in Chinese) 李旭. 中国九省区成人生活行为对血压的影响[J]. 中国食物与营养, 2013, 19(5):78-82. |
| [15] Congress GUST. Physical Activity Guidelines for Americans Act of 2008[Z]. |
| [16] Centers for Disease Control and Prevention. Trends in leisure-time physical inactivity by age, sex, and race/ethnicity-United States, 1994-2004[J]. MMWR Morb Mortal Wkly Rep, 2005, 54(39):991-994. |
| [17] Hu GC, Chien KL, Hsieh SF, et al. Occupational versus leisure-time physical activity in reducing cardiovascular risks and mortality among ethnic Chinese adults in Taiwan[J]. Asia Pac J Public Health, 2014, 26(6):604-613. |
| [18] Holtermann A, Burr H, Hansen JV, et al. Occupational physical activity and mortality among Danish workers[J]. Int Arch Occup Environ Health, 2012, 85(3):305-310. |
| [19] Holtermann A, Marott JL, Gyntelberg F, et al. Occupational and leisure time physical activity:risk of all-cause mortality and myocardial infarction in the Copenhagen City Heart Study. A prospective cohort study[J]. BMJ Open, 2012, 2(1):e000556. |
| [20] Susan B, Sarah M, Timothy S, et al. Leisure time sedentary behavior, occupational/domestic physical activity, and metabolic syndrome in U.S. men and women[J]. Metab Syndr Relat Disord, 2009, 7(6):529-536. |
| [21] Ng SW, Norton EC, Popkin BM. Why have physical activity levels declined among Chinese adults?Findings from the 1991-2006 China Health and Nutrition Surveys[J]. Soc Sci Med, 2009, 68(7):1305-1314. |
| [22] Bauman A, Ainsworth BE, Sallis JF, et al. The descriptive epidemiology of sitting:A 20-country comparison using the International Physical Activity Questionnaire (IPAQ)[J]. Am J Prev Med, 2011, 41(2):228-235. |
| [23] Xie GQ, Mai JZ, Zhao LC, et al. Physical activity status of working time and its change over a ten-year period in Beijing and Guangzhou populations[J]. J Hygiene Res, 2008, 37(1):33-36. (in Chinese) 谢高强, 麦劲壮, 赵连成, 等. 北京、广州城乡人群工作时体力活动现状及其10年间变化情况[J]. 卫生研究, 2008, 37(1):33-36. |
| [24] Bauman AE, Reis RS, Sallis JF, et al. Correlates of physical activity:why are some people physically active and others not?[J]. Lancet, 2012, 380(9838):258-271. |