文章信息
- 杨丽, 寇增强, 毕振旺, 张鲁燕, 郑丽, 赵仲堂. 2014.
- Yang Li, Kou Zengqiang, Bi Zhenwang, Zhang Luyan, Zheng Li, Zhao Zhongtang. 2014.
- 山东省2004-2012年布鲁氏菌病时空分布特征分析
- Spatial and temporal characteristics of human brucellosis,from 2004 to 2012 in Shandong province
- 中华流行病学杂志, 2014, 35(8): 925-929
- Chinese Journal of Epidemiology, 2014, 35(8): 925-929
- http://dx.doi.org/10.3760/cma.j.issn.0254-6450.2014.08.011
-
文章历史
- 投稿日期:2014-4-7
2. 山东省疾病预防控制中心细菌性传染病防治所
2 Institute of Bacterial Infectious Disease Control and Prevention, Shandong Provincial Center for Disease Control and Prevention
布鲁氏菌病(布病)2004-2010年分布于我国41%(1 201/2 922)的县(区),发病率增长近4倍[1]。本研究分析山东省布病时空分布特征,为布病的预防控制策略及措施调整提供参考依据。
资料与方法1. 资料来源:2004-2012年布病疫情资料来自于山东省传染病疫情信息网络直报系统中实验室确诊的病例。基本人口资料数据来自山东省统计局。基础地图为山东省1 ∶ 100 000数字地图,各县(区)的经纬度来自Google Earth。
2. 研究方法:基于ArcGIS 10.0软件,将布病发病资料与山东省各县(区)矢量化地形图结合,建立布病数据库。利用布病发病率绘制专题图。采用SaTScan 7.0软件,基于泊松模型进行时间、空间及时间趋势下的空间变异分析,确定布病聚集区域,计算聚集区内RR值及对数似然比(LLR),统计学检验水平为P=0.05。
3. 诊断标准[2]:确诊病例有流行病学接触史,临床出现发热、多汗、乏力、肌肉和关节疼痛及淋巴结、肝、脾和睾丸肿大,实验室初筛中任意1项阳性:平板凝集实验(PAT)、虎红平板凝集试验(RBPT)或皮肤过敏试验阳性或可疑;且血清学试验或分离细菌中任何1种方法阳性者。
4. 统计学分析:基于ArcGIS 10.0地理信息系统软件、空间聚集分析软件SaTScan 7.0软件进行时空聚集分析,空间自相关分析、时间聚集性分析,探讨该病的时空分布特征。
结 果1. 一般特征:2004-2012年山东省经实验室确诊病例数分别为35、91、95、132、107、145、180、419、598,共计1 802例(2007年及2009年分别有2例地址不详),发病率(/10万)分别为 0.038 2、0.099 0、0.102 7、0.141 8、0.115 3、0.154 0、0.191 1、0.437 4、0.620 5,年均0.211 1,发病率上升趋势明显。
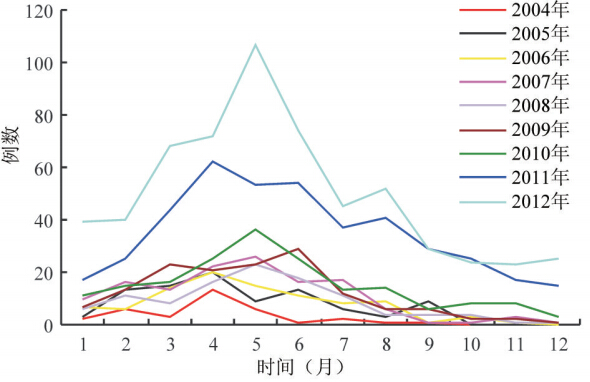
2. 时间聚集分布:1-12月布病发病人数分别为102(5.66%)、145(8.05%)、204(11.32%)、271(15.04%)、298(16.54%)、241(13.37%)、151(8.38%)、136(7.55%)、86(4.77%)、67(3.72%)、55(3.05%)、46(2.55%),以3-6月高发(56.27%,1 014/1 802),见图 1。根据集中度分布公式计算,M=0.375 3。
 |
| 图 1 2004-2012年山东省布病发病月份分布 |
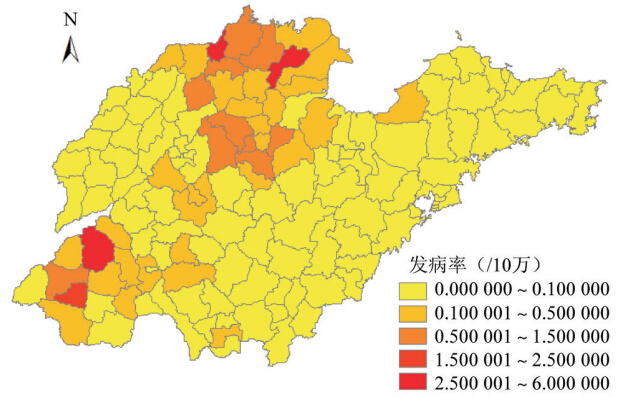
3. 空间分布:2004-2012年布病分布县(区)个数分别为10(7.14%)、15(10.71%)、19(13.57%)、21(15.00%)、21(15.00%)、33(23.57%)、39(27.86%)、68(48.57%)、87(62.14%),累计分布县(区)为107个(76.43%)。发病率(/10万)前五位的县(区)为利津(5.94)、郓城(2.59)、庆云(2.58)、定陶(1.72)和沾化(1.32),主要位于山东北部和西南部,在空间上有由北部向中部、由西向东地逐渐扩大趋势,东部沿海威海、烟台也有病例出现,且范围扩大,最多出现在2011年利津县(22.40/10万),见图 2、3。
 |
| 图 2 2004-2012年山东省布病发病率地区分布 |
 |
| 图 3 2004-2012年山东省各年度布病发病率分布 |
4. 时空变化特征:
(1)全局空间自相关分析:对2004-2012年山东省布病发病率以县为基本单位进行全局空间自相关分析。布病发病率的全局Moran’s I指数值为0.198 901,理论值为-0.007 194(P=0.000 120),提示布病在全省范围内为非随机分布,存在空间正相关性。2006、2007、2009-2012年山东省布病发病率的Moran’s I值均在0.05的检验水准下有统计学意义,且均Moran’s I>0,显示为空间正相关,提示2004、2005、2008年布病在全省范围内为随机分布。
(2)局部空间自相关分析(LISA):河口、利津、庆云、阳信、无棣、沾化、牡丹、定陶8县(区)局部Moran’s I值均有统计学意义(P<0.05),提示存在空间正相关,均属于“高高”(HH)聚集,即发病率高发区被发病率较高区包围,经LISA可视化图显示山东省西南和北部为高发区,与发病率较高地区空间位置一致。
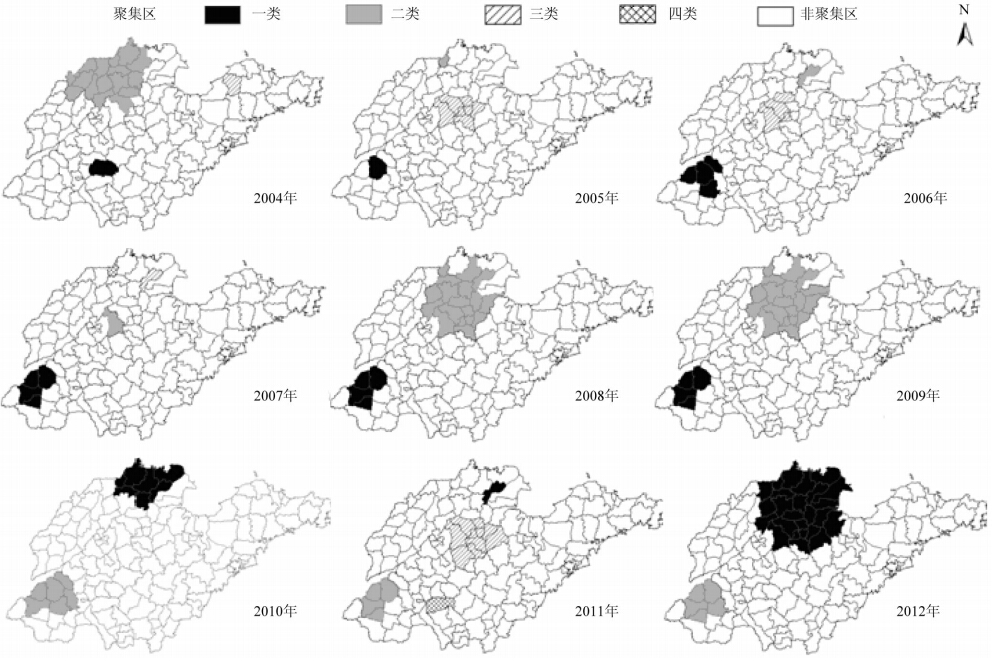
5. 空间聚集性分析:2004-2012年山东省布病存在两类布病高发时空聚集区。一类聚集区是以菏泽市鄄城县为中心点,辐射半径为33.83 km(LLR=682.22,P<0.01,RR=9.78),包括牡丹、郓城、鄄城、定陶4个县(区);二类聚集区是以滨州市滨城区为中心点,包括济阳、商河、章丘、淄川、张店、临淄、周村、桓台、高青、东营、河口、垦利、利津、广饶、寿光、庆云、乐陵、滨城、惠民、阳信、无棣、沾化、博兴、邹平24个县(区),辐射半径为62.78 km(LLR=495.49,P<0.01,RR=4.99),见图 4。8处空间正相关县(区)均在两类聚集区域内,呈现100%的一致性。
 |
| 图 4 2004-2012年山东省各年度布病时空聚集区分布 |
不同年份布病的空间聚集区域存在移动现象。一类聚集区范围有逐年扩大的趋势,自2006年以来,西南部(菏泽市)一直是重要聚集区;山东省西北部、北部聚集区逐渐向中部扩散,聚集区主要聚集在东营、德州、淄博市;2011年中西部济南、淄博市也形成聚集区(图 5)。
 |
| 图 5 2004-2012年山东省布病时空聚集区分布 |
2004-2012年山东省经实验室确诊病例共计1 802例,按集中度分布法计算,M=0.375 3,提示山东省布病流行具有一定季节性,和常彩云等[3]研究相似。
近年来许多学者应用空间分析方法分析结核病、麻疹、恙虫病等多种传染病的流行病学特征[4, 5, 6]。冯海欢等[7]及张俊辉等[8]根据该方法均发现布病分布具有空间异质性,本研究显示,发病主要分布于山东省西南部鲁西平原和北部的鲁北平原,2011年东营市利津县发病率高达22.40/10万。采用全局和局部Moran’s I空间自相关分析显示,2004-2012年山东省各县(区)发病率的空间分布呈现非完全随机性。LISA显著性地图和聚集地图将空间自相关分析进行可视化,发现8处“HH”空间聚集区。基于SaTScan 7.0软件,空间分析发现两类聚集区,一类为以菏泽市鄄城县为中心点、辐射半径为33.83 km(LLR=682.22,P<0.01,RR=9.78),另一类以滨州市滨城区为中心点,辐射半径为62.78 km(LLR=495.49,P<0.01,RR=4.99)。8处空间正相关县(区)均在两类聚集区域内,呈现100%的一致性。出现聚集可能与羊类等牲畜密度及肉类加工业发达有关[9],山东省养殖羊牧区主要位于鲁北平原(东营、德州市等)和鲁西平原(菏泽市等),且利津县盐窝镇有山东省最大的肉用羊胴体集散地[10]。人们在聚集区内多从事放牧、屠宰、售卖羊类等畜产品加工行业,接触患病牲畜的机会大,由于防护意识缺失及防护措施落后,从而使该地区发病较多。
布病防控重点区域应该综合考虑发病率高低及是否具有空间聚集性及聚集程度。布病发病率分布地图显示该病由北部向中部、由西向东范围逐渐扩大,东部沿海威海、烟台市出现病例,且范围扩大。与监测到的不同年份空间聚集区域移动方向一致。一类聚集区范围有逐年扩大的趋势,自2006年以来,西南部(菏泽市)一直是重要聚集区;扩散形成聚集区(包括东营、德州、淄博市);2011年中西部(济南)也形成聚集区,呈现疾病扩散的趋势。一方面是可能与羊肉养殖及加工业的发展迅速,需求量增大,牲畜及畜产品的交流频繁所致;另一方面可能与新聚集区内人们防范意识不足有关。提示该病存在蔓延趋势,应加强对新聚集区的防控工作。
| [1] Li YJ,Li XL,Liang S,et al. Epidemiological features and risk factors associated with the spatial and temporal distribution of human brucellosis in China[J]. BMC Infect Dis,2013,13(1):547. |
| [2] The Bureau of Disease Prevention and Dontrol of Ministry of Health. The Manual of Brucellosis Control [M]. Beijing:People's Medical Publishing House,2008:115-116.(in Chinese)卫生部疾病预防控制局. 布鲁氏菌病防治手册[M]. 北京:人民卫生出版社,2008:115-116. |
| [3] Chang CY, Xu SH, Geng XY,et al. Using concentration and circular distribution method to analyze the Jinan seasonal characteristics of the major infectious diseases[J]. Chin J Prev Med,2012,13(2):140-142.(in Chinese)常彩云,徐淑慧,耿兴义,等. 应用集中度和圆形分布法分析济南市主要传染病的季节性特征[J]. 中国预防医学杂志,2012,13(2):140-142. |
| [4] Zhu YH,Xu Q,Li XJ,et al. Analysis of the spatial and temporal characteristics of measles patients younger than 1 year old in Shandong province[J]. Chin J Prev Med,2012,46(10):898- 902.(in Chinese)朱毓卉,许青,李秀君,等. 山东省一岁以下婴儿麻疹病例时空分布特征分析[J]. 中华预防医学杂志,2012,46(10):898-902. |
| [5] Liu YX, Li SX, Xue FZ, et al. The application of space epidemiological research methods in the study of tuberculosis (TB) [J]. Chin J Prev Med,2010,44(4):351-354.(in Chinese)刘云霞,李士雪,薛付忠,等. 空间流行病学研究方法在结核病研究中的应用[J]. 中华预防医学杂志,2010,44(4):351-354. |
| [6] Ding L,Li Z,Wang XJ,et al. Analysis of epidemic features of scurb typhus between year 2006 and 2010 in Shandong province,China[J]. Chin J Prev Med,2012,46(4):338-342.(in Chinese)丁磊,李忠,王显军,等. 2006-2010 年山东省恙虫病流行特征分析[J]. 中华预防医学杂志,2012,46(4):338-342. |
| [7] Feng HH,Yin F, Li XS, et al. The application of Besag-Newell methods in the spatial clustering analysis of brucellosis in Inner Mongolia[J]. Chin Mag Dis Control,2011,15(6):527-530.(in Chinese)冯海欢,殷菲,李晓松,等. Besag-Newell方法在内蒙古布鲁氏菌病空间聚集性分析的应用初探[J]. 中华疾病控制杂志,2011,15(6):527-530. |
| [8] Zhang JH,Feng ZJ,Jiang M,et al. Using exploratory spatial data analysis(ESDA) on the regional distribution of human brucellosis in six provinces of north China:2004-2007[J]. Chin J Epidemiol,2011,32(12):1278-1284.(in Chinese)张俊辉,冯子健,蒋敏,等. 探索性空间数据分析在中国北方 6 省(区)布鲁氏菌病地区分布研究中的应用[J]. 中华流行病学杂志,2011,32(12):1278-1284. |
| [9] Lee HS,Her M,Levine M,et al. Time series analysis of human and bovine brucellosis in South Korea from 2005 to 2010[J]. Prev Vet Med,2013,110(2):190-197. |
| [10] Wang SJ,Hu P,Ru Y,et al. Developing status and problems of mutton sheep industry in Shandong province and countermeasures[J]. Shandong Agricult Sci,2013,45(4):118-122.(in Chinese)王守经,胡鹏,汝医,等. 山东省肉羊产业发展现状、存在问题及对策[J]. 山东农业科学,2013,45(4):118-122. |
 2014, Vol. 35


