 2025, Vol. 36


The increasing demand of the high volume and mass energy density batteries for mobile applications like (hybrid) electric vehicles and laptops calls for the next-generation energy storage devices [1,2]. Sodium (Na) ion batteries (SIBs) are expected to be one of the most promising candidates due to Na’s high abundance in the earth’s crust, low cost, as well as its relatively negative standard potential (−2.71 V vs. SHE) and high theoretical capacity (1166 mAh/g) [3-7]. However, conventional organic electrolytes currently applied in SIBs, like carbonate esters and ethers, regardless of their good ionic conductivity, sufficient salt solubility and low viscosity [8-10], suffer from high flammability and low resistance to electrochemical reduction, which arise safety concern and constrain the coulombic efficiency of SIBs [11-13].
Ionic liquids (ILs), also named room-temperature molten salts, which typically consist of organic cations and anions and are generally in liquid phase at ambient temperature [14], possess the superiority of non-flammability, negligible volatility, designable nature, and high thermal stability [15-17]. Specifically, ILs doped with sodium salts have been extensively researched as electrolyte for SIBs [18-20]. Primarily, such salt-in-ionic liquid electrolytes (SILEs) can function stably and even possess better transport properties at high temperature that organic solvent reaching its ignition point, and thus guarantee the safety of SIBs under harsh conditions [21]. Besides, SILEs have wide electrochemical window, which provides well-behaved cycle stability even in direct contact with Na anode [22].
Despite these advantages, the ionic conductivity (σ) of SILEs is relatively low compared to organic electrolytes, originating from the strong coulombic interactions between cations and anions, especially at low temperature, which leads to large internal resistance in such electrolytes [23]. While some efforts have been put on to increase σ like substitution of functional groups thanks to the designing nature of ILs [24], adjusting the salt fraction of SILEs is considered another simple but feasible scheme [25]. Via molecular dynamics (MD) simulations, Molinari and coworkers [26] observed a low and even negative conductivity of Na+ in NaFSI−C3C1PyrrFSI (C3C1Pyrr+: N-methyl-N-propylpyrrolidinium, FSI−: bis(fluorosulfonyl)imide) at low molar fraction of NaFSI, i.e., x(NaFSI). They further demonstrated that the conductivity of Na+ increases with higher molar fraction of Na+ in the SILE, which is also supported both experimentally [27] and computationally [28]. It should be kept in mind that the higher ionic conductivity of Na+, i.e., σNa+ = σ × tNa+, is desired, because other ions are electrochemical inert during SIB operation. A negative transference number of Na+ (tNa+) means that Na+’s tend to migrate with anions during SIB operation, which increases internal resistance of such SILEs.
Generally, adding more salt will sacrifice σ of SILEs due to the stronger interaction between Na+ and anions, though accompanying with higher tNa+. Matsumoto and coworkers found in NaFSI−C3C1PyrrFSI that σNa+ was highest when the molar fraction of NaFSI was in the range of 0.2–0.4 at temperature T=353 K [29], which was in agreement with their earlier observation that the highest rate performance was achieved with x(NaFSI)=0.4 at T = 363 K [30]. Indeed, the rate performance of the SIB is determined by σNa+, rather than σ, as only Na+’s shuttle rapidly between cathode and anode during the charge/discharge process. Thus, it is of interest to study how σNa+ varies with the molar fraction of Na salt in SILEs [31].
In this study, we use molecular dynamics (MD) simulations to investigate σNa+ in the SILE, (NaFSI)x(EMIMFSI)1-x (EMIM+: 1-ethyl-3-methylimidazolium), with various x from 0.1 to 0.7 at T = 298 K. The reason that we choose this specific SILE is that it was found ILs with imidazolium-based cations often possess higher ionic conductivity compared to other cations [32,33], while FSI−-based ILs also exhibit better transport properties than other anions [34]. MD simulations were carried out to calculate σ, tNa+ and σNa+, and their correlations with the liquid structure at different x(NaFSI) are discussed. Methods and force field parameters are summarized in Supporting information.
Table 1 lists the ionic conductivities and the transference numbers of Na+ of the SILE (NaFSI)x(EMIMFSI)1-x with different molar fraction x at T = 298 K. It can be seen that the simulated ionic conductivities are in good agreement with the experimental measurements, demonstrating the reasonable force field applied in the MD simulations, which can also be seen from the good consistency between the simulated and experimental mass densities in Table S5 (Supporting information). Apart from that, Table 1 shows that tNa+ increases monotonically, while σ decreases monotonically with higher x. At low x=0.1, tNa+ is even negative. Recent study also demonstrated the improved tNa+ in SILEs with higher Na+ concentration [28]. Such monotonically increasing tNa+ with higher x is expected, because in the high x, Na+’s become the dominant cations that contribute to σ, while the center-of-mass of SILE remains static in the MD simulation [35].
|
|
Table 1 Comparisons between simulated and experimental ionic conductivity (mS/cm), the simulated ionic conductivity of Na+ (σNa+), and the simulated transference number of Na+ (tNa+) of the SILE (NaFSI)x(EMIMFSI)1-x at T=298 K. |

It can be seen from Table 1 that σNa+ is the balance between monotonically decreasing σ and monotonically increasing tNa+ with x, and peaks at x=0.5. For a SILE in SIB, it is desired to optimize σNa+ to improve the rate performance [38]. Thus, it is of interest to investigate the origin of the highest σNa+, which occurs at x=0.5. In order to detect the impact of x on the transport of Na+, we further partition the individual contribution of σNa+ to the self contribution σNa+s as the result of the displacement of the same Na+, the distinct contribution σNa+−Na+d for the cross correlations among different Na+’s, as well as the cross correlations σNa+−EMIM+ and σNa+−FSI− between Na+ and other ions, respectively. The above individual contributions to σNa+ at different x are shown as histograms in Fig. 1, which also presents σ and σNa+ as lines for comparison.

|
Download:
|
Fig. 1. Ionic conductivity σ (black line) of (NaFSI)x(EMIMFSI)1-x and individual contributions σNa+ind to σNa+ (red line) at various x, including self contribution of Na+ 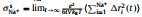 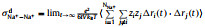 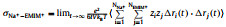 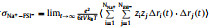 |
|
In the Nernst-Einstein limit, only σNa+s contributes to σNa+, i.e., σNa+ = σNa+s, because motions of different ions are independent and, thus, uncorrelated. Fig. 1 shows that σNa+s is peaked at x=0.3, as a balance between the number of specific charge carries, Na+’s, and the decreasing mobility with higher x. Apart from that, σNa+−Na+d, σNa+−EMIM+, and σNa+−FSI− are all negative for all the inspected x, and the resulting σNa+ is much smaller than σNa+s. Thus, there exist strong ionic correlations that deviate much from the Nernst-Einstein relation, as expected in SILEs solely composed of bare ions [39].
Generally, the negative σNa+−Na+d and σNa+−EMIM+ denote that different cations tend to migrate along opposite directions under external electric field, while the negative σNa+−FSI− denotes Na+ and FSI− tend to migrate together along the same direction under external electric field. Such strongly correlated ionic motion may be understood from the coordination structure, negatively charged cluster, such as [Li+(TFSI−)2]− in SILE of lithium salt, as discussed by Schonhoff [40], and also found in MD simulations [41].
Figs. 2a and b show a series of center-of-mass (cm) radial distribution functions between Na+ and FSI− and atomistic site-site radial distribution functions between Na+ and O-atoms on FSI−, as well as corresponding cumulative distribution functions, for which x=0.1, 0.3, 0.5, and 0.7 respectively. It can be seen from Figs. 2a and b that while 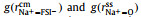


|
Download:
|
Fig. 2. (a) Center-of-mass radial distribution functions (solid lines) between Na+ and FSI−,       |
|
In order to further characterize the coordination structure of Na+ corresponding to the double-peak pattern of 

|
Download:
|
|
Fig. 3. Two-dimensional probability distribution, P( |
|
As x increases from 0.1 to 0.7, the number ratio of FSI− to Na+ decreases from 10:1 to 10:7. Intuitively, due to the strong electrostatic interaction, there should be more FSI−’s in the first solvation shell of Na+ at low x. In this case, coordinating FSI−’s tend to take the monodentate manner in order to reduce the mutual repulsion among them. However, it can be viewed vividly from Fig. 3 that the actual scenarios are counter-intuitive. At high x, the monodentate coordinating FSI− with
To clarify the influence of x on the distribution of AGGs in the SILEs, Fig. 4 shows the normalized two-dimensional probability distributions, 


|
Download:
|
Fig. 4. Two-dimensional probability distributions,  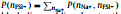  |
|
It is of interest to note that at x = 0.5,
In summary, we use MD simulations to investigate the SILE, (NaFSI)x(EMIMFSI)1-x, with various x from 0.1 to 0.7 at T = 298 K. MD simulations show that though σ decreases monotonically with increasing x, σNa+ peaks at x = 0.5. In the practical operation of SIBs, an appropriate molar fraction of Na salt is desired. Thanks to the wide electrochemical window and safety of ionic liquids electrolytes, it enables SIBs to be operated at higher voltage and, thus, high energy density can be stored and delivered. However, the application of SILEs is limited by its low ionic conductivity and thus it is difficult to be operated at high power density. The current study highlights the impact of molar fraction of Na+ in SILEs, and emphasizes the design of the electrolyte with high σNa+ because Na+ is the only electrochemically active species in SILEs. We hope this work will contribute on the optimization of SILEs with fast transport of Na+ to support high rate performance of SIBs.
Declaration of competing interestThe authors declare that they have no competing interests.
CRediT authorship contribution statementYuhao Zhou: Data curation, Formal analysis, Investigation, Software, Validation, Visualization, Writing – original draft. Siyuan Wu: Data curation, Formal analysis, Methodology, Software, Validation. Xiaozhe Ren: Data curation, Formal analysis, Investigation, Software, Visualization, Writing – review & editing. Hongjin Li: Data curation, Software, Validation, Visualization. Shu Li: Formal analysis, Investigation, Methodology, Project administration, Supervision, Validation, Visualization, Writing – review & editing. Tianying Yan: Conceptualization, Data curation, Formal analysis, Funding acquisition, Investigation, Methodology, Project administration, Software, Supervision, Validation, Writing – original draft, Writing – review & editing.
AcknowledgmentThis study is supported by National Natural Science Foundation of China (No. 22273040).
Supplementary materialsSupplementary material associated with this article can be found, in the online version, at doi:10.1016/j.cclet.2024.110048.
| [1] |
J. Xiang, L. Yang, L. Yuan, et al., Joule 3 (2019) 2334-2363. DOI:10.1016/j.joule.2019.07.027 |
| [2] |
D. Zhang, L. Li, W. Zhang, et al., Chin. Chem. Lett. 34 (2023) 107122. DOI:10.1016/j.cclet.2022.01.015 |
| [3] |
G.G. Eshetu, G.A. Elia, M. Armand, et al., Adv. Energy Mater. 10 (2020) 2000093. DOI:10.1002/aenm.202000093 |
| [4] |
R. Usiskin, Y. Lu, J. Popovic, et al., Nat. Rev. Mater. 6 (2021) 1020-1035. DOI:10.1038/s41578-021-00324-w |
| [5] |
Y. Zhao, K.R. Adair, X. Sun, Energy Environ. Sci. 11 (2018) 2673-2695. DOI:10.1039/c8ee01373j |
| [6] |
J.Y. Hwang, S.T. Myung, Y.K. Sun, Chem. Soc. Rev. 46 (2017) 3529-3614. DOI:10.1039/C6CS00776G |
| [7] |
B. Dunn, H. Kamath, J.M. Tarascon, Science 334 (2011) 928-935. DOI:10.1126/science.1212741 |
| [8] |
Y. Li, F. Wu, Y. Li, et al., Chem. Soc. Rev. 51 (2022) 4484-4536. DOI:10.1039/d1cs00948f |
| [9] |
A. Ponrouch, E. Marchante, M. Courty, J.M. Tarascon, M.R. Palacín, Energy Environ. Sci. 5 (2012) 8572-8583. DOI:10.1039/c2ee22258b |
| [10] |
A. Ponrouch, D. Monti, A. Boschin, et al., J. Mater. Chem. A 3 (2015) 22-42. DOI:10.1039/C4TA04428B |
| [11] |
H. Che, S. Chen, Y. Xie, et al., Energy Environ. Sci. 10 (2017) 1075-1101. DOI:10.1039/C7EE00524E |
| [12] |
I. Hasa, S. Mariyappan, D. Saurel, et al., J. Power Sources 482 (2021) 228872. DOI:10.1016/j.jpowsour.2020.228872 |
| [13] |
Y. Huang, L. Zhao, L. Li, et al., Adv. Mater. 31 (2019) 1808393. DOI:10.1002/adma.201808393 |
| [14] |
H. Liu, H. Yu, J. Mater. Sci. Technol. 35 (2019) 674-686. DOI:10.1016/j.jmst.2018.10.007 |
| [15] |
M. Armand, F. Endres, D.R. MacFarlane, H. Ohno, B. Scrosati, Nat. Mater. 8 (2009) 621-629. DOI:10.1038/nmat2448 |
| [16] |
D.R. MacFarlane, N. Tachikawa, M. Forsyth, et al., Energy Environ. Sci. 7 (2014) 232-250. DOI:10.1039/C3EE42099J |
| [17] |
M. Watanabe, M.L. Thomas, S. Zhang, et al., Chem. Rev. 117 (2017) 7190-7239. DOI:10.1021/acs.chemrev.6b00504 |
| [18] |
H. Yang, J. Hwang, Y. Wang, K. Matsumoto, R. Hagiwara, J. Phys. Chem. C 123 (2019) 22018-22026. DOI:10.1021/acs.jpcc.9b05941 |
| [19] |
C.V. Manohar, A.K. Raj, M. Kar, et al., Sustain. Energy Fuels 2 (2018) 566-576. DOI:10.1039/c7se00537g |
| [20] |
P. Kubisiak, A. Eilmes, J. Phys. Chem. B 121 (2017) 9957-9968. DOI:10.1021/acs.jpcb.7b08258 |
| [21] |
T. Yim, M.S. Kwon, J. Mun, K.T. Lee, Isr. J. Chem. 55 (2015) 586-598. DOI:10.1002/ijch.201400181 |
| [22] |
H. Sun, G. Zhu, X. Xu, et al., Nat. Commun. 10 (2019) 3302. DOI:10.1038/s41467-019-11102-2 |
| [23] |
M. McEldrew, Z.A.H. Goodwin, N. Molinari, et al., J. Phys. Chem. B 125 (2021) 13752-13766. DOI:10.1021/acs.jpcb.1c05546 |
| [24] |
P.J. Fischer, M.P. Do, R.M. Reich, et al., Phys. Chem. Chem. Phys. 20 (2018) 29412-29422. DOI:10.1039/c8cp06099a |
| [25] |
Z. Wang, L.P. Hou, Q.K. Zhang, et al., Chin. Chem. Lett. 35 (2024) 108570. DOI:10.1016/j.cclet.2023.108570 |
| [26] |
N. Molinari, J.P. Mailoa, N. Craig, J. Christensen, B. Kozinsky, J. Power Sources 428 (2019) 27-36. DOI:10.1016/j.jpowsour.2019.04.085 |
| [27] |
M. Forsyth, H. Yoon, F. Chen, et al., J. Phys. Chem. C 120 (2016) 4276-4286. DOI:10.1021/acs.jpcc.5b11746 |
| [28] |
F. Chen, P. Howlett, M. Forsyth, J. Phys. Chem. C 122 (2018) 105-114. DOI:10.1021/acs.jpcc.7b09322 |
| [29] |
K. Matsumoto, Y. Okamoto, T. Nohira, R. Hagiwara, J. Phys. Chem. C 119 (2015) 7648-7655. DOI:10.1021/acs.jpcc.5b01373 |
| [30] |
C. Ding, T. Nohira, R. Hagiwara, et al., J. Power Sources 269 (2014) 124-128. DOI:10.1016/j.jpowsour.2014.06.033 |
| [31] |
C.Y. Chen, T. Kiko, T. Hosokawa, et al., J. Power Sources 332 (2016) 51-59. DOI:10.1016/j.jpowsour.2016.09.099 |
| [32] |
R. Hagiwara, K. Matsumoto, J. Hwang, T. Nohira, Chem. Record 19 (2019) 758-770. DOI:10.1002/tcr.201800119 |
| [33] |
M. Galiński, A. Lewandowski, I. Stępniak, Electrochim. Acta 51 (2006) 5567-5580. DOI:10.1016/j.electacta.2006.03.016 |
| [34] |
N. Sánchez-Ramírez, B.D. Assresahegn, D. Bélanger, R.M. Torresi, J. Chem. Eng. Data 62 (2017) 3437-3444. DOI:10.1021/acs.jced.7b00458 |
| [35] |
H.K. Kashyap, H.V.R. Annapureddy, F.O. Raineri, C.J. Margulis, J. Phys. Chem. B 115 (2011) 13212-13221. DOI:10.1021/jp204182c |
| [36] |
P. Kubisiak, P. Wróbel, A. Eilmes, J. Phys. Chem. B 124 (2020) 413-421. DOI:10.1021/acs.jpcb.9b10391 |
| [37] |
K. Matsumoto, T. Hosokawa, T. Nohira, et al., J. Power Sources 265 (2014) 36-39. DOI:10.1016/j.jpowsour.2014.04.112 |
| [38] |
X. Zhang, M.V.M. Nitou, W. Li, et al., Chin. Chem. Lett. 34 (2023) 108245. DOI:10.1016/j.cclet.2023.108245 |
| [39] |
Y. Shao, K. Shigenobu, M. Watanabe, C. Zhang, J. Phys. Chem. B 124 (2020) 4774-4780. DOI:10.1021/acs.jpcb.0c02544 |
| [40] |
M. Gouverneur, F. Schmidt, M. Schönhoff, Phys. Chem. Chem. Phys. 20 (2018) 7470-7478. DOI:10.1039/c7cp08580j |
| [41] |
P. Wróbel, P. Kubisiak, A. Eilmes, J. Phys. Chem. B 125 (2021) 10293-10303. DOI:10.1021/acs.jpcb.1c05793 |
| [42] |
J. Tong, S. Wu, N. von Solms, et al., Front. Chem. 7 (2020) 945-954. DOI:10.3389/fchem.2019.00945 |