b Jiangsu Co-Innovation Center of Efficient Processing and Utilization of Forest Resources; International Innovation Center for Forest Chemicals and Materials College of Chemical Engineering, Nanjing Forestry University, Nanjing 210037, China;
c Institute of Nanochemistry and Nanobiology School of Environmental and Chemical Engineering, Shanghai University, Shanghai 200444, China
With the consumption of traditional fossil fuels, the increasing CO2 concentrations has resulted in serious environmental problems. Electrochemical CO2 reduction reaction (CO2RR) has been regarded as an environmental and sustainable approach to convert CO2 into value-added chemicals or fuels. CO2 molecule is chemically inert with two stable C=O bond structure and the products from CO2RR is uncontrollable due to the proton coupled multi-electron transfer process [1]. Hence, there are great challenges in designing and preparing efficient electrocatalysts to directionally produce specific product.
Metal-based electrocatalysts for CO2RR can be divided into pure metal catalysts and carbon-supported metal catalysts. The former includes metal oxide, sulfide or alloy such as CuO, Cu2O, SnO2, MoS2 [2–7]. The latter one refers the metal nanoparticles or single atom dispersed on heteroatoms doped carbon, for example, single-atom Ni atoms incorporated N-doped carbon [2,8–11]. Nevertheless, the metallic catalysts have the disadvantages of low conductivity, easy aggregation, low stability, which hinder the practical application [12,13]. Metal-free carbon material is the more promising alternative due to the abundant reserve, tunable property [13–17]. Heteroatom doping is the most widely-used method for creating or modulating catalytic sites in carbon materials, especially, N atom doping, which has been applied in various electrochemical reactions [18–21]. Recently, N doped carbon materials were applied to CO2RR [22] and CO is the main product [23–25]. To further enhance catalytic activity, dual heteroatoms doping were proposed to modulate the electronic environment of N active sites [4]. For instance, the N, P-codoped carbon and N, S-codoped carbon boost CO2 reduction to CO with the faradaic efficiency (FE) of over 90% [26]. However, the enhanced activity of dual heteroatoms co-doped carbon catalysts is obscurely attributed to the synergistic effect of heteroatoms and the main products are confined to CO [19,27].
Herein, we fabricate a porous carbon for boosting CO2 conversion to CH4 by the synergistic effect of the predominant pyridinic N-B sties and typical nanostructure of in situ formed hierarchical structure of graphene nanoribbons/amorphous carbon. The overall hierarchical porous structure promotes mass transport and graphene nanoribbons effectively accelerate ion/electron transport during CO2RR. The as-prepared electrocatalyst exhibits excellent selectivity and stability toward reduction of CO2 to CH4 with a high faradaic efficiency (FE) of 68% at low potential (−0.50 V vs. RHE). The density functional theory (DFT) demonstrates the key active site of pyridinic N-B by modulating adsorbed energy of *CO and *CH2O.
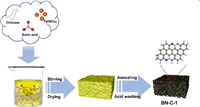
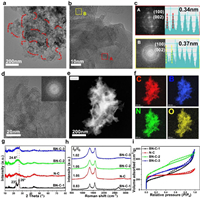
The synthetic route of B, N-codped porous carbon (BN-C-1) is illustrated in Fig. 1. The precursors of chitosan (C, N precursor), high-concentration 1.0 mol/L H3BO3 (B precursor) and Fe(NO3)3 (pore-forming agent and catalyst) were dissolved into DI water and uniformly mixed. The dried hydrogel was annealed at 800 ℃ for 10 h under an inert atmosphere followed by HCl (1.0 mol/L). As the control sample, the N-doped carbon (N-C) was fabricated at the same conditions but without the addition of H3BO3. In order to explore the effect of high-concentration H3BO3 and Fe(NO3)3 on the structure and active sites, one B, N-codoped carbon (BN-C-2) was prepared by adding low-concentration H3BO3 (0.5 mol/L) and another B, N-codoped carbon (BN-C-3) was prepared by no adding Fe(NO3)3. In high-resolution transmission electron microscopy (HR-TEM) image in Fig. 2a, the BN-C-1 shows the 3D hierarchical nanostructure composed of porous amorphous carbon and homogeneously dispersed crystal graphene nanoribbons remarked with red dotted line. The magnified HR-TEM image exhibits well-arranged crystal graphene nanoribbons and irregularly-arranged porous amorphous carbon in Fig. 2b. In the fast Fourier transform (FFT) patterns and lattice fringes of selected regions (Fig. 2c), the crystal graphene ribbons show clear spot lattices planes with a graphene lattice space of 0.34 nm from the A area of Fig. 2b, while the amorphous carbon has a ring pattern with a lattice space of 0.37 nm from the B area of Fig. 2b. Compared to the BN-C-1, the N-C only shows an amorphous structure and the lattice space is up to 0.37 nm (Fig. 2d), which demonstrates the enhanced effect of high-concentration H3BO3 (1.0 mol/L) on the formation of graphene nanoribbons. The BN-C-2 and BN-C-3 all show a hierarchically porous carbon structure demonstrating that the high-concentration H3BO3 and Fe(NO3)3 play the equally important role in the formation of graphene nanoribbons (Figs. S1 and S2 in Supporting information). As shown in the HAADF-STEM mapping images (Figs. 2e and f), the N, B element mappings were evenly distributed over the whole BN-C-1 porous structure, indicating the homogeneous N, B doping.

|
Download:
|
| Fig. 1. The schematic procedure of synthesis of porous BN-C-1. | |

|
Download:
|
| Fig. 2. (a, b) The HR-TEM images of the BN-C-1 (the graphene nanoribbons remarked with red dotted line). (c) The lattice fringe and FFT pattern of the selected areas in Fig. 2b. (d) The HR-TEM images of N-C (inset: the lattice fringe and FFT patterns. (e) The HAADF-STEM image of BN-C-1. (f) The elemental mapping images of the BN-C-1, C (red), B (blue), N (green), O (yellow). (g-i) The XRD spectra, XRD patterns and N2 adsorption-desorption isotherms of BN-C-1, N-C, BN-C-2, and BN-C-3. | |
In X-ray diffraction (XRD) patterns (Fig. 2g), the BN-C-1 exhibits two typical (002) peaks located at 23° and 26° corresponding to amorphous carbon structure and crystal graphene structure, respectively [28–30]. To the contrary, the N-C, BN-C-2 and BN-C-3 just show a broad (002) peak revealing more abundant defect sites and higher disorder. The Raman spectra of BN-C-1 and N-C exhibit D band (disordered sp3 carbon) at 1336 cm−1 and G band (graphitic sp2 carbon) at 1570 cm−1 (Fig. 2 h). Compared to the intensity ratio (ID/IG) of ~1.0 in N-C, BN-C-2 and BN-C-3, the lower ratio of 0.83 in the BN-C-1 demonstrates the higher carbon crystallinity derived from the existence of crystal graphene nanoribbons. Remarkably, the BN-C-1 has a sharp 2D peak at 2664 cm−1 illustrating the graphene nanoribbon with approximately 20 layers [18]. The surface area and pore structure were determined by N2 adsorption/desorption measurements in Fig. 2i and Fig. S3 (Supporting information). The Brunauer-Emmett-Teller (BET) surface area of BN-C-1, N-C, BN-C-2 and BN-C-3 were 800 m2/g, 833 m2/g, 1349 m2/g, 1093 m2/g, respectively. Compared to BN-C-1, the BN-C-2 and BN-C-3 show amorphous structure and more abundant micropores, which leads to high BET surface area. Although the N-C has similar BET surface area to the BN-C-1, the later has a more pronounced microporous/mesoporous structure according to the pore size distribution. The abundant mesoporous structure is beneficial to ion and gas transport during CO2RR [10].
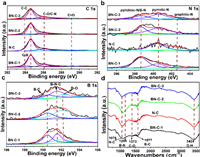
The surface compositions were determined by X-ray photoelectron spectroscopy (XPS). The B (5.00 at%) and N (4.00 at%) peaks demonstrate the successful B, N doping in the BN-C-1 (Fig. S4 in Supporting information). The presence of Fe(NO3)3 in BN-C-1 and BN-C-2 can promote incorporation of pyridinic N-B into carbon matrix leading to more B dopants. So, the B content of BN-C-1 (4.78%) is higher than that of BN-C-2 (3.06%) and BN-C-3 (2.26%). In the C 1s spectra of the BN-C-1 (Fig. 3a), the C-B and C-N peaks demonstrate B, N atoms doping into carbon matrix. In the N 1s spectra (Fig. 3b), compared to pyridinic-N at 398.40 eV in N-doped carbon material [28], the BN-C-1 shows a main peak at 398.70 eV. The increasing binding energy for pyridinic N specie can be attributed to the formation of pyridinic N-B configuration, which has been demonstrated by our previous research [28]. The pyridinic N-B accounts for 80% to all the N species. Meanwhile, the pyrrolic N-B configuration also appears and its binding energy increases to 400.60 eV from the 400.40 eV of pyrrolic N in the N-C. As further demonstrated in B, N co-doped graphene, the edge N configurations (pyridinic-N and pyrrolic-N) with unpaired electrons tend to bond with B atoms leading to the formation of B-N [28]. The higher N content in BN-C-1 and BN-C-3 than that in N-C and BN-C-2 indicates that the adding of B precursor can promote the N doping by formating stable B-N bonds. Besides, the B 1s spectra of BN-C-1, BN-C-2 and BN-C-3 (Fig. 3c) show three peaks at 190.50 eV, 191.30 eV and 192.30 eV assigned to B-C, B-N-C and B-O, respectively. Based on the above results and references [27,31], we affirm that the dominant N specie in N 1s spectrum and the B-N-C peak in B 1s spectrum is derived from the pyridinic N-B configuration. In order to further demonstrate the presence of pyridinic N-B structure, the Fourier transform infrared (FT-IR) spectrum was measured. The BN-C-1 shows obvious B-C (1076 cm−1), B-N (1204 cm−1) and N-C (1577 cm−1) peaks compared to the N-C, BN-C-2 and BN-C-3 (Fig. 3d).

|
Download:
|
| Fig. 3. (a-c) The C 1s, N 1s and B 1s XPS spectra of BN-C-1, N-C, BN-C-2, and BN-C-3. (d) The FT-IR spectra of BN-C-1, N-C, BN-C-2, and BN-C-3. | |
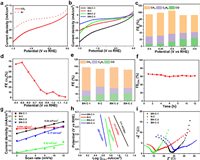
The electrocatalytic performance toward CO2RR was measured in a H-type cell using a standard three-electrode configuration with 0.1 mol/L KHCO3. The linear sweep voltammetry (LSV) was tested in CO2 and Ar-saturated electrolyte (Fig. 4a), and the much higher current density in CO2-saturated electrolyte demonstrates the high catalytic performance of the BN-C-1 to CO2 reduction. Compared to the N-C, BN-C-2 and BN-C-3 (Fig. 4b and Table S1 in Supporting information), the BN-C-1 shows the highest current density demonstrating the highest catalytic performance to CO2RR. Gas and liquid products were analyzed by online gas chromatography (GC) and nuclear magnetic resonance (NMR), respectively. The catalytic performance of BN-C-1 towards CO2RR was studied by the controlled potential electrolysis approach at the cathode potentials from −0.40 V to −0.60 V vs. RHE (Fig. 4c). The BN-C-1 shows the maximum FECH of 68.00% at −0.50 V vs. RHE, and the total FE of gas products is nearly 100% without liquid products. The 1H NMR spectra of the electrolyte after electrolysis over all potentials show no liquid product (Fig. S5 in Supporting information). In a wider potential range from −0.40 V to −1.10 V vs. RHE (Fig. 4d and Fig. S6 in Supporting information), the highest FECH of BN-C-1 is located at −0.50 V vs. RHE. In Fig. 4e, compared to the BN-C-2 (60.10%), BN-C-3 (52.02%) and N-C (51.00%), the BN-C-1 exhibits the largest FE (68.00%) of CH4 at −0.50 V vs. RHE which higher than most of the metal-free and metal-based electrocatalysts (Table S2 in Supporting information). Furthermore, the stability of BN-C-1 was evaluated by continuous CO2 reduction at −0.50 V vs. RHE for 12 h and no obvious decay appears in both current density and FECH in Fig. 4f.

|
Download:
|
| Fig. 4. (a) The LSV curves of BN-C-1 in the Ar- and CO2-saturated 0.1 mol/L KHCO3 solution. (b) The LSV curves of BN-C-1, N-C, BN-C-2, and BN-C-3 in the CO2-saturated 0.1 mol/L KHCO3 solution. (c) The FEs of BN-C-1 at the potentials of −0.40 ~ −0.60 V vs. RHE. (d) The FECH4 of BN-C-1 at the potentials of −0.40 ~ −1.10 V vs. RHE. (e) The FEs of BN-C-1, N-C, BN-C-2, and BN-C-3. (f) The FECH4 at −0.50 V on BN-C-1 for stability test during 12 h. (g) The charging current density differences plotted against scan rates. (h) The Tafel plots for CH4 production. (i) The Nyquist plots at −0.50 V vs. RHE. | |
To further explore the active origin, the electrochemical surface area (ECSA) via double-layer capacitance (Cdl) using cyclic voltammograms was estimated. Although the BN-C-2 has the highest ECSAs (0.32 mF/cm2), the BN-C-2 shows lower catalytic activity indicating the low activity of catalytic sites in Fig. 4g. The BN-C-1 (0.24 mF/cm2) and the BN-C-3 (0.174 mF/cm2) have similar ECSAs but the former shows the higher catalytic activity, which supports that the high catalytic activity of BN-C-1 is derived from the intrinsic activity of pyridinic N-B. The Tafel slopes were measured to analyze the kinetics for CO2RR. Compared to the N-C (173 mV/dec), BN-C-2 (288 mV/dec) and BN-C-3 (268 mV in Fig. 4 h, the lowest Tafel slope of BN-C-1 (111 mV/dec) demonstrates the significant decrease of reaction barrier for the first proton-coupled electron transfer process [22,27,32]. The charge transfer resistance (Rct) was measured by electrochemical impedance spectroscopy (EIS) at an open circuit potential (Fig. 4i and Fig. S7 in Supporting information) [25,32]. The BN-C-1 show high slope at low frequency (mass transfer control) indicating the high mass transfer due to the abundant mesopores and the slightly increased charge transfer resistance (Rct) of BN-C-1 at the high frequency can be attributed to the abundant B, N contents.
Based on the physical and electrochemical characterizations, the high activity and selectivity of BN-C-1 to CO2RR can be attributed to the abundant pyridinic N-B sites and the unique porous structure of crystal graphene nanoribbons/amorphous [33]. The porous structure is favorable for the exposure of active sites. The microporous channel can promote the migration of electrolyte, thereby forming a kind of ion buffer reservoir in the macropore and reducing the diffusion distance to the internal surface [17,34]. The porous structure provides a low resistance path for ion transfer and enhances the entry of electrochemical surface area and active sites [35–37]. Furthermore, the close contact between crystal graphene nanoribbons and amorphous carbon is beneficial to fast electron transport.
To understand the catalytic mechanism of pyridinic N-B configuration CO2RR to CH4, a DFT calculation on possible active sites was performed. According to the XPS data (Fig. 3), we designed four models: pyridinic N-B, pyrrolic N-B, graphitic N-B on graphene slab and the control graphene slab in Fig. 5a. The active sites are located on the B (N) atoms or their adjacent C atoms. The adsorption and activation of CO2 on the catalyst surface is the first step and the first proton-coupled electron is transferred to CO2 forming surface-adsorbed COOH*. The corresponding free-energy diagram for the lowest energy pathways of CO2RR to CH4 is shown in Fig. 5b and Table S3 (Supporting information). On the pyridinic N-B, the adsorption and activation of CO2 as one of rate-determining steps (RDS), is highly endergonic with a lowest free-energy change (ΔG) of 0.90 eV, while the other models shows higher ΔG including pyrrolic N-B (4.90 eV), graphitic N-B (11.10 eV), graphene (15.88 eV). We further studied the reaction kinetics of the hydrogenation of *CO to CH4 via Langmuir-Hinshelwood [34,38]. The lower energy barrier of pyridinic N-B from *CO to CH4 demonstrates the higher catalytic activity to CO2-to-CH4 conversion. The hydrogenation of *CO to *CH2O is commonly recognized as a crucial step for hydrocarbon products over Cu and other catalysts, determining the reaction rate. According to the free energy diagram, the *CO and *CH2O are also identifies as the two key intermediates in our models and the hydrogenation of *CO to *CH2O is more likely to occur on the pyridinic N-B leading to a high CH4 production rate [39–43]. Based on the above comparison, the pyridinic N-B is regarded as the most efficient active site in CO2RR to CH4.

|
Download:
|
| Fig. 5. (a) The potential models of B, N co-doping graphene and the graphene (the active site remarked with red dotted line). (b) The free-energy profile and optimized configurations of intermediates in CO2 electroreduction to CH4 over pyridinic N-B, pyrrolic N-B, graphitic N-B and graphene. | |
In summary, we prepared a hierarchically porous carbon of graphene nanoribbons/amorphous carbon composed of predominant pyridinic N-B species. The BN-C-1 exhibits excellent CH4 selectivity toward CO2RR. The porous structure and graphene nanoribbons accelerate ion/gas and electron transport in CO2RR, respectively. The pyridinic N-B configuration modulates the electronic property of the neighboring carbon atoms which act as the active sites to conversion CO2 to CH4. Therefore, we developed a new method to modulate the morphology and electronic environment of active site in carbon-based electrocatalyst in CO2RR.
Declaration of competing interestThe authors declare that they have no known competing financial interests or personal relationships that could have appeared to influence the work reported in this paper.
AcknowledgmentsThis work was supported by the Foundation of Jiangsu Key Lab of Biomass Energy and Material (No. JSBEM-S-202101), National Natural Science Foundation of China (No. 51902162), the Foundation Research Project of Jiangsu Province (No. BK20221338), Jiangsu Co-Innovation Center of Efficient Processing and Utilization of Forest Resources, International Innovation Center for Forest Chemicals and Materials, Nanjing Forestry University, merit-based funding for Nanjing innovation and technology projects.
Supplementary materialsSupplementary material associated with this article can be found, in the online version, at doi:10.1016/j.cclet.2022.108120.
| [1] |
D. Gao, I. Sinev, F. Scholten, et al., Angew. Chem. Int. Ed. 58 (2019) 17047-17053. DOI:10.1002/anie.201910155 |
| [2] |
B. He, G. Li, J. Li, et al., Adv. Energy Mater. 11 (2021) 2003263. DOI:10.1002/aenm.202003263 |
| [3] |
T. Zhang, J.C. Bui, Z. Li, et al., Nat. Catal. 5 (2022) 202-211. DOI:10.1038/s41929-022-00751-0 |
| [4] |
Y. Wang, Z. Chen, P. Han, et al., ACS Catal. 8 (2018) 7113-7119. DOI:10.1021/acscatal.8b01014 |
| [5] |
S.B. Varandili, J. Huang, E. Oveisi, et al., ACS Catal. 9 (2019) 5035-5046. DOI:10.1021/acscatal.9b00010 |
| [6] |
L. Ji, L. Li, X. Ji, et al., Angew. Chem. Int. Ed. 59 (2020) 758-762. DOI:10.1002/anie.201912836 |
| [7] |
W. Ju, F. Jiang, H. Ma, et al., Adv. Energy. Mater. 9 (2019) 1901514. DOI:10.1002/aenm.201901514 |
| [8] |
T. Wang, J. Yang, J. Chen, et al., Chin. Chem. Lett. 31 (2020) 1438-1442. DOI:10.1016/j.cclet.2020.04.056 |
| [9] |
M. Fan, J. Cui, J. Wu, et al., Small 16 (2020) e1906782. DOI:10.1002/smll.201906782 |
| [10] |
F. Li, Y.C. Li, Z. Wang, et al., Nat. Catal. 3 (2019) 75-82. DOI:10.1038/s41929-019-0383-7 |
| [11] |
S. Liu, X.F. Lu, J. Xiao, et al., Angew. Chem. Int. Ed. 58 (2019) 13828-13833. DOI:10.1002/anie.201907674 |
| [12] |
C. Hu, L. Dai, Angew. Chem. Int. Ed. 55 (2016) 11736-11758. DOI:10.1002/anie.201509982 |
| [13] |
C. Jia, K. Dastafkan, W. Ren, et al., Sustain. Energy Fuels 3 (2019) 2890-2906. DOI:10.1039/C9SE00527G |
| [14] |
Y. Yao, Z. Jiang, J. Yao, et al., ACS Appl. Mater. Interfaces 12 (2020) 50600-50609. DOI:10.1021/acsami.0c14949 |
| [15] |
Z. Gao, J. Li, Z. Zhang, et al., Chin. Chem. Lett. 33 (2022) 2270-2280. DOI:10.1016/j.cclet.2021.09.037 |
| [16] |
K. Yuan, D. Lutzenkirchen-Hecht, L. Li, et al., J. Am. Chem. Soc. 142 (2020) 2404-2412. DOI:10.1021/jacs.9b11852 |
| [17] |
M. Fan, J. Cui, J. Zhang, et al., J. Mater. Sci. Technol. 91 (2021) 160-167. DOI:10.1016/j.jmst.2021.01.093 |
| [18] |
J. Yu, C. Wang, W. Yuan, et al., Chemistry 25 (2019) 2877-2883. DOI:10.1002/chem.201806201 |
| [19] |
X. Qu, J. Lin, J.P. Chaudhary, et al., Chemosphere 268 (2021) 128782. DOI:10.1016/j.chemosphere.2020.128782 |
| [20] |
Y. Liu, Q. Li, X. Guo, et al., Adv. Mater. 32 (2020) e1907690. DOI:10.1002/adma.201907690 |
| [21] |
G. Wang, M. Liu, J. Jia, et al., ChemCatChem 12 (2020) 2203-2208. DOI:10.1002/cctc.201902326 |
| [22] |
A. Goyal, G. Marcandalli, V.A. Mints, et al., J. Am. Chem. Soc. 142 (2020) 4154-4161. DOI:10.1021/jacs.9b10061 |
| [23] |
Y. Sun, S. Wang, D. Jiao, et al., Chin. Chem. Lett. 33 (2022) 3987-3992. DOI:10.1016/j.cclet.2021.11.034 |
| [24] |
Q. Wang, K. Ye, L. Xu, et al., Chem. Commun. 55 (2019) 14801-14804. DOI:10.1039/C9CC08439H |
| [25] |
W. Liu, J. Qi, P. Bai, et al., Appl. Catal. B 272 (2020) 118974. DOI:10.1016/j.apcatb.2020.118974 |
| [26] |
Y. He, Y. Li, J. Zhang, et al., Nano Energy 77 (2020) 105010. DOI:10.1016/j.nanoen.2020.105010 |
| [27] |
C. Chen, X. Sun, X. Yan, et al., Angew. Chem. Int. Ed. 59 (2020) 11123-11129. DOI:10.1002/anie.202004226 |
| [28] |
M. Fan, Q. Yuan, Y. Zhao, et al., Adv. Mater. 34 (2022) e2107040. DOI:10.1002/adma.202107040 |
| [29] |
Q. Yuan, M. Fan, Y. Zhao, et al., Appl. Catal. B (2022) 122195. DOI:10.1016/j.apcatb.2022.122195 |
| [30] |
M. Fan, Z. Wang, Y. Zhao, et al., Carbon Energy (2022) 4089344. |
| [31] |
L. Lin, T. Liu, J. Xiao, et al., Angew. Chem. Int. Ed. 59 (2020) 22408-22413. DOI:10.1002/anie.202009191 |
| [32] |
W. Ni, Y. Xue, X. Zang, et al., ACS Nano 14 (2020) 2014-2023. DOI:10.1021/acsnano.9b08528 |
| [33] |
J. Wu, C. Wen, X. Zou, et al., ACS Catal. 7 (2017) 4497-4503. DOI:10.1021/acscatal.7b00729 |
| [34] |
M. Schreier, Y. Yoon, M.N. Jackson, et al., Angew. Chem. Int. Ed. 57 (2018) 10221-10225. DOI:10.1002/anie.201806051 |
| [35] |
Q. Feng, G. Tan, Y. Li, et al., Asian J. Chem. 26 (2014) 3241-3242. DOI:10.14233/ajchem.2014.15993 |
| [36] |
Y. Luo, C. Xia, Q. Feng, et al., Int. J. Electrochem. Sc. 12 (2017) 4828-4834. DOI:10.20964/2017.06.67 |
| [37] |
Y. Dai, L. Niu, H. Liu, et al., Int. J. Electrochem. Sci. 13 (2018) 1084-1095. DOI:10.20964/2018.01.85 |
| [38] |
Y. Yi, J. Li, C. Cui, Chin. Chem. Lett. 33 (2022) 1006-1010. DOI:10.1016/j.cclet.2021.07.005 |
| [39] |
M. Wang, M. Shen, X. Jin, et al., ACS Catal. 9 (2019) 4573-4581. DOI:10.1021/acscatal.8b03975 |
| [40] |
J. Yin, Z. Gao, F. Wei, et al., ACS Catal. 12 (2022) 1004-1011. DOI:10.1021/acscatal.1c04714 |
| [41] |
X. Zhou, J. Shan, L. Chen, et al., J. Am. Chem. Soc. 144 (2022) 2079-2084. DOI:10.1021/jacs.1c12212 |
| [42] |
M. Fan, J. Xu, Y. Wang, et al., Chem. Eur. J. 28 (2022) e202201996. DOI:10.1002/chem.202201996 |
| [43] |
C. Chang, S. Lin, H. Chen, et al., J. Am. Chem. Soc. 142 (2020) 12119-12132. DOI:10.1021/jacs.0c01859 |
 2023, Vol. 34

