b College of Pharmaceutical Sciences, Zhejiang University, Hangzhou 310058, China;
c School of Pharmaceutical Sciences (Shenzhen), Sun Yat-sen University, Shenzhen 518107, China
In cancer research, multicellular tumor spheroids (MCTS) have attracted increasing attention as a three-dimensional (3D) cell model to evaluate the efficacy of anticancer drugs [1]. MCTS with diameters greater than 500 µm form three areas, including areas of proliferation, quiescence, and necrosis [2]. Solid tumors show similar structures including the parenchyma area containing proliferative cancer cells and the necrotic area containing dead cancer cells [3]. The expression levels of genes in MCTS are comparable to those in solid tumors [4, 5]. Moreover, it was found that the extracellular matrix-cell interaction observed in MCTS mimic in vivo tumors and has an impact on cellular signaling [6]. However, to the best of our knowledge, there is no integrated study investigating the differences in lipid metabolism and distribution among two-dimensional (2D) cancer cells, MCTS and solid tumors.
Mass spectrometry (MS)-based lipidomics is an efficient technique for large-scale lipid analysis and has been widely used in cancer research [7-9]. For instance, Vidavsky et al. compared the difference of lipid metabolism among 2D and 3D cultures of invasive and precancer MCF10A cells [10]. They found that the ratio of glycerolipids (GLs) to glycerophospholipids (GPs) in the 3D cell model was higher than that in the 2D cell model. Meanwhile, when the malignancy of 3D cell spheroids were moved from low to high, the de novo sphingolipids production increased and the ether-linked lipid fractions decreased. This differential analysis between different cell models is necessary for a better understanding of tumor microenvironments and cancer progression. However, these studies focused on the variations of lipid profiling in in vitro models. The changes of lipid metabolism between in vivo and in vitro models needed to be investigated to identify a more suitable in vitro model (the 2D or 3D cell model).
Matrix-assisted laser desorption/ionization mass spectrometry imaging (MALDI MSI) is a powerful label-free tool that can simultaneously reveal the spatial distribution of hundreds of molecules in various biological samples [11-13]. In cancer research, many studies have used MALDI MSI to observe the distribution of endogenous metabolites (e.g., lipids) in 3D cell spheroids and tumor tissues [14-16]. For example, our previous work developed a new sectioning method of MCTS and investigated the lipid distribution in MCTS [17]. We found that GPs had various spatial distributions with locations of some lipids (e.g., phosphatidylethanolamine (PE)(18:0/20:4)) in proliferative area, some lipids (e.g., phosphatidylinositol (PI)(18:0/18:1)) in the necrotic area, and other lipids (e.g., PE(16:0/18:1)) in the entire region. Recently, the group of Zeper reported that compared with normal tissue, the abundance of some metabolites and proteins in esophageal MCTS were closer to that in esophageal cancer tissues by using MALDI MSI and immunohistochemistry [18]. However, in this study, little information was provided about the differences in the spatial distribution of endogenous compounds between MCTS and tumor tissues. Considering the complex spatial heterogeneity of these two models, the comparison of the spatial distribution of endogenous compounds between them may contribute to the understanding of their characteristics and the tumor microenvironment.
In the present work, we investigated the differences in lipid metabolism and distribution among 2D cells, 3D cell spheroids, and solid tumors. Mass spectrometry-based lipidomics was applied to analyze variations of lipid profiles among the three models. Histological staining in conjunction with MALDI MSI were used to uncover changes in lipid spatial distributions between models of in vitro and in vivo. The experiments are designed to offer novel insights into the associations among lipid profiles, lipid distributions, and tumor microenvironment.
To obtain enough and suitable cell numbers for lipid analysis, we optimized the cell number for lipidomic analysis by comparing the total number of detected lipid ions in different cell numbers in both negative and positive ionization modes (Fig. S1 in Supporting information). The results showed that the number of detected ions increased with the increasing number of cells (from 1 × 10⁶ cells to 8 × 10⁶ cells) and then reached a plateau when the cell number was above 8 × 10⁶. This is because the total lipid content for analysis increases with elevated cell numbers. Under a fixed injection volume, the number of detected ions would increase with the elevated lipid content. However, owing to a stable instrumental detection limit, the number of detected ions will stay the same when obtaining a sufficient lipid content for instrumental analysis. Hence, 8 × 10⁶ cells for one sample were chosen for both 2D and 3D cell models. We further calculated the protein content of 8 × 10⁶ cells using the protein assay of bicinchoninic acid. The obtained value was used to determine the weight of tumor tissues needed for each sample.
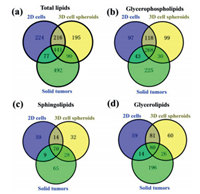
Further MS-based lipidomic analysis allowed the identification of lipid species in 2D cells (n = 958), 3D cell spheroids (n = 942), and solid tumors (n = 1100). These lipid species belonged to four major lipid categories including GLs, sphingolipids (SPs), GPs, and cholesterol ester (chE) (Table S1 in Supporting information). A total of 26, 29 and 37 lipid classes were found in 2D cells, cell spheroids, and solid tumors, respectively (Table S1). The number of shared lipid species among these three models was 441 (Fig. 1a). More specifically, 268, 70, 80 and 14 lipid species shared among three models were found in GPs, SPs, GLs and chE, respectively (Figs. 1b-d and Fig. S2a in Supporting information). A total of 518 lipid species were shared between 2D cells and solid tumors (Fig. 1a). In GPs, SPs, GLs and chE, the numbers of shared lipid species between them were 311, 79, 94 and 23, respectively (Figs. 1b-d and Fig. S2a). A total of 531 lipid species were shared between cell spheroids and solid tumors (Fig. 1a). Between them, 298, 98, 106 and 15 lipid species were shared in GPs, SPs, GLs and chE, respectively (Figs. 1b-d and Fig. S2a).

|
Download:
|
| Fig. 1. Venn diagrams for total lipids (a), glycerophospholipids (b), sphingolipids (c), and glycerolipids (d). Venn diagrams display commonly shared lipid species among 2D cells, 3D cell spheroids, and solid tumors. Each group contains eight replicates. | |
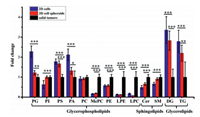
To gain a further understanding of the differences in lipid metabolism among the three models, we performed the partial least-squares discriminant analysis (PLS-DA) (Fig. S3a in Supporting information) and heat map analysis (Fig. S3b in Supporting information) for the shared lipid species in GPs, GLs and SPs. The results of PLS-DA showed clear separations among three models in both negative and positive ionization modes (Fig. S3a), indicating the obvious differences in lipid metabolism among different models. The heat map analysis (Fig. S3b) showed the unsupervised hierarchical clustering of the normalized levels for shared lipid species in three main categories among three cancer models. As shown in Fig. 2 and Fig. S2b (Supporting information), compared to 2D cells, cell spheroids had more close levels of nine lipid classes with solid tumors, including phosphatidylglycerol (PG), PI, phosphatidylserine (PS), phosphatidic acid (PA), ceramide (Cer), sphingomyelin (SM), diglyceride (DG), triglyceride (TG) and chE. However, for lysophosphatidylcholine (LPC), its level in 2D cells was closer to that in solid tumors as compared to those in cell spheroids (Fig. 2).

|
Download:
|
| Fig. 2. Fold changes of different lipid classes in three lipid categories (GPs, SPs, and GLs). Data are means ± SD. *P < 0.05, **P < 0.01, ***P < 0.001. | |
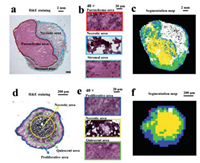
Previous works demonstrated that MCTS have a similar spatial architecture with solid tumors [5]. To confirm this, we performed H&E staining for HepG2 solid tumors and cell spheroids. As shown in Fig. 3a, three areas in solid tumors could be easily identified from their morphological differences. The parenchyma area consists of multinucleated proliferative cancer cells (Fig. 3b, top frame), while the necrotic area contains notable cellular debris (Fig. 3b, middle frame) and the stromal area includes well-organized host cells (Fig. 3b, bottom frame). The automatic recognition of these areas was according to the metabolic characteristics of solid tumors by using the function of segmentation analysis in SCiLS Lab 2016a. The result (Fig. 3c) was in accordance with the H&E staining result (Fig. 3a). As solid tumors, cell spheroids are also composed of different areas (Fig. 3d). The outer proliferative area contains highly proliferative cells (Fig. 3e, top frame), while the core necrotic area is formed of apoptotic cells (Fig. 3e, middle frame) and the middle quiescent area (Fig. 3e, bottom frame) contains senescent cells. The exiting of these three areas can also be identified by the segmentation analysis (Fig. 3f) and H&E staining (Fig. 3d) of a cell spheroid section. The cells with a high proliferation rate in the periphery of cell spheroids are due to their easier access to acquire nutrients and oxgen [13]. However, cells with a necrotic or senescent state within cell spheroids are explained by the lack of nutrients and oxygen [5]. Taken together, similar areas including the proliferative area in cell spheroids corresponding to parenchyma area in solid tumors and necrotic area in both models could be found. These areas were regarded as regions of interests (ROIs).

|
Download:
|
| Fig. 3. Spatial structures of HepG2 solid tumors and cell spheroids. H&E staining images of a tumor section (a) and a cell spheroid section (d). Magnification (× 40) images of each microregion in the tumor section (b) and the cell spheroid section (e). Segmentation maps of the tumor section (c) and the cell spheroid section (f). | |
After confirming the similarity of the internal structure between solid tumors and cell spheroids, we hypothesized that the same lipids between them may have similar spatial distributions. To test this, MSI experiments were performed by using a Rapiflex MALDI-TOF Tissuetyper. MALDI matrices, trans-2-[3-(4-tert-butylphenyl)-2-methyl-2-propenylidene] malononitrile (DCTB) an 2, 5-dihydroxybenzoic acid (DHB), were used in negative and positive ionization modes, respectively. As shown in Fig. S4 (Supporting information), compared with the spectrum of 2D cells (Fig. S4a), a more similar spectra pattern could be found between the spectrum of parenchyma area in solid tumors (Fig. S4b) and the spectrum of proliferative area in cell spheroids (Fig. S4c) in negative ionization mode. Similar results could also be observed among the spectrum of 2D cells (Fig. S4a), the spectra of necrotic areas in solid tumors (Fig. S4d) and cell spheroids (Fig. S4e). Interestingly, compared with 2D cells, solid tumors and cell spheroids had more matching lipid ions with m/z over 900.0. These lipids were further all assigned to PIs (e.g., PI(40:6) and PI(42:9)) at a mass accuracy of less than 10.0 ppm (Table S2 in Supporting information). This result was consistent with the former LC data showing that the levels of PI in cell spheroids and solid tumors were comparable and significantly higher than those in 2D cells (Fig. 2).
Analogous to the results in negative ionization mode, cell spheroids instead of 2D cells had more similar spectral patterns with solid tumors in positive ionization mode. As shown in Figs. S5a-c (Supporting information), solid tumors and cell spheroids have more matching ion peaks at a mass range of m/z 650−700 compared to 2D cells. Most of these peaks were assigned to GPs and SPs (e.g., PC(28:4e) and SM(33:0)) (Table S2). Meanwhile, as indicated in Figs. S5a, S5d, and S5e (Supporting information), compared with 2D cells, more matching ion peaks at m/z 850 to 900 were found in cell spheroids and solid tumors. Most of these ion peaks were assigned to TGs (e.g., TG(52:2) and TG(52:1)) (Table S2).
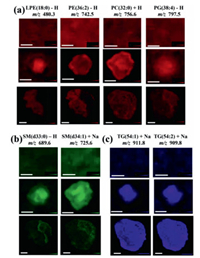
In the results of MALDI MSI, 58, 6 and 7 shared lipids among three cancer models were assigned to GPs, SPs and GLs, respectively (Table S2). Among these lipids, 46 lipids including 34 GPs, 5 SPs and 7 GLs had similar spatial distribution between solid tumors and MCTS. As shown in Fig. 4 and Fig. S6 (Supporting information), lipids in 2D cells had no special distributions. This is because monolayer cancer cells grown on ITO slides have the same opportunities to obtain oxygen and nutrients from cell culture media, which results in nearly the same metabolic levels among cells.

|
Download:
|
| Fig. 4. Representative ion images of (a) glycerophospholipids, (b) sphingolipids and (c) glycerolipids in 2D cells (top row), 3D cell spheroids (middle row) and solid tumors (bottom row). The lengths of error bars in 2D cells, 3D cell spheroids and solid tumors were 300 µm, 500 µm and 2 mm, respectively. | |
In GPs, 24 lipids (e.g., LPC(16:0), PE(36:2), PI(38:4)) distributed in the proliferative area of cell spheroids and the parenchyma area of solid tumors (Fig. 4, Fig. S6a and Table S2 in Supporting information). A total of 13 lipid species (e.g., PC(32:0)) distributed in all ROIs of cell spheroids and solid tumors, while one lipid (PG(38:4)) located in the necrotic area of two models (Fig. 4 and Table S2). In those lipids that had different distributions between the two models, we found that some lipids (e.g., LPE(18:0)) distributed in the core of cell spheroids, but located in the parenchyma area of solid tumors (Fig. 4 and Table S2). Some lipids (e.g., PC(38:9)) located in all ROIs in cell spheroids, but distributed in the parenchyma area of solid tumors (Fig. S6a and Table S2). All these results indicated that distributions of GPs in these two models showed spatial diversity, which is consistent with previous studies [17, 19].
In SPs, two lipids (SM(d33:1) and SM(d33:0)) in negative ionization mode and four lipids (SM(d34:1), SM(d34:0), SM(d42:2), and SM(d42:1)) in positive ionization mode were detected. Interestingly, in cell spheroids, all these lipids mainly localized in necrotic area (Fig. 4 and Fig. S6b). In solid tumors, five lipids distributed in the necrotic area, while one lipid (SM(d42:1) localized in two ROIs (Fig. 4 and Fig. S6b). These results indicated that SM was inclined to localize in the necrotic area in these two models, which may be due to its role as a messenger regulating cell apoptosis and inflammation. Numerous studies reported that the administration of SM in animal models decreased tumor incidence and inhibited tumor growth [20-22]. Lemonnier et al. demonstrated that dietary intake of SM suppressed tumor formations in a 1, 2-dimethylhydrazine-induced mouse cancer model by the normalization of the rate of cell proliferation and apoptosis [23]. Additional study revealed that SM dosing at early stages of chemical-induced tumor models regulated inflammation responses through activating peroxisome proliferator-activated receptor γ [24]. Thus, we speculated that SM accumulation in the necrotic area might result in toxicity to accelerate cell death.
For GLs, all detected lipids tended to locate in the core area of cell spheroids and solid tumors (Fig. 4 and Fig. S6C). These results suggested that TG and DG that play essential roles in energy storage were tended to distribute more in the necrotic areas of tumors and cell spheroids. Our data were quite similar with one previous study showing the aggregation of lipid droplet in the core of breast cancer cell spheroids [10].
In summary, mass spectrometry-based lipidomics and MALDI MSI were utilized to analyze variations of lipid metabolism and spatial distribution among HepG2 2D cells, 3D cell spheroids, and solid tumors. The results demonstrated that 3D cell spheroids, instead of 2D cells, have more similar lipid profiles (e.g., the number of shared lipids, the abundance of various lipid classes, MALDI-TOF mass spectra pattern) and lipid distributions compared to solid tumors. Our work indicates the potential important application of the integrated techniques for the investigation of tumor microenvironment and reveals both spatial and compositional differences of lipids in in vitro and in vivo cancer models.
Declaration of competing interestThe authors declare that they have no known competing financial interests or personal relationships that could have appeared to influence the work reported in this paper.
AcknowledgmentsThis work was supported by National Natural Science Foundation of China (Nos. 22036001, 22106130 and 91843301) and Research Grant Council (Nos. 463612 and 14104314) of Hong Kong.
Supplementary materialsSupplementary material associated with this article can be found, in the online version, at doi:10.1016/j.cclet.2022.03.072.
| [1] |
S. Breslin, L. O'Driscoll, Drug Discov. Today 18 (2013) 240-249. DOI:10.1016/j.drudis.2012.10.003 |
| [2] |
Y. Wang, A.B. Hummon, J. Biol. Chem. 297 (2021) 101139. DOI:10.1016/j.jbc.2021.101139 |
| [3] |
J. Zhang, Q. Du, X. Song, et al., Theranostics 10 (2020) 2621-2630. DOI:10.7150/thno.41763 |
| [4] |
T. Sonoda, H. Kobayashi, T. Kaku, et al., Cancer Lett. 196 (2003) 229-237. DOI:10.1016/S0304-3835(03)00216-7 |
| [5] |
E.C. Costa, A.F. Moreira, D. de Melo-Diogo, et al., Biotechnol. Adv. 34 (2016) 1427-1441. DOI:10.1016/j.biotechadv.2016.11.002 |
| [6] |
S. Nath, G.R. Devi, Pharmacol. Ther. 163 (2016) 94-108. DOI:10.1016/j.pharmthera.2016.03.013 |
| [7] |
L. Xiang, L. Zhu, Y. Huang, Z. Cai, Small Methods 4 (2020) 2000160. DOI:10.1002/smtd.202000160 |
| [8] |
L. Zhang, B. Zhu, Y. Zeng, et al., Cancer Lett. 470 (2020) 75-83. DOI:10.1016/j.canlet.2019.08.014 |
| [9] |
L. Huang, X. Mao, C. Sun, et al., Anal. Chim. Acta 1077 (2019) 183-190. DOI:10.1016/j.aca.2019.05.068 |
| [10] |
N. Vidavsky, J.A. Kunitake, M.E. Diaz-Rubio, et al., ACS Cent. Sci. 5 (2019) 768-780. DOI:10.1021/acscentsci.8b00932 |
| [11] |
J. Wang, S. Qiu, S. Chen, et al., Anal. Chem. 87 (2015) 422-430. DOI:10.1021/ac504294s |
| [12] |
C. Yang, H.K. Lee, Y. Zhang, et al., Anal. Chem. 91 (2019) 8783-8788. DOI:10.1021/acs.analchem.9b00711 |
| [13] |
A.R. Buchberger, N.Q. Vu, J. Johnson, K. DeLaney, L. Li, J. Am. Soc. Mass Spectrom. 31 (2020) 1058-1065. DOI:10.1021/jasms.9b00107 |
| [14] |
B. Bakker, G.B. Eijkel, R.M. Heeren, et al., Anal. Chem. 89 (2017) 9438-9444. DOI:10.1021/acs.analchem.7b02265 |
| [15] |
S.S. Wang, Y.J. Wang, J. Zhang, T.Q. Sun, Y.L. Guo, Anal. Chem. 91 (2019) 4070-4076. DOI:10.1021/acs.analchem.8b05680 |
| [16] |
G.J. LaBonia, K.R. Ludwig, C.B. Mousseau, A.B. Hummon, Anal. Chem. 90 (2018) 1423-1430. DOI:10.1021/acs.analchem.7b04969 |
| [17] |
P. Xie, C. Zhao, X. Liang, et al., Anal. Chem. 92 (2020) 7413-7418. DOI:10.1021/acs.analchem.9b05812 |
| [18] |
Q. Zang, C. Sun, X. Chu, et al., Anal. Chim. Acta 1155 (2021) 338342. DOI:10.1016/j.aca.2021.338342 |
| [19] |
X. Mao, J. He, T. Li, et al., Sci. Rep. 6 (2016) 1-12. DOI:10.1038/s41598-016-0001-8 |
| [20] |
D.L. Dillehay, S.K. Webb, E.M. Schmelz, A.H. Merrill Jr, J. Nutr. 124 (1994) 615-620. DOI:10.1093/jn/124.5.615 |
| [21] |
E.M. Schmelz, D.L. Dillehay, S.K. Webb, et al., Cancer Res. 56 (1996) 4936-4941. |
| [22] |
H. Symolon, E.M. Schmelz, D.L. Dillehay, A.H. Merrill Jr, J. Nutr. 134 (2004) 1157-1161. DOI:10.1093/jn/134.5.1157 |
| [23] |
L.A. Lemonnier, D.L. Dillehay, M.J. Vespremi, et al., Arch. Biochem. Biophys. 419 (2003) 129-138. DOI:10.1016/j.abb.2003.08.023 |
| [24] |
J.C. Mazzei, H. Zhou, B.P. Brayfield, et al., J. Nutr. Biochem. 22 (2011) 1160-1171. DOI:10.1016/j.jnutbio.2010.09.017 |
 2023, Vol. 34

