 2022, Vol. 33


b School of Materials Science and Engineering, Shenyang University of Technology, Shenyang 110870, China
Urea oxidation has received increasing attention in the electrochemical technique for energy conversion and environmental catalysis of urea-waste water treatment. As a rich hydrogen molecule, hydrogen can be generated by urea dissociation, and it can also be directly fed to the fuel cells system to generate electricity [1, 2]. Moreover, urea oxidation is a promising alternative reaction for water oxidation when used for hydrogen generation [3]. As a significant electrochemical reaction to energy conversion and catalysis, many studies have been done to develop efficient catalysts for urea oxidation [4].
The noble metals like Pt and Ru are restricted by the high price and rareness in the large-scale application, and Ni-based catalysts, fortunately, are promising for urea oxidation [5-7]. Among the promising bimetallic catalysts, Ni-Mo-based catalysts have attracted increasing attention due to the efficient synergism of Ni and Mo species during the catalytic process [8, 9].The combination of Mo and Ni can overcome the blockage of Ni surface active sitesand improve the catalytic performance of urea electrooxidation. Ni-Mo-based materials with different morphology like nanoparticles, nanosheets, nanorods, nanotubes, nanoflowers, etc. have been successfully synthesized and used in varied fields [10-12]. For example, honeycomb-like NiMoO4 grown over nickel foam by hydrothermal approach at 180 ℃ for 12 h was reported to have high performance for supercapacitor and methanol oxidation [13]; 3D flower-like Ni-Mo-S microspheres were reported to be active for water splitting reaction [10]. The Ni-Mo-based catalysts are also promising for urea oxidation. Oxygen vacancy-rich NiMoO4 nanosheets grown over the nickel foam resulted in synergetic effect of the active site for urea oxidation [11]; and the hybrid catalysts of nickel-molybdenum oxide nanorods/carbon developed by hydrothermal approach at 150 ℃ for 6 h were found to have high catalytic performance for urea oxidation due to the facile high valence state of Ni species generation [14]. As developing highly efficient catalysts for superior urea oxidation is actively desired, though some efforts have been done, some problems are still met including the low active site exposure and poor conductivity, and troublesome or time-consuming procedure of catalyst fabrication [15].
The microwave-assisted hydrothermal method is effective for nanomaterials fabrication due to some advantages of cleanliness, high efficiency and low energy consumption; moreover, compared with traditional external heating methods, rapid microwave heating can achieve uniform heating and promote crystal nucleus generation and crystallization in a short time [16]. For example, microwave-assisted hydrothermal synthesis of spinel nickel cobaltite was found to have high-specific capacitance [17]; mesoporous NiMoO4 nanorod/reduced graphene oxide composites fabricated by rapid microwave-assisted synthesis approach demonstrated high-performance for supercapacitors due to the large specific surface area and conductivity improvement by rGO [18].
Considering the high performance of NiMoO4 for urea oxidation, herein, we prepared the NiMoO4 nanorods catalyst (NiMoO4-m) by microwave-assisted hydrothermal method following by thermal annealing and they were evaluated for urea oxidation compared to samples obtained by the conventional hydrothermal method (NiMoO4-c). Both monoclinic crystal structure and nanorods morphology were observed for these samples while they have quite different apparent performances for urea oxidation. NiMoO4-m catalysts have much higher catalytic performance for urea oxidation with the current density of ca. 2.4 times higher than that of NiMoO4-c catalyst at 1.54 V. Moreover, NiMoO4-m catalyst exhibited high catalytic kinetics, stability and low charge transfer resistance. The high catalytic performance was attributed to the high surface area and active site exposure of NiMoO4 nanorods formed by microwave irradiation. Note that the hydrothermal synthesis time was reduced from 6 h to 1 h with the assistant of microwave irradiation. Considering the less time required for NiMoO4-m catalyst fabrication, the microwave-assisted hydrothermal synthesis method is more promising for nanostructured electrocatalysts fabrication.
The main difference in the step of NiMoO4-m catalyst and NiMoO4-c fabrication was the involving of microwave irradiation for hydrothermal synthesis with the power of 600 W for 1 h instead of the hydrothermal synthesis of 6 h (details see Supporting information). The crystal structure of NiMoO4-m was characterized by the powder X-ray diffraction (XRD) technique (Fig. 1a). The patterns are in line with the characteristic diffraction peaks of NiMoO4 (JCPDS card No. 13-0128), where the diffraction peaks at 27.3°, 29.8°, 33.4°, 44.9° and 50.4° are corresponding to the (112), (220), (222), (330) and (204) planes. A similar crystal structure is also observed for the NiMoO4-c catalyst (Fig. S1 in Supporting information) prepared by the conventional hydrothermal method [19]. The morphology of the prepared samples was observed by scanning electron microscopy (SEM). Nanorod morphology is observed for both NiMoO4-m and NiMoO4-c samples (Fig. S2 in Supporting information). It seems that the nanorods prepared by the microwave-assisted hydrothermal method are thicker and shorter compared to those obtained by the conventional hydrothermal method [20], which might be due to the fast nuclei formation and crystal growth character induced by microwave heating [21]. The local morphology of NiMoO4-m samples was further observed by transmission electron microscopy (TEM). The nanorods structure is seen in the TEM images with different magnifications and the diameter is about 50 nm (Figs. 1b and c). The lattice fringe is clearly indicated on these nanorods in the high-resolution TEM images and the lattice spacing of 0.27 nm is corresponding to the (112) plane of NiMoO4 (Fig. 1d). Some crystal distortion or defects are found as indicated by the red circle, which might offer increased sites for the reaction. A polycrystalline structure is indicated by selected area electron diffraction (SAED) analysis, which is consistent with the crystal structure reflected by the XRD patterns (Fig. 1e). Elements of Ni, Mo, O and C are found according to the elemental analysis in the energy dispersive X-ray spectrum (EDS) pattern (Fig. 1f), and the content of Ni and Mo is found to be 8 wt% and 15 wt%, respectively. The distribution of these elements as nanorods structure can be seen in the elemental mapping images (Figs. 1g–k).

|
Download:
|
| Fig. 1. (a) XRD patterns of NiMoO4-m. (b, c) TEM images, (d) HR-TEM image, (e) SAED pattern, (f) EDS pattern, and (g–k) STEM and elemental mapping images of NiMoO4-m. | |
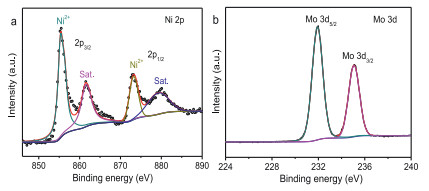
The X-ray photoelectron spectroscopy (XPS) spectrum was done to probe the chemical state of the concerned elements and the whole spectrum was calibrated by the main peak of C 1s at 284.6 eV for sp2 hybridized carbon (Fig. S3a in Supporting information). The high-resolution XPS spectrum of Ni 2p consists of two spin-orbit doublets of 2p1/2 and 2p3/2, and each band can be deconvoluted by the different chemical states (Fig. 2a). The binding energy difference of 17.6 eV between the main peaks of Ni is a sign of Ni2+ oxidation state; specifically, the fitting peaks at 855.6 and 873.2 eV are for the Ni oxide (Ni2+), and those peaks at 861.6 and 879.2 eV are corresponding to satellite peaks [22, 23]. The high-resolution spectrum of Mo 3d spectrum has two obvious peaks with the binding energy of 232.4 eV and 235.5 eV for the Mo 3d5/2 and Mo 3d3/2, respectively (Fig. 2b); the separation binding energy difference of 3.1 eV is observed, which means the chemical valence state of Mo6+ in the system [24]. Meanwhile, a typical metal-oxygen bond at the binding energy of 530.6 eV is observed in the high-resolution XPS spectrum of the O 1 s region (Fig. S3b in Supporting information). Compared to the XPS spectra of Ni and Mo for NiMoO4-c (Fig. S4 in Supporting information), there is no obvious difference indicated probably because of the same crystal structure.These chemical states indicated by the XPS spectra are consistent with the reports elsewhere for the NiMoO4 catalysts [14].

|
Download:
|
| Fig. 2. XPS spectra of (a) Ni 2p and (b) Mo 3d for NiMoO4-m. | |
The urea oxidation catalyzed by NiMoO4-m was firstly evaluated by comparing the cyclic voltammograms (CV) in 1 mol/L KOH solution with and without 0.33 mol/L urea at a scan rate of 10 mV/s (Fig. 3a). A pair of redox couple is observed due to the Ni(OH)2/NiOOH transformation for the electrode measured in the 1 mol/L KOH solution [25], and no other high oxidation current density from the water oxidation reaction is observed indicating the reasonable potential range given for the measurements [26]. A different CV profile is observed for the electrode measured in the electrolyte containing urea; there are no oxidization peaks observed and the current density is rapidly increased after 1.34 V with the potential increasing. The high current density is obviously generated from urea oxidation. Note that though the nickel oxidation peak is not observed, the onset potential for urea oxidation is consistent with the nickel oxidation peak potential, indicating the oxidized state of Ni species is active for urea oxidation [27, 28]. This is consistent with the indirect electrochemical-chemical (EC) mechanism proposed for urea oxidation [29], where Ni species are firstly electrochemically oxidized to a high valence state of Ni3+, which chemically oxidize the urea molecules adsorbed on the electrode surface [28]. The catalytic performance for urea oxidation catalyzed by NiMoO4-mis compared to that of NiMoO4-c catalysts, and a much higher current density for urea oxidation is found over the whole polarization curves (Fig. 3b). To be specific, the current density at 1.54 V is 130.79 mA/cm2 for NiMoO4-m, about 2.4 times higher than that of NiMoO4-c catalyst (54.08 mA/cm2). The high catalytic activity can also be reflected by the low onset potentials, which is 1.325 V for NiMoO4-m catalyst, about 20 mV less than that of NiMoO4-c catalysts. The onset potential is also slightly smaller than that of some NiMoO4 catalysts (Table S1 in Supporting information). NiMoO4-m catalyst also shows an outstanding catalytic ability for urea oxidation compared to other Ni-based catalysts (Table S2 in Supporting information). The higher catalytic performance can also be supported by the faster catalytic kinetics reflected by the Tafel slope [30]. The smaller value of Tafel slope means the less potential required for the same current increase resulting from the faster catalytic kinetics [31]. The NiMoO4-m catalyst has a small Tafel slope of 44 mV/dec while that is 73 mV/dec for NiMoO4-c catalysts (Fig. 3c), indicating a more favorable catalytic kinetics for urea electro-oxidation on NiMoO4-mcatalyst. The catalytic stability for urea oxidation was also compared by chronoamperometry test (Fig. 3d), and high catalytic stability is observed for these electrodes indicating the robustcatalytic performance of NiMoO4 for urea oxidation [32].

|
Download:
|
| Fig. 3. (a) CV curvesof NiMoO4-m in 1 mol/L KOH solution without and with 0.33 mol/L urea at 10 mV/s. (b) CV curvesof NiMoO4-m and NiMoO4-c in 1 mol/L KOH solution with 0.33 mol/L urea at 10 mV/s. (c) The corresponding Tafel slope of catalysts. (d) CA curves of NiMoO4-m and NiMoO4-c in 1 mol/L KOH with 0.33 mol/L urea at 1.39 V. | |
The influence of the scan rates on the electro-catalytic activity for urea electro-oxidation was studied to investigate the electrode kinetics, which can be obtained by the relationship of the peak current density and the scan rates [33]. The current density is increased by increasing the scan rate that is observed for all the catalysts (Fig. S5 in Supporting information). Specifically, by increasing the scan rate from 1 mV/s to 10 mV/s, the maximum current density at 1.54 V is increased from 70.05 to 130.79 mA/cm2 for NiMoO4-m catalyst. A linear relationship is obtained by plotting the given current density vs. square root of the scan rate (Fig. 4a), indicating urea oxidation is controlled by the mass diffusion process on this electrode [5]. The reaction catalytic kinetics can be indicated by the slope of the linear fitting [34], and the higher catalytic kinetics is supported by the large value of NiMoO4-m (27.45) compared to that of the NiMoO4-c (11.29). The charge transfer resistance (Rct) was further evaluated by electrochemical impedance spectroscopy (EIS) at 1.38 V that was controlled by the catalytic kinetics for urea oxidation (Fig. 4b). As seen from the small diameter of the semicircle in the Nyquist plot, a sign of the charge-transfer resistance, NiMoO4-m has a higher charge transfer ability. The Rct value can be obtained by fitting the spectrum with an equivalent circuit (Fig. S6 in Supporting information). In the equivalent circuit, Rct is the charge transfer resistance generated by urea oxidation, Rs is uncompensated solution resistance. The relevant parameters of the fitting results are shown in Table S3 (Supporting information). The value of Rct is 462 Ω for the NiMoO4-m catalyst, remarkably smaller than that of NiMoO4-c catalysts (1205 Ω). Therefore, NiMoO4-m catalyst exhibits much higher catalytic kinetics due to the largely reduced Rct involved in urea oxidation. Moreover, the Rct obtained at other potentials was analyzed to get the Tafel slope value. The Nyquist plots for urea oxidation at different potentials catalyzed by NiMoO4-m and NiMoO4-c were shown in Figs. S7a and b (Supporting information). By increasing the potentials, the catalytic performance is largely increased, and the Rct is correspondingly reduced. The Tafel slope derived from Rct can be obtained by plotting and fitting the log (1/Rct) vs. potentials. The obtained Tafel slope is 58 and 75 mV/dec, respectively for NiMoO4-m and NiMoO4-c catalyst (Fig. S7c in Supporting information), and they are close to the values obtained from the linear fitting of the polarization curve (Fig. 3c). The consistent results strongly support the improved catalytic kinetics of NiMoO4-m catalyst for urea oxidation.

|
Download:
|
| Fig. 4. (a) The relationship between current density (at 1.54 V) and the square root of the scanning rate. (b) Nyquist plots and fitting curves of NiMoO4-m and NiMoO4-c in 0.33 mol/L urea solution at 1.38 V. (c) The relationship between capacitive current density vs. scan rate. (d) CV curves of NiMoO4-m and NiMoO4-c for urea oxidation by normalizing the current to the electrochemically active surface area. | |
The different catalytic abilities for urea oxidation catalyzed by these catalysts are further probed by the catalytic efficiency for the active sites. The high electrochemical surface area means more active sites available for an electrochemical reaction [35, 36]. Here, the electrochemical surface area and the roughness factor were estimated by the double-layer capacitance (Cdl) approach reported elsewhere [37, 38]. The CV curves were recorded with different scan rates in the non-faraday region range (Fig. S8 in Supporting information), and the Cdl can be calculated from the slope of the linear fitting for the charge current vs. the scan rates (Fig. 4c); The calculated Cdl is 2.54 mF/cm2 and 1.16 mF/cm2 for NiMoO4-m and NiMoO4-c, respectively. The electrochemical surface area of these catalysts was further calculated by normalizing the Cdl to a specific capacitance value of 40 µF/cm2 for a flat surface [28, 34], and the value was calculated to be 4.45 and 2.03 cm2 for NiMoO4-m and NiMoO4-c, respectively (Fig. S9 in Supporting information). Correspondingly, the roughness factor is about 63.6 and 29, respectively. Therefore, NiMoO4-m catalysts have much higher surface roughness compared to the NiMoO4-c catalyst. The high surface area means more active sites available for the reaction, and the catalytic efficiency can be evaluated by specific activity, that was obtained by normalizing the current to the electrochemical surface area (Fig. 4d). It can be seen that the specific activity of NiMoO4-m is slightly higher than that of NiMoO4-c, indicating that the largely improved performance of NiMoO4-m is attributed to the increased surface area and roughness induced by the fast microwave-assisted hydrothermal synthesis approach.In other words, NiMoO4 is active for urea oxidation while the high active sites exposure and electrochemical surface area increase is still required.
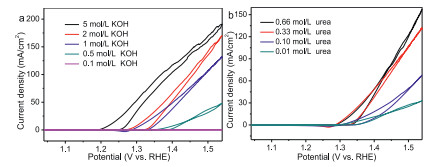
Finally, we probed the effect of the KOH and urea concentration on the catalytic performance catalyzed by the NiMoO4-m electrode. The NiMoO4-m catalyst was measured in the KOH electrolyte for urea oxidation with different concentrations from 0.1 mol/L to 5 mol/L with 0.33 mol/L urea (Fig. 5a). It is noted that the current density at 1.5 V is increased along with the increase of KOH concentration; also, the onset oxidation potential becomes lower, thus, the increase of OH− concentration can enhance the oxidation of Ni2+ to Ni3+. The influence of the urea concentrations in the 1 mol/L KOH was also evaluated for NiMoO4-m electrode towards urea oxidation (Fig. 5b). By increasing the urea concentration from 0.01 mol/L to 0. 33 mol/L, the current density is increased largely from 32 mA/cm2 to 131 mA/cm2, and further increase the concentration to 0.66 mol/L, the current density is increased slightly to 157 mA/cm2. Therefore, the urea oxidation is influenced by the surface adsorbed OH− and the urea molecular. They can be further understood by the above-mentioned E-C mechanism expressed by the equations below; (E: electrochemical step and C: chemical step).

|
(1) |

|
(2) |

|
Download:
|
| Fig. 5. (a) CV curves of NiMoO4-m at different KOH (0.1, 0.5, 1, 2 and 5 mol/L) concentrations in 0.33 mol/L urea. (b) CV curves of NiMoO4-m in 1 mol/L KOH solution containing various urea concentrations (0.01, 0.10, 0.33 and 0.66 mol/L). | |
By increasing the KOH concentration, more OH− are offered for the electrochemical oxidation of Ni species to form active NiOOH that can chemically oxidize the urea adsorbed over the catalyst surface, thus largely increased current density is observed for urea oxidation. In other words, the concentration of 0.33 mol/L, a generally employed concentration, is sufficient for urea oxidation. It can be further verified by the varied urea concentration in the 1 mol/L KOH electrolyte. The low urea concentration of 0.01 and 0.1 mol/L is insufficient for the reaction catalyzed by active NiOOH formed in the electrochemical oxidation step, thus, the urea oxidation current was increased by increasing the urea concentration to 0.33 mol/L; by further increasing the urea concentration to 0.66 mol/L, the surface of the electrode is saturated with urea molecules while limited by the active phase of NiOOH, thereby, the current density further increase is reduced.
In summary, NiMoO4 nanorods prepared microwave-assisted hydrothermal synthesis method was found to have much higher catalytic performance for urea oxidation compared to the traditional hydrothermal approaches resulting from the high active site exposure and large electrochemical surface area. Both monoclinic structure and nanorods morphology were found on the prepared NiMoO4 samples while they have quite different catalytic performances for urea oxidation. Specifically, the current density for urea oxidation was 130.79 mA/cm2 at 1.54 V catalyzed by NiMoO4-m, about 2.4 times higher than that of NiMoO4-c catalysts (54.08 mA/cm2). Furthermore, NiMoO4-m also showed high catalytic kinetics, catalytic stability and lower charge transfer resistance for urea oxidation. As indicated by the E-C catalytic mechanism, the high catalytic performance should result from the high surface area and active site exposure of NiMoO4 nanorods formed by microwave irradiation. Note that the hydrothermal synthesis time was reduced from 6 h to 1 h with the assistant of microwave irradiation. In light of the less time-consuming and easy synthesis condition and efficient components synergism, the microwave-assisted hydrothermal synthesis method is more promising for nanostructured electrocatalysts fabrication.
Declaration of competing interestThe authors declare that they have no known competing financial interests or personal relationships that could have appeared to influence the work reported in this paper.
AcknowledgmentThe work was supported by the National Natural Science Foundation of China (Nos. 21972124, 21603041), a project funded by the Priority Academic Program Development of Jiangsu Higher Education Institution. We also acknowledge the technical support received at the Testing Center of Yangzhou University.
Supplementary materialsSupplementary material associated with this article can be found, in the online version, at doi: 10.1016/j.cclet.2021.08.042.
| [1] |
E.T. Sayed, T. Eisa, H.O. Mohamed, et al., J. Power Sources 417 (2019) 159-175. DOI:10.1016/j.jpowsour.2018.12.024 |
| [2] |
Y. Zhang, C. Wang, Chin. Chem. Lett. 32 (2021) 2222-2228. DOI:10.1016/j.cclet.2020.11.040 |
| [3] |
W. Luo, Y. Wang, C. Cheng, Mater. Today Phys. 15 (2020) 100274. DOI:10.1016/j.mtphys.2020.100274 |
| [4] |
B. Zhu, Z. Liang, R. Zou, Small 16 (2020) 1906133. DOI:10.1002/smll.201906133 |
| [5] |
R.K. Singh, A. Schechter, Electrochim. Acta 278 (2018) 405-411. DOI:10.1016/j.electacta.2018.05.049 |
| [6] |
S. Wang, P. Xu, J. Tian, Z. Liu, L. Feng, Electrochim. Acta 370 (2021) 137755. DOI:10.1016/j.electacta.2021.137755 |
| [7] |
L. Yang, Z. Liu, S. Zhu, L. Feng, W. Xing, Mater. Today Phys. 16 (2021) 100292. DOI:10.1016/j.mtphys.2020.100292 |
| [8] |
M. Yang, Q. Bai, C. Ding, Coll. Surf. A 604 (2020) 125276. DOI:10.1016/j.colsurfa.2020.125276 |
| [9] |
W. Shi, R. Ding, X. Li, Q. Xu, E. Liu, Electrochim. Acta 242 (2017) 247-259. DOI:10.1016/j.electacta.2017.05.002 |
| [10] |
Y. Guan, H. Xuan, H. Li, P. Han, Electrochim. Acta 320 (2019) 134614. DOI:10.1016/j.electacta.2019.134614 |
| [11] |
Y. Tong, P. Chen, M. Zhang, et al., ACS Catal. 8 (2018) 1-7. DOI:10.1021/acscatal.7b03177 |
| [12] |
Q. Shan, W. Huo, M. Shen, Chin. Chem. Lett. 31 (2020) 2245-2248. DOI:10.1016/j.cclet.2020.02.003 |
| [13] |
N. Padmanathan, H. Shao, K.M. Razeeb, Int. J. Hydrog. Energy 45 (2020) 30911-30923. DOI:10.1016/j.ijhydene.2020.08.058 |
| [14] |
D. Yang, L. Yang, L. Zhong, X. Yu, L. Feng, Electrochim. Acta 295 (2019) 524-531. DOI:10.1016/j.electacta.2018.10.190 |
| [15] |
L. Sha, K. Ye, G. Wang, et al., J. Power Sources 412 (2019) 265-271. DOI:10.1016/j.jpowsour.2018.11.059 |
| [16] |
Y.J. Zhu, F. Chen, Chem. Rev. 114 (2014) 6462-6555. DOI:10.1021/cr400366s |
| [17] |
C.C. Tseng, J.L. Lee, Y.M. Liu, M.D. Ger, Y.Y. Shu, J. Taiwan Inst. Chem. Eng. 44 (2013) 415-419. DOI:10.1016/j.jtice.2012.12.014 |
| [18] |
T. Liu, H. Chai, D. Jia, et al., Electrochim. Acta 180 (2015) 998-1006. DOI:10.1016/j.electacta.2015.07.175 |
| [19] |
K. Hu, S. Jeong, G. Elumalai, et al., ACS Appl. Energy Mater. 3 (2020) 7535-7542. DOI:10.1021/acsaem.0c00968 |
| [20] |
S. Chen, M. Zhang, G. Jiang, Z. Zhang, X. Zhou, J. Alloy. Compd. 814 (2020) 152253. DOI:10.1016/j.jallcom.2019.152253 |
| [21] |
C. Miao, X. Yin, G. Xia, et al., Appl. Surf. Sci. 543 (2021) 148811. DOI:10.1016/j.apsusc.2020.148811 |
| [22] |
L. Yang, L. Chen, D. Yang, et al., J. Power Sources 392 (2018) 23-32. DOI:10.1016/j.jpowsour.2018.04.090 |
| [23] |
Y. Bao, L. Feng, Acta Phys. Chim. Sin. 37 (2021) 2008031. |
| [24] |
F. Wu, Q. Liao, F. Cao, L. Li, Y. Zhang, Nano Energy 34 (2017) 8-14. DOI:10.1016/j.nanoen.2017.02.004 |
| [25] |
P. Mirzaei, S. Bastide, A. Dassy, et al., Electrochim. Acta 297 (2019) 715-724. DOI:10.1016/j.electacta.2018.11.205 |
| [26] |
R.K. Singh, A. Schechter, ChemCatChem 9 (2017) 3374-3379. DOI:10.1002/cctc.201700451 |
| [27] |
S. Wang, X. Yang, Z. Liu, D. Yang, L. Feng, Nanoscale 12 (2020) 10827-10833. DOI:10.1039/d0nr01386b |
| [28] |
H. Liu, Z. Liu, L. Feng, Nanoscale 11 (2019) 16017-16025. DOI:10.1039/c9nr05204f |
| [29] |
E. Urbańczyk, A. Maciej, A. Stolarczyk, M. Basiaga, W. Simka, Electrochim. Acta 305 (2019) 256-263. DOI:10.1016/j.electacta.2019.03.045 |
| [30] |
Z. Dai, H. Geng, J. Wang, et al., ACS Nano 11 (2017) 11031-11040. DOI:10.1021/acsnano.7b05050 |
| [31] |
N.T. Suen, S.F. Hung, Q. Quan, Chem. Soc. Rev. 46 (2017) 337-365. DOI:10.1039/C6CS00328A |
| [32] |
B. Fang, Z. Liu, Y. Bao, L. Feng, Chin. Chem. Lett. 31 (2020) 2259-2262. DOI:10.1016/j.cclet.2020.02.045 |
| [33] |
H. Liu, D. Yang, Y. Bao, X. Yu, L. Feng, J. Power Sources 434 (2019) 226754. DOI:10.1016/j.jpowsour.2019.226754 |
| [34] |
X. Gu, D. Yang, Z. Liu, S. Wang, L. Feng, Electrochim. Acta 353 (2020) 136516. DOI:10.1016/j.electacta.2020.136516 |
| [35] |
B. Fang, L. Feng, Acta Phys. Chim. Sin. 36 (2020) 1905023. DOI:10.3866/pku.whxb201905023 |
| [36] |
Y. Bao, M. Zha, P. Sun, G. Hu, L. Feng, J. Energy Chem. 59 (2021) 748-754. DOI:10.1016/j.jechem.2020.12.007 |
| [37] |
M. Li, Y. Gu, Y. Chang, et al., Chem. Eng. J. 425 (2021) 130686. DOI:10.1016/j.cej.2021.130686 |
| [38] |
H. Liu, Z. Liu, F. Wang, L. Feng, Chem. Eng. J. 397 (2020) 125507. DOI:10.1016/j.cej.2020.125507 |