 2022, Vol. 33


To reduce energy consumption and protect the natural environment, photo-catalytic H2 generation from water using solar energy has drawn tremendous attention during the past decades [1-3]. Recently, metal sulfide is widely used as the semiconductor photo-catalysts due to their adjustable band gap energy and suitable for hydrogen production [4, 5]. ZnIn2S4 is regarded as a potential hydrogen-producing photo-catalyst with advantages of large surface area, visible light absorption, long-lasting stability and non-toxicity, etc. [6, 7]. However, the rapid recombination and poor charge transfer ability greatly limit its application in photo-catalysis [8], although many attempts, such as doping and constructing hetero-structure, have been made to improve its performance [9-11].
Metal-organic frameworks (MOFs), assembled from organic ligands and metal ions, have attracted much attention [12-14]. With the merits of high specific surface area, adjustable pore structure and periodic topology, MOFs have been widely studied for applications in gas adsorption and separation, drug release, and recently, as the precursors for the synthesis of multicomponent catalysts [15, 16], etc. However, the application of MOF in photo-catalysis is greatly limited due to its low activity and poor long-term stability [17-19]. Recently, the direct pyrolysis of MOF was developed to produce highly dispersed metal oxides nano-materials on reactant substrates, which can act as the active sites to take part in a catalytic reaction. For example, the Ni-based MOF-derived CdS-NiO hetero-structures exhibited enhanced photo-catalytic hydrogen evolution activity in pure water [20]. The Ni-based MOF-derived NiO hollow spheres demonstrated a better super capacitor performance and high oxygen release efficiency with greater long-term stability [21].
The complete decomposition of the MOF usually results in a dramatic reduction in the surface area in association with the destruction of well-defined pore/channel structures and the agglomeration of metal oxide species. This will significantly reduce the density of the surface reaction center, which greatly limits the catalytic activity. Therefore, maintaining the density of active sites while achieving good conductivity remains a challenge. Recently, "controlled partial pyrolysis" through carefully managed thermal conditions was used to construct specific MOF derivatives. It not only retained the skeleton structures of the MOF for efficient mass transportation but also offered highly reactive nanoparticles as the co-catalyst [22, 23].
In addition, using MOFs as a template to prepare semiconductor-MOF nano composites by rationally designing was believed to be a potential strategy to enhance the photo-catalytic performance of the semiconductors. The contact between the two components with different dimensions can be divided into the following three situations: (1) Point contact (0D-0D, 0D-1D, 0D-2D); (2) Line contact (1D-1D, 1D-2D); (3) Surface contact (2D-2D) [24-26]. The surface contact (2D-2D) structure offers a larger interface area, which is essential for establishing a stronger interface electric field. Such interface is also important for the adsorption and reaction involving electrons and holes at the surface. Both can positively contribute to photo-catalytic efficiency.
In this work, a high-performance heterogeneous catalyst of hetero-structured ZNM is designed and prepared by partial pyrolysis of Ni-MOF combined with low-temperature solvo thermal synthesis. Compared with the corresponding single- and two-component samples, the ternary ZNM composites exhibit enhanced photo-catalytic activity in the hydrogen production under the visible-light irradiation, which is attributed to the synergistic effect of the co-catalyst and unique hetero-structure with improved charge separation and transfer.
The overall procedure for the synthesis of hetero-structured ZNM photo-catalyst by low-temperature solvo-thermal and partial pyrolysis method is shown in Scheme S1. At first, 2D Ni-MOF nano sheets ([Ni3(OH)2(1, 4-BDC)2(H2O)4]˖2H2O, where 1, 4-BDC is 1, 4-benzenedicarboxylic acid) were synthesized by solvo-thermal method as described in a previous report [27]. After that, the above products were further heat-treated at 400 ℃ in argon atmosphere for 30 min, and the 2D Ni-MOF nano sheets were partially pyrolyzed to form 2D NiO@MOF nano sheets. A series of ZnIn2S4 modified NiO@MOF composites with various Ni content from sample 1 to 4, named ZnIn2S4-NiO@MOF-x (ZNM-x, x = 1, 2, 3, 4, respectively) were obtained via a facile hydrothermal method. The percentage contents of Ni in the ZNM composites were confirmed via inductively coupled plasma optical emission spectrometry (ICP-OES), as shown in Table S1 (Supporting information). The detailed preparation and characterization can be found in supporting information.
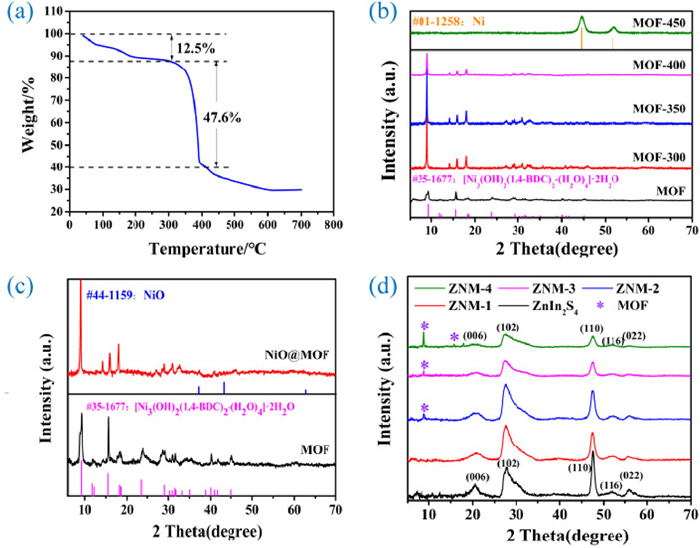
The Thermo Gravimetric (TG) curve of Ni-MOF in the air is shown in Fig. 1a. A weight loss of 12.5% around 100 ℃ can be attributed to the evaporation of residual solvent molecules or physisorbed moisture. A significant weight loss of 47.6% between 200 ℃ and 390 ℃ is due to the decomposition of the Ni-MOF. Based on this, the temperature used for the synthesis of ZNM composite samples was chosen to be 400 ℃.

|
Download:
|
| Fig. 1. (a) The TG curve of Ni-MOF. (b) XRD patterns of Ni-MOF nano sheets treated at different temperature. (c) The untreated Ni-MOF and the sample heat-treated at 400 ℃ for 30 min. (d) ZNM composites with various Ni contents. | |
The crystal structure and phase composition of the as-prepared samples were investigated by XRD. From Fig. 1b, the Ni-MOF nano sheets without heat treatment showed typical characteristic diffraction peaks of nickel terephthalate (JCPDS card No. 35-1677) [28, 29]. Upon increasing the heat-treated temperature from 300 ℃ to 400 ℃, the peak intensity of the Ni-MOF nano sheets start decreasing in line with a structural collapse of the MOF structure. Meanwhile, calcination causes the agglomeration of metal nodes and oxygen atom to form NiO. When the temperature reached 450 ℃, the peaks corresponding to the Ni-MOF nano sheets disappeared completely and were replaced by the peaks corresponding to element Ni. It is inferred that the MOF structure collapse and decompose violently, produces a large number of reducing gases such as CO to reduce NiO to Ni at 450 ℃. The XRD patterns of the Ni-MOF before and after heated at 400 ℃ for 30 min were compared in Fig. 1c. For the latter, except for the peaks belong to Ni-MOF, several new peaks appear at about 37.3°, 43.3° and 62.9° which could be indexed to (111), (200) and (220) planes of the cubic NiO (JCPDS card No. 44-1159) [30]. However, from the peak intensity, only less than 10% of the Ni-MOF was converted into NiO.
The XRD patterns of ZnIn2S4 modified NiO@MOF (ZNM) composites are shown in Fig. 1d. The pure ZnIn2S4 exhibits the hexagonal phase with the typical peaks at 21.1°, 27.7 °, 47.5°, 52.4° and 56.4°, corresponding to the (006), (102), (110), (116) and (022) crystal face (JCPDS No. 65-2023) [31, 32]. For the ZNM composites, the XRD spectra show the characteristic peaks of both Ni-MOF and ZnIn2S4 simultaneously. The peak strength of the Ni-MOF increases with the increase of Ni-MOF amount in the composites. The above results inferred that the hetero-structured ZNM photo-catalyst was successfully prepared. From the ICP-OES results, the highest Ni content in the ZNM composites is less than 10 mol%, and only a small part of them was converted into NiO nanoparticles. Thus, no peak attributed to NiO was observed in the XRD patterns of the ZNM composites.
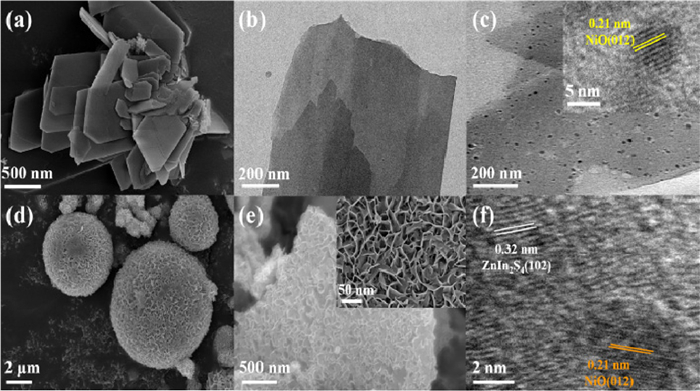
The SEM and TEM images are shown in Fig. 2 and Fig. S1 (Supporting information). Figs. 2a and b depict the nano sheet morphology of the Ni-MOF with 50 nm in thickness and micrometers in lateral dimensions. As shown in Fig. 2c, a large amount of black dots appear on the surface of partially pyrolyzed MOF nano sheets. The fringe spacing of 0.21 nm is assigned to the (012) plane of NiO (inset of Fig. 2c). This confirms the partial decomposition of MOF nano sheets during the heat-treat process, forming the NiO nanoparticles. The SEM image in Fig. 2d indicates that the ZnIn2S4 has a micro spherical morphology with many cross-linked nano sheets. From Fig. 2e and Fig. S1, ZNM nano sheets were successfully prepared by attaching ZnIn2S4 nano sheets to MOF nano sheets in the low temperature (80 ℃) hydrothermal process. The high-resolution TEM in Fig. 2f shows the fringe spacings of 0.21 and 0.32 nm, which are assigned to the (012) crystal plane of NiO and the (102) crystal plane of ZnIn2S4 [33, 34]. The results also prove that the ZnIn2S4 was successfully coupled onto the MOF surface during the low-temperature hydrothermal process.

|
Download:
|
| Fig. 2. (a) SEM image of Ni-MOF nano sheets. (b) TEM image of Ni-MOF nano sheets. (c) TEM image and HRTEM image of partial pyrolysis MOF nano sheets. (d) SEM image of ZnIn2S4. (e) SEM image and (f) HRTEM image of ZNM-2 composite. | |
As shown in Fig. S1, the average thicknesses of NiO@MOF nano sheets and ZnIn2S4 nano sheets are about 50 and 10 nm, respectively. The total thickness of ZnIn2S4-NiO@MOF (ZNM) decreases with the increase of MOF content in the composites. The ZNM-1 exhibits the largest thickness of about 100 nm with a denser structure with respect to the other samples. Meanwhile, the ZNM-4 exhibits the smallest averaged thickness of about 70 nm. So, it is speculated that when the content of ZnIn2S4 is relatively low, it can be uniformly dispersed on the surface of NiO@MOF nano sheets. However, with the increase of its relative content, the aggregation of ZnIn2S4 occurred on the MOF surface, which could result in the blocking of the charge transfer channel, affecting the current density and photo-catalytic activity. The element mapping analysis of ZNM-2 nano sheets in Fig. S2 (Supporting information) shows that the distributions of Ni, O, Zn, In and S elements match the composite ZNM nano sheets structure.
To explore the surface composition and chemical states of each element in the ZNM samples, XPS measurements were performed and corresponding results are shown in Figs. S3 and S4 (Supporting information). The binding energies were calibrated with the binding energy of C at 284.8 eV. The survey XPS spectra of ZNM (Fig. S3) shows that the main components of the sample are Ni, O, S, Zn, C and In. The corresponding core-level spectra of each element are shown in Figs. S4a-f. The XPS spectra in Fig. S4a show a comparison of S 2p signals between ZnIn2S4 and ZNM. The peaks at 161.6 and 162.7 eV in the ZnIn2S4 were positively shifted to the 161.7 and 162.9 eV in the ZNM. Besides, as shown in Fig. S4b, the two peaks of Zn 2p3/2 and Zn 2p1/2 at 1020.5 and 1043.5 eV in the ZnIn2S4 were positively shifted to the 1021.9 and 1044.9 eV in the ZNM. Similar peak shifts were also observed for In 3d, as shown in Fig. S4c. Such a systematically binding energy shift is the result of charge transfer between ZnIn2S4 and NiO@MOF at the interfaces [32].
As for the Ni 2p spectra (Fig. S4d), the two peaks at about 855.8 and 873.5 V, assigned to the Ni2+ ions in the NiO@MOF [35], can be attributed to the Ni 2p3/2 and Ni 2p1/2 spin-orbits, respectively. Additionally, two spin-orbit splitting peaks at 861.7 and 879.9 eV are the satellite peaks of Ni 2p3/2 and Ni 2p1/2, respectively. The XPS result suggests the formation of NiO in the composites. The core-level spectra of O 1s in the NiO@MOF and ZNM are shown in Fig. S4e. The binding energy of about 529.2 eV is attributed to the lattice oxygen in NiO [36]. In the C 1s spectra (Fig. S4f), the binding energies at 284.7 and 288.4 eV are attributed to the C-C and O-C=O bonds in the terephthalate. The above results suggest the coexistence of ZnIn2S4, NiO and Ni-MOF in the ZNM composites.
The BET specific surface areas and pore structure of the synthesized samples were determined by N2 adsorption-desorption isotherms (Figs. S5a and S6 in Supporting information). The pure ZnIn2S4 and ZNM-2 clearly show an obvious hysteresis loop (H3 type), which belong to the typical Ⅳ isotherms. These isotherms suggest that the synthesized samples are mesoporous [37]. The closed loops are attributed to the fact that the ZnIn2S4 nano sheets were loosely aggregated on the surface of NiO@MOF, resulting in the formation of fracture-like mesoporous in the hierarchical heterogeneous structures of ZNM. The BET specific surface area results are summarized in Table S2 (Supporting information). Among the samples, the ZNM-2 shows the largest BET surface area of 157.1 m2/g, which is about 7.58 times of ZnIn2S4 (20.7 m2/g) and 4.30 times of MOF (36.5 m2/g), respectively. Besides, all the samples exhibit a pore size of 3.8 ~ 4.0 nm (Fig. S6), indicating the existence of mesopores in their structure. Meanwhile, there is much more quantity of mesopores in the ZNM-2 with a pore volume of 0.4668 cm3/g, which is about 6.02 times of ZnIn2S4 (0.0775 cm3/g) and 4.98 times of MOF (0.0936 cm3/g). In general, the larger specific surface area with more mesopores facilitates a better diffusion of electrolyte ions within the pores to reach the reactive sites, resulting in higher photoelectric conversion performance. As a result, it is expected that the ZNM-2 will exhibit superior photo-catalytic activity.
UV-vis spectroscopy was used to investigate the optical properties of the photo-catalysts. Fig. S5b (Supporting information) shows that the ZnIn2S4 nano sheets have a strong light absorption ability in the wavelength range of 380–500 nm, while the MOF nano sheets have a stronger light absorption ability between 380 nm and 800 nm. With the increasing of NiO@MOF content, the light absorption edge of ZNM shifted towards a longer wavelength with respect to the ZnIn2S4, indicating that more visible sunlight can be absorbed. Using the Tauc plots, the optical band gaps of the ZnIn2S4 and the 2D NiO@MOF were determined to be 2.42 and 2.07 eV, respectively, while the bandgaps of the hetero-structured ZnIn2S4 -NiO@MOF samples from ZNM-1 to ZNM-4 were 2.38, 2.36, 2.34 and 2.31 eV, respectively (Fig. S7 and Table S2 in Supporting information).
The photo-catalytic hydrogen evolution from water splitting, under then visible light irradiation (λ ≥ 420 nm), with triethanolamine (TEOA) as the hole scavenge, is used to evaluate photo-catalytic activity. As shown in Figs. 3a and b, the ZnIn2S4 shows a visible photo-catalytic activity with the photo-catalytic hydrogen production rate of 278.6 µmol h−1 g−1, while the 2D NiO@MOF nano sheets and pure Ni-MOF nano sheets are photo-catalytically inactive, which could be the result of rapid recombination of photo excited electron-hole pairs. However, the ZNM composites show substantially improved photo-catalytic activity. With different contents of the NiO@MOF, the ZNM-2 nano sheets exhibited the highest optimal H2 production rate of 4970.9 µmol g−1 h−1, which is approximately 17.8 times higher than that of the pure ZnIn2S4. In contrast, the photo-catalytic activity of ZnIn2S4-MOF-2, synthesized without pyrolysis to form NiO, is much lower than that of the partially pyrolyzed ZNM-2 sample. The wavelength-dependent measurements in Fig. 3c show the decreases of quantum efficiency with the increase of the incident wavelength. With wavelength changed from 405 nm, 420 nm to 520 nm, the quantum yield decreased to 5.91%, 3.85% to 0.35%, respectively (Table S3 in Supporting information). This trend is similar to that of the corresponding UV-vis absorption spectrum. From Fig. 3d, the ZNM-2 sample shows a slightly decrease in photo-catalytic performance of the successive four cycles. The possible reason were analyzed according to the SEM and XRD of the catalyst after the reaction (Fig. S8 in Supporting information).

|
Download:
|
| Fig. 3. (a) Photo-catalytic H2 production rate in 3 h. (b) Average H2 production rate of different samples. (c) Wavelength dependence of quantum hydrogen evolution efficiency. (d) Stability test of hydrogen production cycle of ZNM-2 composite. | |
Fig. 4a shows the transient photocurrent responses of the as-prepared photo-catalysts. The initial anodic photocurrent spike was caused by the separation of the electron-hole pairs. After achieving the spike, the photocurrent continuously decreased until a steady-state photocurrent was reached. The decay of photocurrent indicated the existence of charge recombination processes. The order of photocurrent response is ZNM-2 > ZNM-1 > ZNM-3 > ZNM-4 > ZnIn2S4 > NiO@MOF, which matches well with their performance in photo-catalytic hydrogen production. The higher photocurrent density of ZNM-2 suggests more efficient charge separation with less charge recombination at its interface.

|
Download:
|
| Fig. 4. (a) Transient photocurrent of NiO@MOF, ZnIn2S4 and ZNM composites. (b) Steady-state PL spectra, (c) TRPL spectra, (d) EIS spectra of ZnIn2S4 and ZNM-2 composite. (e) Proposed photo-catalytic mechanism of the ZNM composite. | |
The steady-state photoluminescence (PL) measurements were performed to investigate the charge separation and charge transfer efficiency of photo generated electrons-holes pair from the ZNM samples. As shown in Fig. 4b, the PL intensities of the ZNM composites were significantly lower than that of the ZnIn2S4, while the ZNM-2 exhibited the lowest PL intensity among all the ZNM samples. In general, the lower PL intensity means better charge transfer with good charge separation efficiency, resulting in lower charge recombination. Hence, it is expected that the ZNM-2 sample offers the best photo-catalytic performance.
Meanwhile, the time-resolved PL (TRPL) spectra showed that the average PL life of ZNM-2 composites was longer than that of the ZnIn2S4 (i.e., 4.64 ns vs. 2.44 ns, Fig. 4c), which is beneficial for more carriers to participate in the redox reaction. Moreover, the electrochemical impedance spectra (EIS) of the ZNM-2 composites showed a smaller high-frequency semicircle than that of the ZnIn2S4 in the Nyquist diagram (Fig. 4d), suggesting a reduced charge transport resistance. Besides, ZNM-2 shows relatively lower H2 evolution over potential than that of ZnIn2S4 (Fig. S9 in Supporting information). As a result, the synergistic effects of the fast charge separation, long charge carrier lifetime and small transfer resistance eventually lead to the high photo-catalytic activity.
To further understand the photo-catalytic mechanism of the ZNM composite, the band structures of the NiO@MOF and ZnIn2S4 were established by the Mott-Schottky (MS) plots (Fig. S10 in Supporting information). The results show that the conduction band (CB) potentials (vs. normal hydrogen electrode, NHE) of NiO@MOF and ZnIn2S4 were about -0.58 and -0.83 eV, combining with the band gap values obtained from the UV-vis absorption spectra, the valence bands (VB) of the NiO@MOF and ZnIn2S4 were estimated to be +1.49 and +1.59 eV. Since NiO nanoparticles were in situ grown on the surface of MOF nano sheets, it is difficult to obtain the band gap value of those NiO nanoparticles experimentally. However, the reported band gap value of the NiO was about 3.43 eV with the CB and VB position at about -2.59 eV and +0.84 eV [38, 39], respectively.
The mechanism of photo catalytic hydrogen evolution from the ZNM composites was proposed and illustrated in Fig. 4e. Based on its band structure, the CB position of NiO is much more negative than that of the ZnIn2S4, the photo generated electrons on the CB of the NiO can easily transfer to the CB of the ZnIn2S4 to participate in the photo reduction reaction of water. As a result, the charge separation efficiency was significantly improved in the ZNM composites, leading to good photo catalytic activity.
In summary, a high performance hierarchical ZnIn2S4-NiO@MOF hetero-structured photo-catalyst is synthesized by in situ growth of the ZnIn2S4 nano sheets on the 2D NiO@MOF nano sheets. The results indicate that the uniformly distributed NiO nano particles, produced by controlled partial pyrolysis of Ni-MOF, act as the co-catalyst with an intermediary role between the residual MOF and the ZnIn2S4 nano sheets. The synthesized ZnIn2S4-NiO@MOF nano sheets with ultrathin subunits possess a large surface area and abundant active sites. Moreover, the synergistic effect of the co-catalyst and hetero-structured interfaces accelerate the carrier separation and charge transfer, resulting in a greatly improving the photo-catalytic activity. In addition, the ZnIn2S4-NiO@MOF has good stability. This study is expected to open up a new way for the design and construction of efficient hydrogen evolution photo-catalysts based on the hetero-structured MOF materials.
Declaration of competing interestAll the authors declare that they have no known competing financial interests or personal relationships that could inappropriately influence this work.
AcknowledgementThe authors thank the support of National Science Foundation of China (Nos. 91963207 and 12075174).
Supplementary materialsSupplementary material associated with this article can be found, in the online version, at doi:10.1016/j.cclet.2021.08.048.
| [1] |
J.D. Hu, D.Y. Chen, M. Zhao, et al., Angew. Chem. Int. Ed. 58 (2019) 2073-2077. DOI:10.1002/anie.201813417 |
| [2] |
Q.J. Xiang, J.G. Yu, M. Jaroniec, Chem. Soc. Rev. 41 (2012) 782-796. DOI:10.1039/C1CS15172J |
| [3] |
L. Shang, C. Zhou, T. Bian, et al., J. Mater. Chem. A 1 (2013) 4552-4558. DOI:10.1039/c3ta01685d |
| [4] |
Y. Xia, Q. Li, K. Lv, et al., Appl. Catal. B: Environ. 206 (2017) 344-352. DOI:10.1016/j.apcatb.2017.01.060 |
| [5] |
J. Chen, J. Zhan, Y. Zhang, et al., Chin. Chem. Lett. 30 (2019) 735-738. DOI:10.3390/met9070735 |
| [6] |
S. Wang, B.Y. Guan, X. Wang, et al., J. Am. Chem. Soc. 140 (2018) 15145-15148. DOI:10.1021/jacs.8b07721 |
| [7] |
L. Shang, B. Tong, H.J. Yu, et al., Adv. Energy Mater. 6 (2016) 1501241. DOI:10.1002/aenm.201501241 |
| [8] |
S. Wang, Y. Wang, S.L. Zhang, et al., Adv. Mater. 31 (2019) 1903404. DOI:10.1002/adma.201903404 |
| [9] |
B. Lin, H. Li, H. An, et al., Appl. Catal. B: Environ. 220 (2018) 542-552. DOI:10.1016/j.apcatb.2017.08.071 |
| [10] |
D. Zeng, L. Xiao, W.J. Ong, et al., ChemSusChem 10 (2017) 4624-4631. DOI:10.1002/cssc.201701345 |
| [11] |
W. Li, Z. Lin, G. Yang, Nanoscale 9 (2017) 18290-18298. DOI:10.1039/C7NR06755K |
| [12] |
V. Guillerm, D. Kim, J.F. Eubank, et al., Chem. Soc. Rev. 43 (2014) 6141-6172. DOI:10.1039/C4CS00135D |
| [13] |
M. Eddaoudi, J. Kim, N. Rosi, et al., Science 295 (2002) 469-472. DOI:10.1126/science.1067208 |
| [14] |
S. Subudhi, L. Paramanik, S. Sultana, et al., J. Colloid. Interface Sci. 568 (2020) 89-105. DOI:10.1016/j.jcis.2020.02.043 |
| [15] |
W. Cai, C.C. Chu, G. Liu, et al., Small 11 (2015) 4806-4822. DOI:10.1002/smll.201500802 |
| [16] |
D. Farrusseng, S. Aguado, C. Pinel, Angew. Chem. Int. Ed. 48 (2009) 7502-7513. DOI:10.1002/anie.200806063 |
| [17] |
D.K. Wang, H. Zhen, X. Xiong, et al., Sci. Bull. 65 (2020) 113-122. DOI:10.1016/j.scib.2019.10.015 |
| [18] |
P. Wu, M. Jiang, Y. Li, et al., J. Mater. Chem. A 5 (2017) 7833-7838. DOI:10.1039/C7TA01070B |
| [19] |
P. Thiel, M. Kaiser, C. Ottmann, Angew. Chem. Int. Ed. 51 (2012) 2012-2018. DOI:10.1002/anie.201107616 |
| [20] |
Y.Z. Lin, K. Wang, Y. Zhang, et al., J. Mater. Chem. C 8 (2020) 10071-10077. DOI:10.1039/c9tc07042g |
| [21] |
B.P. Reddy, K. Mallikarjuna, K. Kumar, Ceram. Inter. 47 (2021) 3312-3321. DOI:10.1016/j.ceramint.2020.09.172 |
| [22] |
X. L.Wang, H. Xiao, A. Li, et al., J. Am. Chem. Soc. 140 (2018) 15336-15341. DOI:10.1021/jacs.8b08744 |
| [23] |
S. Subudhi, S.P. Tripathy, K. Parida, Inorg. Chem. Front. 8 (2021) 1619-1636. DOI:10.1039/d0qi01117g |
| [24] |
J.X. Low, S.W. Cao, J.G. Yu, et al., Chem. Commun. 50 (2014) 10768-10777. DOI:10.1039/C4CC02553A |
| [25] |
T.M. Su, Q. Shao, Z. Qin, et al., ACS Catal. 8 (2018) 2253-2276. DOI:10.1021/acscatal.7b03437 |
| [26] |
M.Q. Yang, J. Dan, S.J. Pennycook, et al., Mater. Horiz. 4 (2017) 885-894. DOI:10.1039/C7MH00314E |
| [27] |
S. Zheng, B. Li, Y. Tang, et al., Nanoscale 10 (2018) 13270-13276. |
| [28] |
L. Liu, Y. Hai, Y. Gong, et al., Eur. J. Inorg. Chem. 44 (2020) 4215-4224. DOI:10.1002/ejic.202000729 |
| [29] |
S. Shin, S.W. Shin, Appl. Surf. Sci. 540 (2021) 148295. DOI:10.1016/j.apsusc.2020.148295 |
| [30] |
N. Li, Y. Li, Q. Li, et al., J. Colloid. Interface Sci. 581 (2021) 709-718. DOI:10.1016/j.jcis.2020.07.134 |
| [31] |
H. Liu, J. Zhang, D. Ao, Appl. Catal. B: Environ. 221 (2018) 433-442. DOI:10.1016/j.apcatb.2017.09.043 |
| [32] |
G.P. Zhang, D.Y. Chen, N.J. Li, et al., Appl. Catal. B: Environ. 232 (2018) 164-174. |
| [33] |
M. Wang, N. Zhang, Y. Feng, et al., Angew. Chem. Int. Ed. 59 (2020) 14373-14377. DOI:10.1002/anie.202006422 |
| [34] |
J.W. Fu, Q.L. Xu, J.X. Low, et al., Appl. Catal. B: Environ. 243 (2019) 556-565. DOI:10.1016/j.apcatb.2018.11.011 |
| [35] |
Q.L. Chen, S.J. Lei, P.Q. Deng, et al., J. Mater. Chem. A 5 (2017) 19323-19332. DOI:10.1039/C7TA05373H |
| [36] |
Y. Shu, Y. Yan, J.Y. Che, et al., ACS Appl. Mater. Interfaces 9 (2017) 22342-22349. DOI:10.1021/acsami.7b07501 |
| [37] |
G.Y. Yu, F.X. Hu, W.W. Cheng, et al., Acta Phys. Chim. Sin. 36 (2020) 1911016. |
| [38] |
P.F. Li, M. Zhang, X.W. Li, et al., J. Mater. Sci. 55 (2020) 15930-15944. DOI:10.1007/s10853-020-05123-2 |
| [39] |
H.R. Park, A.U. Pawar, U. Pala, et al., Nano Energy 79 (2021) 105483. |