 2022, Vol. 33


b Key Laboratory of Advanced Energy Materials Chemistry (Ministry of Education), College of Chemistry, Nankai University, Tianjin 300071, China
Rechargeable lithium-ion batteries (LIBs) have been widely used in electric vehicles, portable electronics, and stationary energy storage due to their outstanding advantages such as long lifespan, high energy density and environmental friendliness [1-8]. Generally, graphite has been used for the anodes in commercial LIBs because of its structural stability during the cycling process [9]. However, the theoretical specific capacity of graphite is only 372 mAh/g, making it difficult for graphite anodes to meet the increasing demands for energy storage in various electronic devices [10]. Therefore, the development of LIB anodes with a high specific capacity, and excellent cycling stability is urgently necessary [11-13].
Transition metal oxides have been regarded as promising anode materials due to their relatively low environmental impact, low cost, enhanced safety and high theoretical capacity. In particular, Fe2O3 displays many advantages for use in LIB anodes including a high theoretical capacity (1060 mAh/g), low cost, and abundant reserves. However, its low conductivity, volume change, and severe pulverization lead to the loss of battery performance during long-term cycling process [14]. Recently, it was found that the electrochemical performance of the Fe2O3 anode can be greatly improved when it is coated with a carbon material to form the core-shell structure. For example, Zheng et al. prepared a core-shell Fe2O3@carbon material via sol-gel coating followed by the carbonization process that demonstrated excellent LIB performance (1142 mAh/g at 0.2 A/g after 100 cycles) [15]. Gao et al. wrapped Fe2O3 with carbon to effectively alleviate the volume changes during long-term electrochemical reactions. When used as the anode in LIBs, the wrapped Fe2O3 exhibited a stable capacity of 711.2 mAh/g at a current density of 0.5 A/g for 400 cycles [16]. While these strategies facilitate electron transport and alleviate the volume expansion of Fe2O3, the obtained Fe2O3-based anodes still exhibited capacity fading during long-term cycling. Moreover, the excessive internal space between the carbon and Fe2O3 greatly decreased the packing density of active materials, giving rise to a low volumetric energy density of the anode [17]. Thus, it is important to fabricate a core-shell Fe2O3@carbon material with an appropriate cavity size and suitable thickness of the carbon layer. Recently, metal-organic frameworks (MOFs) have been considered to be good precursors for the fabrication of the structure-tailored N-doped carbon (N-C) materials [18]. In particular, due to its facile synthesis, low cost and tunable size, ZIF-8 has been used as a precursor to prepare a wide range of N-C materials [19, 20].
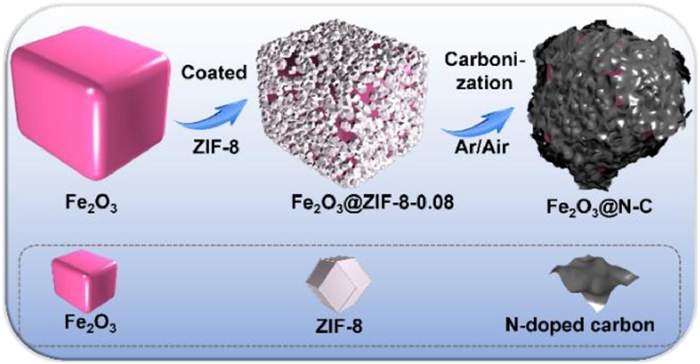
Herein, we developed a facile method for the preparation of the core-shell Fe2O3@N-C anode. First, we fabricate ZIF-8 on the surface of cube-like Fe2O3. Then, the precursor was carbonized first at 700 ℃ for 2 h under Ar atmosphere and then at 350 ℃ for 2 h under air. Benefitting from a moderate-size cavity between the N-C layer and Fe2O3, the core-shell Fe2O3@N-C showed long-term cycle life (803.6 mAh/g at 1.0 A/g after 1100 cycles).
The fabrication of the Fe2O3@N-C is illustrated in Scheme 1. Briefly, cube-like Fe2O3 particles were first prepared according to the method described in a previous report [21]. Then, the Fe2O3nanocubes were directly coated with ZIF-8 using an in-situ growth method, and the obtained product was named Fe2O3@ZIF-8-0.08. At last, Fe2O3@ZIF-8-0.08 was annealed under Ar atmosphere at 700 ℃ for 2 h and then annealed under air at 350 ℃ for 2 h. The as-synthesized material was named Fe2O3@N-C. The experimental details are provided in the experimental section.

|
Download:
|
| Scheme 1. Synthetic process of Fe2O3@N-C. | |
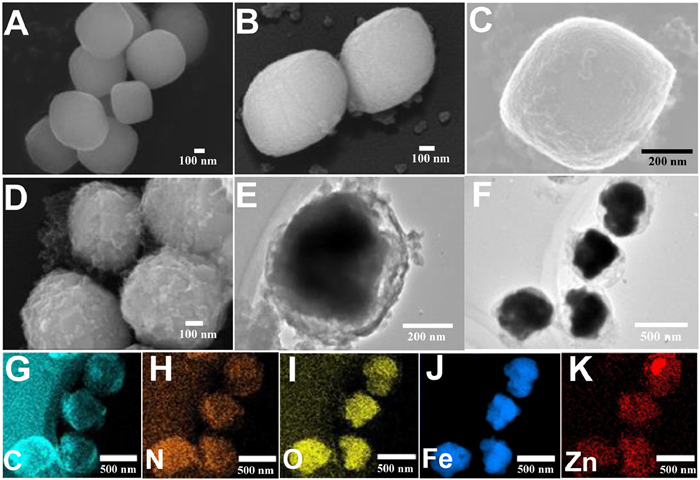
Fe2O3 was characterized by field emission scanning electron microscopy (FESEM) and powder X-ray diffraction (PXRD). As shown in Fig. 1A, Fe2O3 exhibits a uniform cube-like structure. PXRD results confirm that the as-prepared Fe2O3 is hematite (α-Fe2O3) (Fig. S1A in Supporting information). Compared to the original Fe2O3, the surface of Fe2O3@ZIF-8-0.08 was rough, which can be attributed to the formation of ZIF-8 on the surface of the Fe2O3nanocubes (Figs. 1B and C). In addition, the PXRD patterns of Fe2O3@ZIF-8-0.08 match the combination of the patterns of α-Fe2O3 and ZIF-8 quite well (Fig. S1B in Supporting information). The core-shell structure of Fe2O3@ZIF-8-0.08 was further confirmed by transmission electron microscopy (TEM). It is observed from the obtained SEM image (Fig. S2 in Supporting information) that the ZIF-8 nanoparticles with an average size of 8 nm are densely coated on the Fe2O3 surface and form a ZIF-8 shell. Moreover, transmission electron microscope-energy dispersive X-ray spectroscopy (TEM-EDX) reveals that Zn and N elements are uniformly distributed in the shell of Fe2O3@ZIF-8-0.08, while the Fe element is distributed in the core (Fig. S3 in Supporting information). Furthermore, we also measured the porosity and surface area of Fe2O3 and Fe2O3@ZIF-8-0.08. It is found that the Fe2O3 displays a typical type Ⅳ isotherm with a surface area of 29.96 m2/g and a pore size distribution centered at 1.48 nm. The Fe2O3@ZIF-8-0.08 displays a typical type Ⅰ isotherm with a surface area of 432.24 m2/g and a pore size distribution centered at 1.1 nm (Figs. S4A-D in Supporting information). These results indicate that the ZIF-8 shell had been successfully coated on the surface of Fe2O3.

|
Download:
|
| Fig. 1. (A, B) FESEM images of Fe2O3 and Fe2O3@ZIF-8-0.08. (C) SEM image of Fe2O3@ZIF-8-0.08. (D) FESEM images of Fe2O3@N-C. (E, F) TEM images of Fe2O3@N-C. (G-K) TEM-EDS of Fe2O3@N-C. | |
The morphology of the Fe2O3@N-C was first investigated by FESEM (Fig. 1D). It is observed that the nanoparticles are perfectly maintained and uniformly distributed. After the annealing treatment, the original morphology of the ZIF-8 shell was destroyed, and porous carbon layers were formed. TEM images show that a thin carbon shell was uniformly coated on the inner Fe2O3 particles (Fig. 1E). It is important to note that Fe2O3 exhibits a sphere-like structure instead of a cube-like structure, with a cavity created between the carbon layer and the Fe2O3 particles (Fig. 1E). To elucidate the origin of the structural change, we compared the average diameters of the Fe2O3 particles before and after the 700 ℃ treatment. As shown in Fig. S5 (Supporting information), the sizes of the initial Fe2O3 particles are mainly distributed around 556 nm, which is larger than that of Fe2O3-700 (526 nm). The average diameter of the Fe2O3 particles is 528 nm, also larger than that of the Fe2O3-700 (500 nm). This decrease in the particle size may be attributed to the condensation of the loose microstructure of Fe2O3during the pyrolysis process. Furthermore, the EDS mappings results (Figs. 1F-K) show the uniform distribution of Fe and O elements inside, and of the C, N and Zn elements outside, confirming that the sample after the annealing consists of the N-C shell and the Fe2O3 core.
XRD measurements were carried out to study the structure and composition of the Fe2O3@N-C. As shown in Fig. 2A, the hematite phase appears after the pyrolysis process. Carbon diffraction peaks were not found in the XRD pattern, indicating the presence of an amorphous carbon structure [22]. In addition, the Raman spectrum of the Fe2O3@N-C (Fig. 2B) shows a pronounced wide peak at approximately 1500 cm−1 that corresponds to amorphous carbon, further confirming the amorphous structure of the carbon shell [23]. The surface chemical composition of the Fe2O3@N-C was studied by X-ray photoelectron spectroscopy (XPS). As shown in Fig. 2C, typical Fe, Zn, C, O and N signals were detected. In the C 1s high-resolution spectrum (Fig. 2D), four distinct peaks located at 284.5, 284.8, 285.5 and 288.5 eV correspond to C=C, C-C, C-O and C-N, respectively [24, 25]. The Fe 2p high-resolution XPS spectrum (Fig. 2E) is deconvoluted into five peaks, with the peaks at 712.1 eV and 725.1 eV assigned to Fe 2p3/2 and Fe 2p1/2 of Fe3+, the peaks at 710.3 eV and 723.4 eV assigned to Fe 2p3/2 and Fe 2p1/2 of Fe2+, and the satellite peaks, located at 719.0 eV and 732.7 eV, respectively [14, 26, 27]. The XPS spectrum of Zn 2p is fitted by two peaks (Fig. 2F), in which the Zn 2p3/2 signal centered at 1021.5 eV is assigned to the Zn–O bond and the peak at 1044.6 eV assigned to Zn 2p1/2 [28]. We also fitted the O 1s spectrum, as shown in Fig. S6A (Supporting information), and the peaks at approximately 530.0 eV are assigned to O2−, while the peaks at 531.0 and 532.2 eV are attributed to C-O and Zn–O, respectively [29]. In the N 1s high-resolution spectrum (Fig. S6B in Supporting information), the three distinct peaks located at 398.4, 399.8 and 401.2 eV correspond to pyridinic N, pyridonic N and graphitic N, respectively [25]. According to the above analysis, an Fe2O3 core encapsulated with an N-doped amorphous carbon hollow shell structure was successfully prepared.

|
Download:
|
| Fig. 2. (A) XRD pattern of Fe2O3@N-C. (B) Raman spectrum of Fe2O3@N-C. (C) The survey, (D) C 1s, (E) Fe 2p and (F) Zn 2p spectra of Fe2O3@N-C. | |
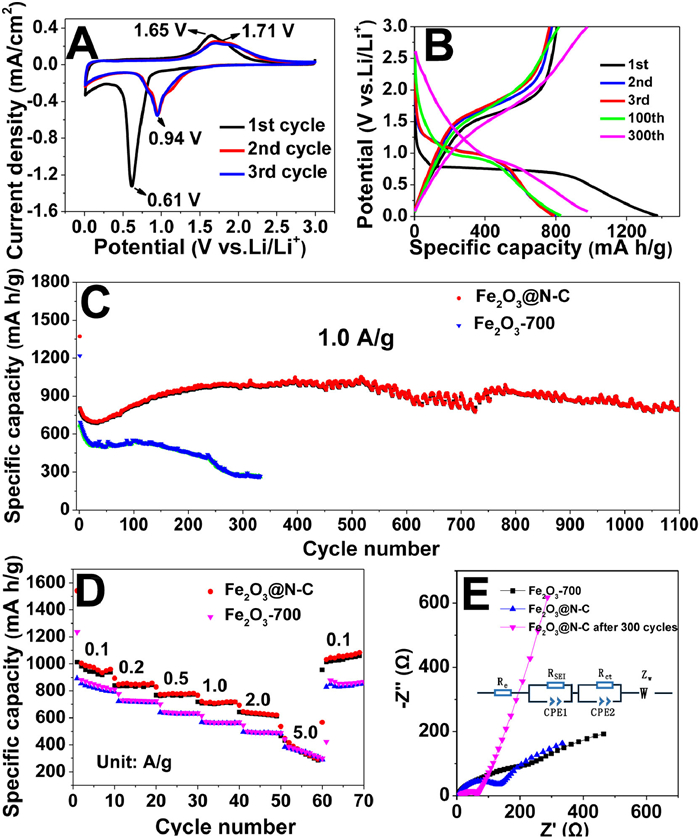
The electrochemical properties of the Fe2O3@N-C were first studied by cyclic voltammetry (CV) in the voltage range of 0.01-3.00 V (vs. Li+/Li) at a scan rate of 0.1 mV/s (Fig. 3A). The sharp peak observed in the first sweep cycle at 0.61 V can be attributed to the formation of a solid electrolyte interphase (SEI) film and the reduction of Fe3+ to Fe0, and the anodic peak at 1.65 V is related to the oxidation of Fe0 to Fe3+ [30-32]. In the subsequent 2nd and 3rd cycles, the cathodic and anodic peaks shift to 0.94 V and 1.71 V, respectively, implying the improved electrical contact between the electrolyte and electrodes and irreversible phase transformation [33, 34]. The well-overlapped CV curves in the 2nd and 3rd cycles indicate good electrochemical reversibility. The charge-discharge profiles of the Fe2O3@N-C electrode at different cycles under a current density of 1.0 A/g are shown in Fig. 3B. In the first cycle, the Fe2O3@N-C shows a voltage plateau at 0.7 V that is related to the reduction of Fe2O3 and the formation of the SEI layer. Interestingly, the subsequent 2nd, 3rd and 100th charge-discharge profiles almost have a similar voltage plateau at approximately 1.0 V that originates from either textural modifications or the drastic lithium-driven structural change [35]. Then, the voltage plateau of 300th drops to about 0.85 V mainly attributing to the alteration in the polarization arising from the SEI film. The Fe2O3@N-C electrode delivers an initial discharge-charge capacity of 1371.6/806.3 mAh/g with an initial coulombic efficiency (CE) of 58.4%. Then, the discharge capacity gradually increases to 1000 mAh/g after 300 cycles with high CEs of approximately 99.5%, demonstrating its long-term cycling reversibility. This phenomenon can be related to the continuous activation of Fe2O3, along with long-term cycling stability [36, 37]. Furthermore, the long-term cycling stability tests were also carried out at a current density of 1.0 A/g in order to evaluate the performance of the electrodes in LIBs. As shown in Fig. 3C, the Fe2O3@N-C anode retains a reversible capacity of 803.6 mAh/g after 1100 cycles. Comparison to the reports shows that the cycling performance of Fe2O3@N-C is better than those of some reported ferric oxide-based anode materials (Table S1 in Supporting information). The pure Fe2O3 anode shows a significant capacity decay (only 274.5 mAh/g after 300 cycles), further confirming the importance of the carbon shell and cavity for cycle stability. The rate capability of the Fe2O3@N-C electrode was investigated in order to examine the suitability of this electrode for practical applications. As shown in Fig. 3D, the Fe2O3@N-C electrode exhibits the average capacities of 951.7, 838.3, 768.9, 708.7, 627.3 and 324.9 mAh/g at the current densities of 0.1, 0.2, 0.5, 1.0, 2.0 and 5.0 A/g, respectively. Subsequently, a higher capacity of 1035.6 mAh/g can be obtained when the current density returns to 0.1 A/g, demonstrating its high rate capability (Fig. 3D). By contrast, the Fe2O3-700 electrode exhibits lower capability than that of the Fe2O3@N-C electrode, which exhibits the average specific capacities of 825.1, 717.4, 638.4, 561.2, 488.6 and 342.3 mAh/g at the current densities of 0.1, 0.2, 0.5, 1.0, 2.0 and 5.0 A/g, respectively, and returns to the capacity of 840 mAh/g at 0.1 A/g.

|
Download:
|
| Fig. 3. (A) CV curves Fe2O3@N-C in the voltage range of 0.01-3.00 V at a scan rate of 0.1 mV/s. (B) Different charge-discharge profiles of Fe2O3@N-C at 1.0 A/g. (C) Cycling performance of Fe2O3@N-C and Fe2O3-700 at 1.0 A/g. (D) Rate performance of Fe2O3@N-C at different current densities. (E) Nyquist plots of Fe2O3-700, Fe2O3@N-C-0.08, Fe2O3@N-C and Fe2O3@N-C after 300 cycles. | |
To further understand the improved performance, electrochemical impedance spectroscopy (EIS) was performed for the Fe2O3-700, Fe2O3-@N-C-0.08, Fe2O3-@N-C, and Fe2O3-@N-C samples after 300 cycles with the obtained EIS results shown in Fig. 3E and the equivalent circuit presented in the inset. An examination of Fig. 3E shows that all EIS plots display a semicircle in the range from high to medium frequency and a line inclined at approximately 45° at low frequencies. Re is the electronic resistance of active materials and the basic parameter for the characterization of the transport resistance in materials. The semicircle is due to two contributions, namely the charge transfer resistance (Rct) of the electrolyte-electrode interface and the solid electrolyte interface resistance (RSEI). The low-frequency line at 45° line corresponds to the Warburg impedance (ZW) that is related to the Li+ diffusion within the cathode materials and Re is the ohmic resistance [38, 39]. The values of these parameters are presented in Table S2 (Supporting information). It is observed from an examination of the data presented in Table S2 that the Rct for Fe2O3-700 is 105.9 Ω and that for Fe2O3-@N-C is 83.4 Ω, suggesting that the carbon coating can accelerate charge transfer during the test. The Rct of the Fe2O3@N-C electrode after 300 cycles (36.9 Ω) is much smaller than that prior to cycling, which ensured the superior performance of this electrode during long-term cycling. The RSEI for Fe2O3@N-C (16.60 Ω) is much smaller than that after 300 cycles (70.28 Ω), which is attributed to the formation of a thicker SEI film.
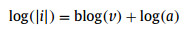
To understand the chemical reaction kinetics of Fe2O3@N-C during the charge-discharge process, CV tests at different scan rates were conducted (Fig. 4A). Based on the power-low relationship (eq. 1), the mathematical relationship between the scan rates (v) and the peak current (i) is

|
(1) |
|
(2) |

|
Download:
|
| Fig. 4. (A) CV curves Fe2O3@N-C in the voltage range of 0.01-3.00 V at the scan rates of 0.1, 0.2, 0.4 and 0.8 mV/s. (B) The relationship between log (peak current, mA) and log (sweep rate, mV/s) and in the cathodic and anodic processes. (C) CV curve that separates into a capacitive current (red region) and a diffusion current (green region) at a scan rate of 0.8 mV/s. (D) Relationship between diffusion and capacity at different scan rates. | |
where the parameter b can be calculated from the linear plot slop of log(v) versus log(|i|) (eq. 2) [40, 41]. Generally, if the b value is 0.5, the electrode exhibits a typical diffusion-controlled process. The b-value is 1, indicating an ideal surface capacitive-controlled kinetics process [41]. In our case, the b values are 0.757 and 0.821 at cathodic and anodic peaks, respectively, suggesting a capacitive-controlled mixed diffusion behavior (Fig. 4B). Then, the current is divided into the capacitive controlled and diffusion controlled contributions according to the following equation:

|
(3) |
where k1v and k2v1/2 represent the capacitive and diffusion contributions, respectively. We can obtain a series of k1 (the linear plot slope) and k2 (intercept) at certain scan rates. Fig. 4C shows the obtained CV curves at 0.8 mV/s where the red represents the capacitive-controlled region and the green represents the diffusion-controlled region. The capacitive-controlled contribution is 87.4% of the overall charge stored at the 0.8 mV/s. The capacity contribution at the other four scan rates was also calculated. As shown in Fig. 4D, the proportions of the capacity contribution are 65.8%, 70.9% and 79.7% at 0.1, 0.2, 0.4 mV/s, indicating a mainly capacitive-controlled process.
To understand the effects of annealing under air and Zn element on the LIB performance, Fe2O3@N-C-0.04, Fe2O3@N-C-0.06, Fe2O3@N-C-0.08, Fe2O3@N-C-0.12 and Fe2O3@N-C-0.24 were prepared by changing the amount of Zn(NO3)2.6H2O and 2-methylimidazole, followed by annealing only under Ar at 700℃. Fig. S7A (Supporting information) shows the cycling stability of Fe2O3@N-C-0.04, Fe2O3@N-C-0.06, Fe2O3@N-C-0.08, Fe2O3@N-C-0.12 and Fe2O3@N-C-0.24 at a current density of 1.0 A/g. After 200 cycles, the specific capacity values of Fe2O3@N-C-0.04 and Fe2O3@N-C-0.06 were 464.2 mAh/g and 329.7 mAh/g, respectively. Similar to Fe2O3-700, these electrodes show a significant capacity decay. Fe2O3@N-C-0.08 exhibits a reversible capacity of 583.6 mAh/g at the first cycle and 705.3 mAh/g after 200 cycles without obvious capacity decay. The capacity curve of Fe2O3@N-C-0.12 is similar to Fe2O3@N-C-0.08, but the capacity is lower than Fe2O3@N-C-0.08. It is interesting to note that the specific capacity of Fe2O3@N-C-0.24 is only 208.6 mAh/g at the first cycle and 213.6 mAh/g after 185 cycles. Thus, it is reasonable to conclude that the significant capacity decay of Fe2O3@N-C-0.04 and Fe2O3@N-C-0.06 is mainly due to the insufficient carbon layers derived from ZIF-8. By contrast, excessive carbon layers of Fe2O3@N-C-0.24 hinder Li-ion diffusion, resulting in a lower specific capacity [42]. In addition to changing the amount of the precursor, annealing under air is another effective approach for controlling the thickness of the carbon layer. Therefore, we anneal Fe2O3@N-C-0.08 at 350 ℃ in the air to further reduce the thickness of the coated carbon layer. Fe2O3@N-C exhibits a reversible capacity of 942.8 mAh/g after 200 cycles, which is 273.8 mAh/g higher than that of Fe2O3-@N-C-0.08. It is important to note that the capacity of Fe2O3@N-C-0.24 only is 208.6 mAh/g at 1.0 A/g which is quite similar to that of the N-doped ZIF-8-derived carbon reported by Tai et al. [43]. However, after Fe2O3@N-C was treated in the air for 2 h, ZnO was formed. To investigate the effect of ZnO on the performance, we synthesized N-doped carbon by annealing ZIF-8 first under Ar atmosphere and then in air. Impressively, the specific capacity of N-C was 383.3 mAh/g after 200 cycles (Fig. S7B in Supporting information) which is much higher than that of Fe2O3@N-C-0.24.
In summary, the Fe2O3@N-C electrode was successfully fabricated by coating ZIF-8 on the surface of cube-like Fe2O3 followed by the carbonization at 700 ℃ for 2 h under Ar and then 350 ℃ for 2 h under air. A void was created between the Fe2O3 and N-C carbon shell during the carbonization process that alleviates the volume expansion of Fe2O3 during Li intercalation. As a result, the as-prepared Fe2O3@N-C anode possesses a high specific capacity (1064 mAh/g at 0.1 A/g), and stable cycle life (803.6 mAh/g at 1.0 A/g after 1100 cycles). Moreover, we found that carbonization under air enables the creation of new active species and reduces the thickness of the carbon shell, promoting LIB performance. This work provides a new method for the design and fabrication of core-shell electrodes for a variety of applications.
Declaration of competing interestThe authors declare that they have no known competing financial interests or personal relationships that could have appeared to influence the work reported in this paper.
AcknowledgmentThe authors are grateful to the Program of Introducing Talents of Discipline to Universities (No. B18030), the National Natural Science Foundation of China (Nos. 91856124 and 21531005), the Natural Science Foundation of Tianjin City (No. 19JCZDJC37200), the National Postdoctoral Program for Innovative Talents (No. BX20190157) and the Postdoctoral Research Foundation of China (No. 2019M660979).
Supplementary materialsSupplementary material associated with this article can be found, in the online version, at doi:10.1016/j.cclet.2021.08.013.
| [1] |
M. Armand, J.M. Tarascon, Nature 45 (2008) 652-657. DOI:10.1038/451652a |
| [2] |
S. Choi, T.W. Kwon, A. Coskun, et al., Science 357 (2017) 279-283. DOI:10.1126/science.aal4373 |
| [3] |
C. Li, X. Zhang, K. Wang, et al., Chin. Chem. Lett. 31 (2020) 1009-1013. DOI:10.1016/j.cclet.2019.09.056 |
| [4] |
M. Zhong, D.H. Yang, C.C. Xie, et al., Small 12 (2016) 5564-5571. DOI:10.1002/smll.201601959 |
| [5] |
C. Wei, H. Fei, Y. Tian, et al., Chin. Chem. Lett. 31 (2020) 980-983. DOI:10.1016/j.cclet.2019.12.033 |
| [6] |
H.C. Jin, S. Xin, C.H. Chuang, et al., Science 370 (2020) 192-197. DOI:10.1126/science.aav5842 |
| [7] |
Q. Xu, J.K. Sun, Z.L. Yu, et al., Adv. Mater. 30 (2018) 1707430. DOI:10.1002/adma.201707430 |
| [8] |
Y. Zhang, Y. Shi, X.C. Hu, Adv. Energy Mater. 10 (2020) 1903325. DOI:10.1002/aenm.201903325 |
| [9] |
S.H. Lee, J.H.Oha M.Kotala, et al., Carbon 119 (2017) 355-364. DOI:10.3390/su9030355 |
| [10] |
Y. Lu, L. Yu, M.H. Wu, et al., Adv. Mat. 30 (2018) 1702875. DOI:10.1002/adma.201702875 |
| [11] |
J. Liu, X.J. Xu, R.Z. Hu, et al., Adv. Energy Mater. 6 (2016) 1600256. DOI:10.1002/aenm.201600256 |
| [12] |
A. Li, M. Zhong, W. Shuang, et al., Inorg. Chem. Front. 5 (2018) 1602-1608. DOI:10.1039/C8QI00196K |
| [13] |
W. Shuang, H. Huang, L.J. Kong, et al., Nano Energy 62 (2019) 154-163. DOI:10.1016/j.nanoen.2019.05.030 |
| [14] |
M.L. Qin, Z.L. Zhang, Y.Z. Zhao, et al., Adv. Funct. Mater. 34 (2019) 1902822. DOI:10.1002/adfm.201902822 |
| [15] |
Z.M. Zheng, Y. Zao, Q.B. Zhang, et al., Chem. Eng. J. 347 (2018) 563-573. DOI:10.1016/j.cej.2018.04.119 |
| [16] |
G.L. Gao, Y. Jin, Q. Zeng, et al., Beilstein J. Nanotechnology 8 (2017) 649-656. DOI:10.3762/bjnano.8.69 |
| [17] |
J. Liang, X.Y. Yu, H. Zhou, et al., Angew. Chem. Int. Ed. 53 (2014) 12803-12807. DOI:10.1002/anie.201407917 |
| [18] |
M. Zhong, L.J. Kong, N. Li, et al., Coordin. Chem. Rev. 388 (2019) 172-201. DOI:10.1016/j.ccr.2019.02.029 |
| [19] |
Z.G. Tai, M. Shi, S.K. Chong, et al., J. Alloys Compd. 800 (2019) 1-7. DOI:10.1016/j.jallcom.2019.06.037 |
| [20] |
F. Pang, S. Hou, P. Wang, et al., Chem. Eur. J. 25 (2019) 5043-5050. DOI:10.1002/chem.201806006 |
| [21] |
X.Y. Yu, H.B. Wu, L. Yu, et al., Angew. Chem. Int. Ed. 54 (2015) 4001-4004. DOI:10.1002/anie.201411353 |
| [22] |
J.S. Meng, Q. He, L.H. Xu, et al., Adv. Energy Mater. 9 (2019) 1802695. DOI:10.1002/aenm.201802695 |
| [23] |
M.S. Dresselhaus, A. Jorio, M. Hofmann, et al., Nano Lett. 10 (2010) 751-758. DOI:10.1021/nl904286r |
| [24] |
H. Xu, C.K. Wu, X.J. Wei, et al., J. Mater. Chem. A 6 (2018) 15340-15347. DOI:10.1039/C8TA04777D |
| [25] |
H. Huang, X.J. Wei, S.Y. Gao, Electrochim. Acta 220 (2016) 427-435. DOI:10.1016/j.electacta.2016.10.108 |
| [26] |
B.Q. Liu, Q. Zhang, Z.S. Jin, et al., Adv. Energy Mater. 8 (2018) 1702347. DOI:10.1002/aenm.201702347 |
| [27] |
P. Wu, N. Du, H. Zhang, et al., J. Phys. Chem. C 115 (2011) 3612-3620. DOI:10.1021/jp1113653 |
| [28] |
S. Aksoy, Y. Caglar, S. Mujdat, et al., J. Alloys Compd. 512 (2012) 171-178. DOI:10.1016/j.jallcom.2011.09.058 |
| [29] |
K.S. Lee, S. Park, W. Lee, et al., ACS appl. Mater. Inter. 8 (2016) 2027-2034. DOI:10.1021/acsami.5b10342 |
| [30] |
Y.Z. Yan, H.L. Tang, F. Wu, et al., Electrochim. Acta 253 (2017) 104-113. DOI:10.1016/j.electacta.2017.09.061 |
| [31] |
H.N. Li, X.F. Zhu, H. Sitinamaluwa, et al., J. Alloys. Compd. 714 (2017) 425-432. DOI:10.1016/j.jallcom.2017.04.260 |
| [32] |
Y.H. Sun, S. Liu, F.C. Zhou, et al., Appl. Surf. Sci. 390 (2016) 175-184. DOI:10.1016/j.apsusc.2016.08.071 |
| [33] |
S.K. Liu, Z.X. Chen, K. Xie, et al., J. Mater. Chem. A 2 (2014) 13942-13948. DOI:10.1039/C4TA03152K |
| [34] |
F. Han, W.C. Li, D. Li, et al., J. Energy Chem. 22 (2013) 329-335. DOI:10.1089/dna.2013.1970 |
| [35] |
C. Wang, Y. Zhao, D. Su, et al., Electrochim. Acta 231 (2017) 272-278. DOI:10.1016/j.electacta.2017.02.061 |
| [36] |
L.H. Yin, Y.J. Gao, I. Jeon, et al., Chem. Eng. J. 356 (2019) 60-68. DOI:10.1016/j.cej.2018.09.017 |
| [37] |
T.M. Zhang, J.Z. Zheng, Z.Q. Liang, et al., Electrochim. Acta 306 (2019) 151-158. DOI:10.1016/j.electacta.2019.03.127 |
| [38] |
X. Tan, L. Guo, S. Liu, et al., Adv. Funct. Mater. 29 (2019) 1-10. DOI:10.1155/2019/9692350 |
| [39] |
J.F. Zhou, B.C. Zhao, J.Y. Song, et al., ACS Appl. Energy Mater. 2 (2019) 354-362. DOI:10.1021/acsaem.8b01334 |
| [40] |
L.D. Shi, D.Z. Li, P.P. Yao, et al., Small 14 (2018) 1802716. DOI:10.1002/smll.201802716 |
| [41] |
W. Xu, L.J. Kong, H. Huang, et al., Inorg. Chem. Front. 6 (2019) 2675-2681. DOI:10.1039/c9qi00789j |
| [42] |
M. Yousaf, Y.S. Wang, Y.J. Chen, et al., Adv. Energy Mater. 9 (2019) 1900567. DOI:10.1002/aenm.201900567 |
| [43] |
Z.G. Tai, M. Shi, S.K. Chong, et al., J. Alloys Compd. 800 (2019) 1-7. DOI:10.1016/j.jallcom.2019.06.037 |