 2022, Vol. 33


b Macromolecular Chemistry and Bavarian Polymer Institute, University of Bayreuth, Bayreuth 95440, Germany
Energy, which vitally relates to human life from manufacturing to transportation, is essential for modern economies. With the growth of global population, the increase of energy demand and intensification of global climate change, developing sustainable pathways with fossils to produce fuels and chemicals is crucial to energy security [1]. Electrocatalysis, which can utilize renewable power (solar, wind and hydro) as the driving force to convert atmospheric molecules (e.g., N2, CO2 and H2O) to products with higher values (e.g., NH3, C2H4 and H2), is a good choice [2-4]. During the conversion process, catalysts for improving the reaction rate, efficiency and selectivity play a key role. Hence, developing advanced catalysts with high performance is imperative.
In recent years, supported metal catalysts have been widely concerned in electrocatalysis benefiting from the strong metal–support interaction (SMSI), which is very important to tune the stability and selectivity of catalysts [5]. Currently, two approaches are mainly adopted to improve the SMSI: reducing the size of the loaded metal particles and constructing vacancies (e.g., by heteroatom doping or amorphization) on the support [6, 7]. Decreasing the particle size to nanoscale, especially to single atoms (SAs), can ensure the maximum exposure of active sites and improve the catalyst performance, since the processes of reactants adsorption and products desorption take place on the active sites [8]. However, the unachievable high-loading and difficulty in large-scale production of SAs greatly limit their practical applications [9]. Loading ultrasmall-size nanoparticles (NPs) on the support still dominates current research.
Vacancy engineering of the support is another approach to enhance the SMSI by changing the chemical structure of the support and improving the charge transfer [7, 10]. However, the present vacancy engineering strategies are either time-consuming with multiple steps or energy-consuming with harsh synthesis conditions [11-13]. Although the introduction of doping ions is a simple method to construct vacancies in the support, one more process is needed to load metal NPs [14]. Besides, carbon fiber paper is usually used as the matrix to load the catalyst by polymer binder, which makes most active sites unable to contact the reactants in electrocatalysis [15]. Under these circumstances, developing a new method for metal NPs loading and vacancy engineering simultaneously is imperative.
Herein, the formation of Pt NPs and the vacancy engineering of TiO2–x NFs are implemented simultaneously through a simple NaBH4 reduction. By pouring NaBH4 solution (80 ℃) into the dispersion with H2PtCl6 and TiO2 NFs without other harsh conditions, the Pt4+ is reduced and loaded on the TiO2 NFs immediately, and the TiO2 NFs are reduced by NaBH4 in 5 min to form TiO2–x NFs with abundant oxygen vacancies (OVs). Furthermore, the Pt/TiO2–x NFs are prepared into a Pt/TiO2–x NA with good mechanical properties by a freeze-drying process. As an application presentation, the Pt/TiO2–x NA is used as a self-supporting catalyst for the N2 reduction reaction (NRR) and the optimum NH3 yield rate and Faraday efficiency (FE) are at –0.35 V vs. RHE, being 4.81 × 10⁻¹⁰ mol s–1 cm–2 and 14.9%, respectively.
The illustration for the preparation of Pt/TiO2–x NA is shown in Fig. 1a. Firstly, 0.5 g of flexible TiO2 nanofibrous membrane, whose average fiber diameter was 184 nm (Fig. S1 in Supporting information), was cut into small pieces and dispersed in 20 mL of water to prepare a TiO2 NFs dispersion. Then, a small amount of H2PtCl6 solution was dropped into the dispersion. After being sonicated for 1 h and stirred for another 2 h, the dispersion was transferred to a screw bottle. Subsequently, 180 mL of hot water (80 ℃) with NaBH4 was poured into the screw bottle under vigorous stirring. The dispersion was changed from yellow to gray immediately and the TiO2 NFs were reduced in 5 min in the presence of NaBH4 [16]. After being cooled naturally to ambient temperature, the dispersion was centrifuged and washed several times alternately with 0.1 mol/L HCl and water to obtain 47.5 mL of Pt/TiO2–x NFs dispersion. After that, 2.5 mL of SiO2 sol working as the binder was dropped into the dispersion and stirred for 2 h [13]. The color of the dispersion remained unchanged during this process, showing the stability of the Pt/TiO2–x NFs (Fig. S2 in Supporting information). Finally, the dispersion was poured into a homemade mold, directionally frozen by a cold plate, and freeze-dried to obtain a Pt/TiO2–x NA. For comparison, TiO2–x NA and TiO2 NA were also prepared (Fig. S3 in Supporting information). Benefiting from its ultralight feature, the Pt/TiO2–x NA can stand on the tip of a flower (Fig. 1b). An ordered cellular architecture of Pt/TiO2–x NA can be seen in Figs. 1c and d, the field emission scanning electron microscopy (FESEM) images, which is caused by the fiber self-assembly with oriented growth of ice crystals during the directional freezing progress [13, 17]. The bonding structure caused by the SiO2 sol wrapping around the TiO2 NFs in Fig. 1e can maintain the stability of the Pt/TiO2–x NA [18]. Under the transmission electron microscopy (TEM) observation in Figs. 1f–h, it can be seen the successful loading of Pt NPs (3.9 nm) on the surface of TiO2 NFs. The energy dispersive X-ray (EDX) mapping spectra of a Pt/TiO2–x nanofiber in Fig. 1i further prove the uniform distribution of Pt NPs. The loading amount of Pt NPs is 4.9 wt%, as tested by inductively coupled plasma optical emission spectrometer (ICP–OES). Moreover, the Pt/TiO2–x NA has a large Brunauer−Emmett−Teller (BET) surface area of 70.99 m2/g (Fig. S4 in Supporting information), which is a vital factor to the electrocatalytic reaction.

|
Download:
|
| Fig. 1. (a) Illustration of the preparation procedure of Pt/TiO2–x NA. (b) Digital image showing the ultralight feature of Pt/TiO2–x NA (2 mg/cm3). FESEM images showing (c) the ordered lamellar structure, (d) the interlaminar cellular structure and (e) the lamellar wall of Pt/TiO2–x NA. (f) Low- and (g) high-magnification TEM images of Pt/TiO2–x NF and the inset in (g) presents the size distribution of Pt NPs. (h) HRTEM image and (i) HAADF image and the corresponding EDX maps of Pt/TiO2–x NF. | |
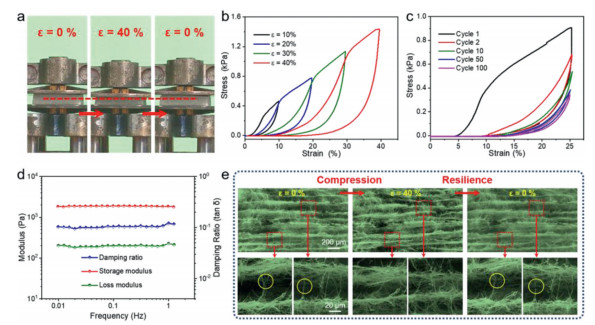
Good mechanical properties are the prerequisite for self-supporting catalysts. Benefiting from the excellent mechanical properties of TiO2 NFs (Fig. S5 in Supporting information) and the resilient bonding among the TiO2 NFs caused by the elastic Si−O−Si bonds, the Pt/TiO2–x NA (10 mg/cm3, bulk density) can bear a compression strain up to 40% (Fig. 2a) [13, 19]. From the quantitative characterization of the mechanical properties, the Pt/TiO2–x NA has a plastic deformation about 16.9% at a compression strain up to 40% during the first stress–strain cycle under different maximum compression (Fig. 2b). Furthermore, the stability of the mechanical properties was measured through a compression–resilience cycle test at 25% compression strain in Fig. 2c and more than 12% plastic deformation occurs after 100 compressions. The viscoelastic properties of the Pt/TiO2–x NA were also demonstrated in Fig. 2d, and the stability of modulus and damping ratio from the frequency-dependent tests (0.1–1 Hz) indicates the dynamic mechanical response of the Pt/TiO2–x NA is good [19]. Unmissably, the mechanical properties and viscoelastic properties of the Pt/TiO2–x NA are not so good as those of the TiO2 NA in our previous work because of the poor mechanical properties of TiO2 nanofibrous membrane (Fig. S5) and the shorter average fiber length (Fig. S6 in Supporting information) in the Pt/TiO2–x NA, which is not conducive to enhance the interaction among fibers through entanglement [13, 20, 21]. To provide insight into the elasticity mechanism, in-situ FESEM observations at a maximum compression strain of 40% were performed in Fig. 2e. During the compression process, the compression work was transformed into elastic potential energy by the bending of nanofiber bundles among the ordered cellular architecture (Fig. S7 in Supporting information). The elastic potential energy was released with the stress decreasing during the resilience process [15]. However, when the bending degree exceeded the bearing limit, the fiber bundles would be broken, as marked by the yellow circles in Fig. 2e and caused the plastic deformation of the Pt/TiO2–x NA.

|
Download:
|
| Fig. 2. (a) Digital images showing the compression and resilience process at a large compressive strain (ε = 40%). (b) Compressive stress–strain plots of Pt/TiO2–x NA under different maximum strains. (c) Selected compressive stress–strain plots of Pt/TiO2–x NA over 100 cycles compression (ε = 25%). (d) Dynamic mechanical property of Pt/TiO2–x NA at an oscillatory ε = 1%. (e) In-situ FESEM images showing the microstructure evolution of Pt/TiO2–x NA during the compression and resilience process (compressive ε = 40%). | |
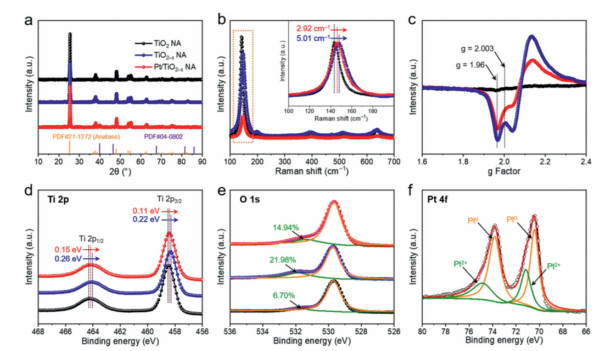
The X-ray diffraction (XRD) patterns of the TiO2 NA, TiO2–x NA and Pt/TiO2–x NA are shown in Fig. 3a, revealing that the crystalline structures of TiO2 remain unchanged after NaBH4 reduction. The diffraction peaks of Pt (JCPDS #04‒0802) can be observed, in consistent with the above TEM results [22]. The TiO2 NA displays the typical Raman active modes of anatase TiO2 with the characteristic peaks at 143.9, 197.2 and 639.8 cm–1 (Eg), 397.3 cm–1 (B1g), and 515.6 cm–1 (A1g) in Fig. 3b [23]. Compared to the TiO2 NA, the strongest band coming from external vibration of the Ti–O bond at 143.9 cm–1 shifts to higher wavenumbers in the TiO2–x NA and Pt/TiO2–x NA by 5.01 cm–1 and 2.92 cm–1, respectively (Fig. 3b, inset), demonstrating the existence of oxygen vacancies caused by the decrease of oxygen species [24]. Because of the charge balance, the formation of each OV will, in turn, produce a pair of Ti3+, which can be confirmed by the electron paramagnetic resonance (EPR) and X-ray photoelectron spectroscopy (XPS) measurements [25]. The distinct signal at g = 2.003 and g = 1.96 corresponding to OVs and Ti3+, respectively, can be found in Fig. 3c [26]. Notably, the instability of surface Ti3+ makes it easy to be oxidized in aerobic environment (air or water) [27]. So the obvious Ti3+ EPR signals in Fig. 3c indicate the presence of bulk Ti3+, accounting for its high stability during the NA preparation process, which is inevitably illuminated in air or water. In the high-resolution Ti 2p XPS spectrum of TiO2 NA (Fig. 3d), two peaks assigned to Ti4+ at 457.5 and 464.3 eV can be observed, corresponding to Ti 2p3/2 and Ti 2p1/2, respectively. After reduction, these peaks shift to lower binding energies in the TiO2–x NA and Pt/TiO2–x NA, demonstrating that electrons are withdrawn from deficient oxygen atoms [28]. The O 1s XPS spectra (Fig. 3e) for the three samples contain two peaks which are associated with lattice oxygen (529.9 eV) and OVs (531.8 eV) [12]. The increased peak area of OVs in the TiO2–x NA and Pt/TiO2–x NA indicates that more surface defects were produced after NaBH4 reduction. The Pt 4f XPS spectrum in Fig. 3f provides further evidence for the presence of metallic Pt in Pt/TiO2x NA from the peaks of Pt0 at 71.2 and 74.5 eV [29]. Considering that H2PtCl6 (Pt4+) was chosen as the Pt source, some metallic Pt species should be reduced by the surface OVs of TiO2–x with charge transfer from OVs to Pt NPs, causing the peak intensity or shift degree of the Pt/TiO2–x NA lower than that of the TiO2–x NA in Figs. 3b–e [30].

|
Download:
|
| Fig. 3. (a) XRD patterns of TiO2 NA, TiO2–x NA and Pt/TiO2–x NA. (b) Raman spectra of TiO2 NA, TiO2–x NA and Pt/TiO2–x NA and inset is the magnification of Eg peak. (c) EPR spectra of TiO2 NA, TiO2–x NA and Pt/TiO2–x NA. (d) Ti 2p and (e) O 1s XPS spectra of TiO2 NA, TiO2–x NA and Pt/TiO2–x NA. (f) Pt 4f XPS spectrum for Pt/TiO2–x NA. | |
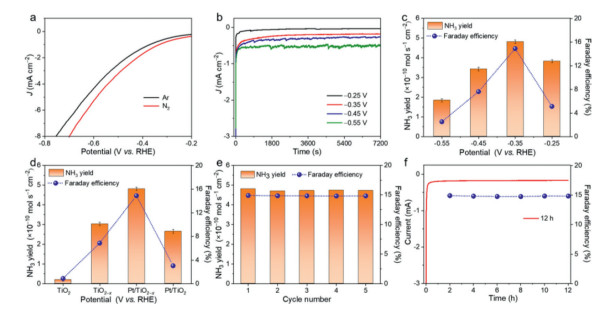
An H-type cell (three-electrode system), separated by a Nafion 212 membrane, was used for the NRR performance. According to the linear sweep voltammetry (LSV) curves (Fig. 4a), the current density in N2-saturated 0.1 mol/L Na2SO4 electrolyte is much higher than that in Ar-saturated 0.1 mol/L Na2SO4 electrolyte between –0.8 V to –0.2 V vs. RHE, implying the effective N2 reduction performance of the Pt/TiO2–x NA [31]. From Fig. 4b, the chronoamperometric curves, no obvious fluctuation in the current can be observed at different potentials, indicating good stability during the electrocatalytic process [32, 33]. In order to quantify the NH3 yield of the Pt/TiO2–x NA at different potentials, indophenol blue method was employed. According to the standard curves and UV-vis absorption spectra of electrolyte, which were dyed by indophenol blue, after 2 h reaction in Fig. S8 (Supporting information), the NH3 yield rate and FE could be further calculated. As plotted in Fig. 4c, the optimum NH3 yield rate occurred at –0.35 V vs. RHE for the Pt/TiO2–x NA, which were 4.81 × 10⁻¹⁰ mol s–1 cm–2 and 14.9%, respectively. These values rank our Pt/TiO2–x NA as an advanced catalyst towards electrocatalytic NRR, as compared with other noble metal/TiO2 or TiO2-based catalysts (Table S1 in Supporting information). As a comparison, the NRR performance for TiO2 NA, TiO2–x NA and Pt/TiO2–x NA at –0.35 V vs. RHE were also measured in Fig. 4d. The Pt/TiO2–x NA shows the best performance, proving that the higher vacancy concentration and the interaction between Pt and TiO2–x is beneficial to improve the catalytic activity in electrocatalytic NRR. It is also proved by the N2 temperature-programmed desorption (N2–TPD) spectra in Fig. S9 (Supporting information) that the Pt/TiO2–x NA has the highest desorption temperature, meaning that the presence of Pt NPs and OVs effectively enhance the N2 chemisorption, which is favorable for the improvement of NRR performance [34]. Considering the stability of catalysts is a critical parameter in practical applications, cycling tests and a longtime electrolysis for the Pt/TiO2–x NA at –0.35 V vs. RHE were assessed. As observed in Fig. 4e, the NH3 yield rate and FE do not significantly change during 5 successive tests, showing the excellent recyclability for N2 reduction. Besides, no obvious fluctuation of current density and FE after 12 h electrolysis in Fig. 4f suggests that the Pt/TiO2–x NA has good electrochemical durability. The possible byproduct hydrazine was not detected after 12 h electrolysis by the Watt and Chrisp method (Fig. S10 in Supporting information).

|
Download:
|
| Fig. 4. (a) LSV curves of Pt/TiO2–x NA in N2- and Ar-saturated 0.1 mol/L Na2SO4 electrolytes. (b) Chronoamperometric curves and (c) NH3 yield rates and FE for Pt/TiO2–x NA at different potentials (V vs. RHE). (d) The comparison of NH3 yield rates and FE at optimum potential for TiO2 NA, TiO2–x NA and Pt/TiO2–x NA at –0.35 V vs. RHE. (e) Cycling tests and (f) a longtime electrolysis for Pt/TiO2–x NA at –0.35 V vs. RHE. | |
In conclusion, we utilize a convenient strategy to achieve the Pt NPs formation and the vacancy engineering of TiO2–x NFs simultaneously. Under the function of NaBH4, the whole reduction process can be completed in 5 min. Benefiting from the high stability of OVs in the Pt/TiO2–x NFs in air and water, the Pt/TiO2–x NA can be prepared after a freeze-drying process. The nanofiber bundles among the ordered cellular architecture, induced by the oriented growth of ice crystals, endow the Pt/TiO2–x NA with excellent mechanical properties to work as a self-supporting electrode for electrocatalysis, achieving high NH3 yield rate (4.81 × 10⁻¹⁰ mol s–1 cm–2) and FE (14.9%) at –0.35 V vs. RHE with excellent stability for electrocatalytic NRR.
Declaration of competing interestThe authors declare that they have no known competing financial interests or personal relationships that could have appeared to influence the work reported in this paper.
AcknowledgmentsThis work was financially supported by the National Natural Science Foundation of China (Nos. 52173055, 21961132024 and 51925302), the Natural Science Foundation of Shanghai (No. 19ZR1401100), the Innovation Program of Shanghai Municipal Education Commission (No. 2017-01-07-00-03-E00024), the Fundamental Research Funds for the Central Universities (No. CUSF-DH-D-2019028), and the DHU Distinguished Young Professor Program (No. LZA2020001). D. Fang and A. Greiner acknowledge financial support from DFG (No. 431073172).
Supplementary materialsSupplementary data associated with this article can be found, in the online version, at 10.1016/j.cclet.2021.08.069.
| [1] |
Z.W. Seh, J. Kibsgaard, C.F. Dickens, et al., Science 355 (2017) eaad4998. DOI:10.1126/science.aad4998 |
| [2] |
H. Shen, C. Choi, J. Masa, et al., Chem 7 (2021) 1708-1754. DOI:10.1016/j.chempr.2021.01.009 |
| [3] |
T. Qin, Y. Qian, F. Zhang, B.L. Lin, Chin. Chem. Lett. 30 (2019) 314-318. DOI:10.1016/j.cclet.2018.07.003 |
| [4] |
X. Deng, X. Kang, M. Li, et al., J. Mater. Chem. A 8 (2020) 1138-1146. DOI:10.1039/C9TA06917H |
| [5] |
K. Xiang, Z. Song, D. Wu, et al., J. Mater. Chem. A 9 (2021) 6316-6324. DOI:10.1039/D0TA10501E |
| [6] |
R. Lang, X. Du, Y. Huang, et al., Chem. Rev. 120 (2020) 11986-12043. DOI:10.1021/acs.chemrev.0c00797 |
| [7] |
Q. Jia, S. Ghoshal, J. Li, et al., J. Am. Chem. Soc. 139 (2017) 7893-7903. DOI:10.1021/jacs.7b02378 |
| [8] |
Y. Peng, B. Lu, S. Chen, Adv. Mater. 30 (2018) 1801995. DOI:10.1002/adma.201801995 |
| [9] |
W. Yuan, Y. Ma, H. Wu, L. Cheng, J. Energy Chem. 65 (2022) 254-279. DOI:10.1016/j.jechem.2021.05.046 |
| [10] |
Z.W. Wei, H.J. Wang, C. Zhang, et al., Angew. Chem. Int. Ed. 60 (2021) 16622-16627. DOI:10.1002/anie.202104856 |
| [11] |
F. Lai, W. Zong, G. He, et al., Angew. Chem. Int. Ed. 59 (2020) 13320-13327. DOI:10.1002/anie.202003129 |
| [12] |
A. Moya, A. Cherevan, S. Marchesan, et al., Appl. Catal. B: Environ. 179 (2015) 574-582. DOI:10.1016/j.apcatb.2015.05.052 |
| [13] |
M. Zhang, Y. Wang, Y. Zhang, et al., Angew. Chem. Int. Ed. 59 (2020) 23252-23260. DOI:10.1002/anie.202010110 |
| [14] |
X. Xi, J. Liu, Y. Fan, et al., Nano Energy 82 (2021) 105707. DOI:10.1016/j.nanoen.2020.105707 |
| [15] |
M. Zhang, L. Zhang, S. Huang, et al., Appl. Catal. B: Environ. 292 (2021) 120175. DOI:10.1016/j.apcatb.2021.120175 |
| [16] |
J. Lim, S.H. Kim, R.A. Armengol, et al., Angew. Chem. Int. Ed. 59 (2020) 5651-5655. DOI:10.1002/anie.201915709 |
| [17] |
D. Liu, X. Dong, B. Han, H. Huang, M. Qi, Compos. Commun. 21 (2020) 100374. DOI:10.1016/j.coco.2020.100374 |
| [18] |
Q. Fu, Y. Si, C. Duan, et al., Adv. Funct. Mater. 29 (2019) 1808234. DOI:10.1002/adfm.201808234 |
| [19] |
F. Wang, L. Dou, J. Dai, et al., Angew. Chem. Int. Ed. 59 (2020) 8285-8292. DOI:10.1002/anie.202001679 |
| [20] |
X. Zhao, F. Yang, Z. Wang, et al., Compos. Part B: Eng. 182 (2020) 107624. DOI:10.1016/j.compositesb.2019.107624 |
| [21] |
X. Liao, P. Hu, S. Agarwal, A. Greiner, Macromol. Mater. Eng. 305 (2020) 1900629. DOI:10.1002/mame.201900629 |
| [22] |
H. Sun, Q. Zeng, C. Ye, et al., Chin. Chem. Lett. 31 (2020) 2478-2482. DOI:10.1016/j.cclet.2020.03.032 |
| [23] |
C. Byrne, L. Moran, D. Hermosilla, et al., Appl. Catal. B: Environ. 246 (2019) 266-276. DOI:10.1016/j.apcatb.2019.01.058 |
| [24] |
G. Rajender, J. Kumar, P.K. Giri, Appl. Catal. B: Environ. 224 (2018) 960-972. DOI:10.1016/j.apcatb.2017.11.042 |
| [25] |
N. Cao, Z. Chen, K. Zang, et al., Nat. Commun. 10 (2019) 2877. DOI:10.1038/s41467-019-10888-5 |
| [26] |
I. Gul, M. Sayed, N.S. Shah, et al., Chem. Eng. J. 384 (2020) 123255. DOI:10.1016/j.cej.2019.123255 |
| [27] |
F. Zuo, L. Wang, T. Wu, et al., J. Am. Chem. Soc. 132 (2010) 11856-11857. DOI:10.1021/ja103843d |
| [28] |
J. Yang, Y. Guo, R. Jiang, et al., J. Am. Chem. Soc. 140 (2018) 8497-8508. DOI:10.1021/jacs.8b03537 |
| [29] |
D. Zhou, B. Jiang, R. Yang, X. Hou, C. Zheng, Chin. Chem. Lett. 31 (2020) 1540-1544. DOI:10.1016/j.cclet.2019.11.014 |
| [30] |
L. Li, L. Song, L. Zhu, Z. Yan, X. Cao, Catal. Sci. Technol. 8 (2018) 1277-1287. DOI:10.1039/C7CY02429K |
| [31] |
L. Yang, T. Wu, R. Zhang, et al., Nanoscale 11 (2019) 1555-1562. DOI:10.1039/C8NR09564G |
| [32] |
L. Tang, J. Dai, Y.T. Liu, et al., Compos. Commun. 23 (2021) 100551. DOI:10.1016/j.coco.2020.100551 |
| [33] |
J. Song, J. Dai, P. Zhang, et al., Nano Res. 14 (2021) 1479-1487. DOI:10.1007/s12274-020-3206-x |
| [34] |
Y. Chen, R. Guo, X. Peng, et al., ACS Nano 14 (2020) 6938-6946. DOI:10.1021/acsnano.0c01340 |