 2022, Vol. 33


b College of Mechanical and Electrical Engineering, Shaanxi University of Science and Technology, Xi'an 710021, China;
c School of Sciences, Xi'an Technological University, Xi'an 710021, China;
d College of Resources and Environmental Engineering, Tianshui Normal University, Tianshui 741001, China;
e School of Energy and Materials, Shanghai Polytechnic University, Shanghai 201209, China;
f Shanghai Engineering Research Center of Advanced Thermal Functional Materials, Shanghai Polytechnic University, Shanghai 201209, China
The adsorption of CO2 has attracted great interests in pioneering works, because it is a sort of prototype model in energy and environmental fields. The subjects that widely investigated include CO2 separation from mixed gases [1-9], CO2 reduction [10-12] and fuels synthesis via CO2 [13-17]. Among these areas, the common issues that should be solved exist in the capture and activation process of CO2, which can be reflected from the adsorption energy between CO2 and substrate and strength of C-O bond in CO2. Among numerous substrates, two-dimensional (2D) materials have drawn great attention due to their unique structural properties: ultrahigh surface-volume ratio [18-24]. In our previous study, we have successfully predicted a two-dimensional BC3N2 (2D BC3B2) substrate. This structure is like graphene with B, C and N atoms bonded together upon sp2 hybridization. Compared with graphene, boron nitride and other graphene materials, each hexagonal primitive unit cell of the BC3N2 has one more electron than them [25].
CO2 is an inert gas that can only exhibit physical adsorption on 2D materials, hindering the capture and activation process of CO2. Doping heterogeneous atoms into the substrates is a promising way to regulate the adsorption behavior [26-29]. Li et al. have realized the transformation of CO2 interaction with substrate from physical adsorption to chemical adsorption via N doping [30]. Ma et al. have demonstrated that high O content can enhance the effect of N doping for CO2 adsorption on porous carbon. This complex also has high selectivity for CO2 in CO2/N2 mixture [31]. Yin et al. have performed similar work of CO2 capture on N, S dual-doping graphene and ascribed the enhanced adsorption to the unique channel along the S → N → CO2 path, leading to extra charge transfer from graphene to CO2 [32]. He et al. proved that the process of CO2 capture/release on Fe/Co doped graphynes occurs spontaneously once one extra electron is introduced/removed [33]. Yang et al. have attempted to enhance the CO2 adsorption via electric field and fond that CO2 experienced a transition from physisorption to chemisorption in the electric field range of 0.0060-0.0065 a.u. [34]. Besides capture, the activation process of CO2 is also an essential process that we cannot ignore. CO2 reduction with H is an attractive way to produce fuels or chemicals [35]. Thus, a weakened C-O bond in CO2 is necessary to achieve low reaction barrier for CO2 protonation. Wang et al. have designed a Cr-doped graphyne catalyst, which is able to capture CO2 directly via chemisorption under mild conditions. This character can fully activate CO2 and eventually lead to an exothermal step for CO2 protonation to COOH [36]. Cao et al. have interpreted the activation of CO2 from aspect of local bonding environment on Si doped BN. They demonstrate that the Si-pz dangling bond dominates the Si–CO2 bonding interaction in CO2 adsorption [37]. Zeng et al. have proposed that Mn doping enabled the harmonic overlaps between the p orbitals of O atoms and d orbitals of Mn atoms near the conduction band edge of Mn-doped In2S3 nanosheets during the activation of CO2 [38]. Jiang et al. have demonstrated that the electric dipole moment can serve as a descriptor for establishing structure-property relationships for molecule adsorption and activation [39].
As we know, there also exists some relationship between dipole moment and thermal conductivity. Recently, the compound of carbon, nitride and boron attracted considerable interests due to their semiconducting properties with tunable bandgap and excellent thermal properties, for example both single-layer C3N and C3B sheets behaves as semiconductor with indirect bandgaps of about 1.78 eV and 1.15 eV, respectively [40]. An et al. investigated the thermal conductivity of single-layer C3N sheet and graphene using nonequilibrium molecular dynamics simulations and found that the thermal conductivity of single-layer C3N sheet is much smaller than that of graphene due to the anharmonicity from the polarized covalent bonding between carbon and nitride atoms, and mass difference [41]. The first-principle calculation based on density functional theory (DFT) found that the lattice thermal conductivity of single-layer C3B and C3N sheet are 301 W m−1 K−1 and 380 W m−1 K−1 at 300 K [42]. According to the kinetic theory derived from the Boltzmann transport equation, the thermal conductivity is associated with spectral volumetric specific heat, phonon group velocity and phonon relaxation time. Except for phonon relaxation time, the other two quantities are of phonon harmonic properties, proportional to the strength of chemical bond. In other word, the stronger chemical bonds in inorganic compounds usually lead to the larger phonon group velocity. One the one hand, previous study found that one of thermal conductivity difference mechanisms between single-layer C3N and C3B sheet originates from the higher phonon group velocity of harmonic properties induced by the stronger chemical bond of C-N in C3N compared with that of C-B in C3B [43]. Moreover, the thermal conductivity of monolayer C3BxN1−x alloy shows a U-shaped trend when the random doping ratio (x) increases, and the lowest thermal conductivity is found for the case of x = 0.5, where the largest (547.57 W m−1 K−1) and lowest thermal conductivity (346.73 W m−1 K−1) correspond to single-layer C3N and C3B sheet [44]. On the other hand, the phonon relaxation time is determined by the phonon anharmonicity. Graphene has very limited phase space due to the selection rule protected by the crystalline symmetry, where the mirror symmetry perpendicular to the basal planes of graphene forbids three-phonon scattering events involving an odd number of out-of-plane flexural acoustic (ZA) phonons. The crystal structural and the strength of chemical bonds in the hexagonal carbon-nitride-boron compounds, intrinsically depends on the electron density distribution of each atoms. The electron localization function (ELF) is used to bridge a connection between the electronic structure and the resulting thermal conductivity. First-principle calculation found that the high electron localization exists at the center of carbon-carbon, indicating the electrons are shared between two carbon atoms while the high electron localization is closer to carbon atoms compared with the nitride atom in the carbon-nitride bonds [45]. From the electron analysis, it is well known that in the C−C bonds, one s orbital is hybridized with px and py orbitals to form three planar σ bonds, and py orbitals form π bonding between two C atoms to maintain the planarity. In contrast, three valence electrons of each N atom form planar σ bonds and the other two "spare" electrons fully occupy the pz orbitals. In other word, each C atom has one extra pz electron for the C-N bonds due to the fully occupied pz orbitals of N atoms. The absence of out-of-plane π bonds induces the large lattice vibration along the z direction and break down the symmetry of selection rule. The decreased phonon lifetime of ZA in C3N is due to anharmonicity of polarized chemical bonds in C3N. It is speculated that the chemical bond is not only affected by the phonon group velocity of phonon harmonic properties, but the phonon relaxation time of anharmonicity [46]. These lattice vibrational properties rely on the chemical bonding. Compared to the graphene, the lower thermal conductivity of C3N is attributed to the localized phonon vibrations along z direction from the chemical bonding of C−N.
Inspired by pioneering studies, we can speculate that there may exist some coupling effects between electronic properties, adsorption energy, dipole moment, activation barrier for CO2 adsorption, which remains elusive for studies so far. Thermal conductivity can be treated as a bridge for these properties. Herein, we have calculated these properties on Pt doped 2D BC3N2 and graphene surfaces based on density functional theory (DFT) to illustrate the determinant role of thermal conductivity. The results have shown that the lower (higher) thermal conductivity for 2D BC3N2 (graphene) corresponds to larger (lower) dipole moment, which is beneficial for CO2 activation (capture) process. Our research have not only revealed the dominant role of heat conductivity for CO2 capture and activation, but also paved the way for further catalyst design of various areas.
In this study, the thermal conductivity is obtained through non-equilibrium molecular dynamic (NEMD) simulations. All molecular dynamics simulations are performed using large-scale atomic/molecular massively parallel simulator (LAMMPS) [47]. The optimized Tersoff potential [48] is adopted to describe the interatomic interactions between C, B and N atoms of single-layer graphene and BC3N2 sheet, which has been successfully reproduced the thermal transport properties of these compounds consisting of carbon, nitride and boron atoms. The schematic configuration of the NEMD simulation is shown in Fig. 1a. The system length is set to 30 nm, which is divided into 104 slabs along the direction of heat energy transported. To prevent translational motion of atoms during the MD simulation, these atoms in the gray region at two ends are fixed. The periodic boundary condition is applied along the y direction. To build a linear temperature distribution in the system, these atoms in red and blue regions are imposed by two Langevin thermostats, and their temperatures are T0 + ΔT and T0 - ΔT, respectively. And T0 and ΔT are set as 300 K and 20 K, respectively in the simulations.

|
Download:
|
| Fig. 1. (a) The schematic configuration of the NEMD simulation setup. (b) The steady-state temperature profile of single-layer BC3N2 sheet is obtained from the NEMD method for the system length of 30 nm. The red line is the fitted line, whose slope is the temperature gradient used for calculating thermal conductivity. (c) The energy tally through the cross-section area during the last 5 ns. | |
In NEMD simulations, the time step of 0.5 fs is chosen. Firstly, the energy minimization is performed to relax the residual stress in the system. Then, the isothermal-isobaric ensemble (NPT) is applied to equilibrate the system at 300 K and 1 atm for 100 ps. After that, the canonical ensemble (NVT) is performed to obtain the desirable temperature 300 K for 100 ps. And the two heat baths of Langevin thermostats are imposed at the two ends of the red and blue regions. Then, the microcanonical ensemble (NVE) is carried out for 100 ps to equilibrate the system for obtaining the stable heat flux and linear temperature profile. At last, the temperature profile and energy are recorded for the last 5 ns shown in Figs. 1b and c. To avoid the computational error in MD simulations, all the presented MD results are averaged over three independent simulations with different initial conditions. The standard deviations are calculated to evaluate computational error. The thermal conductivities of single-layer BC3N2 sheet with different temperatures are calculated based on Fourier's Law of heat conduction as

|
(1) |
where A is the cross-sectional area that the heat flux passes through and is calculated by the product of van der Waals diameter and the width of BC3N2 or graphene systems. The van der Waals diameters of single-layer BC3N2 and graphene sheet are 3.24 Å and 3.35 Å, respectively. ∇T denotes the temperature gradient and Q is heat flux obtained by

|
(2) |
where ∆E is the energy tally from heat source and heat sink every step ∆t shown in Fig. 1c.
The calculation of the adsorption and electric properties were performed by using the Vienna ab initio simulation package (VASP) based on the first-principles theory [49, 50]. The ion-electron interactions were described by the projector augmented wave method [51]. The generalized gradient approximation (GGA) is described in the Perdew Burke Ernzerhofform and the cutoff energy for plane-wave basis is set as 400 eV. The convergence criterion for the residual force and energy was set to 0.05 eV/Å and 10−5 eV, respectively during the structure relaxation. And for all calculations, we considered the Van der Waals force correction by using MBD approach in the Grimme scheme [52]. Supercells consisting of 3 × 3 × 1 2D BC3N2 unit cells were used and the Brillouin zones were sampled by a Monkhorst-Pack k-point mesh with a 2 × 2 × 1 k-point grid for structure relaxation, while denser k-points mesh of 7 × 7 × 1 were used for electronic property evaluations. The Bader charge analysis was employed for the charge transfer. A vacuum space of 15 Å was employed to avoid the interaction between two periodic units.
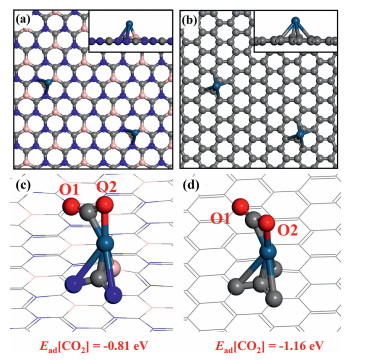
We have successfully predicted a two-dimensional BC3N2 substrate (2D BC3N2), which exhibits a hexagonal network structure like graphene. In order to figure out the unique character of 2D BC3N2, various properties are calculated and make a comparison with graphene. At first, the configurations of Pt loaded 2D BC3N2 and graphene substrates (denoted as Pt@2DBC3N2 and Pt@gra) are discussed. The optimized structures are displayed in Figs. 2a and b with atoms fully relaxed. The Pt atom can bond with BC3N2 (graphene) substract with two N atoms and one B atom (four C atoms). The CO2 exhibits similar adsorption configurations on Pt@2DBC3N2 and Pt@gra with different orientations as shown in Figs. 2c and d with O atoms defined as O1 and O2. About the coordination number, CO2 tends to bind the substrates bidentately with both C and O atom.

|
Download:
|
| Fig. 2. The top views of (a) Pt@BC3N2 and (b) Pt@gra. The side views of the configurations are displayed in the insets. The configurations of CO2 adsorbed (c) Pt@BC3N2 and (d) Pt@gra with O labeled with O1 and O2 in CO2. The adsorption energies of CO2 are displayed under the figure. | |
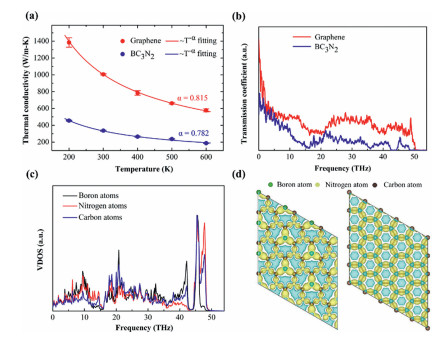
It is worthy noted that lattice deformation as one of important conditions affecting the absorption performance of 2D materials is ubiquitous because of thermal activation. The thermal conductivity of materials can quantitatively describe their compatibility of heat conduction, determining the lattice deformation induced by temperature. To explore the temperature stability of monolayer BC3N2 for adsorption application, the thermal conductivity of monolayer BC3N2 material is calculated using non-equilibrium molecular dynamics simulations. In order to make a comparison, the thermal conductivity calculations of graphene are performed at the temperature ranging from 200 K to 600 K and their simulated length of system is kept as L = 30 nm as shown in Fig. 3a. It is observed that both thermal conductivity of graphene and BC3N2 decrease with the increasing temperature. Such analogous trends are observed in other 2D materials, such as graphene, and MoS2 [53-55]. Moreover, the size effect of thermal conductivity in both graphene and BC3N2 sheets is also discussed in Fig. S1 (Supporting information). At temperatures higher than Debye temperature, the Umklapp phonon scattering dominates the thermal transport of solid dielectric materials, and the thermal conductivity decreases as κ ~ T−1 [56], which can be further demonstrated by the calculated vibrational density of states (VDOS) of monolayer graphene and BC3N2 under different temperatures in Fig. S2 (Supporting information). As the temperature increases, the phonon peaks in VDOS are broadened, indicating a smaller relaxation time due to the enhanced phonon-phonon scatterings. The dependence of thermal conductivity on temperature is fitted based on κ ~ T−α and the fitted values of α equal to 0.782 and 0.815 for BC3N2 (red line) and graphene (blue line), respectively. According to the slack relation, both the two values of α lower than 1 for graphene can BC3N2 may be attributed to the phonon boundary scattering from the finite length L = 30 nm of simulation.

|
Download:
|
| Fig. 3. (a) Thermal conductivity of single-layer BN2C3 and graphene sheet with temperature ranging from 200 K to 600 K, the solid lines is fitted by the intrinsic relationship between κ ~ T−α thermal conductivity and temperature. The red symbols represent the graphene structure; the blue symbols represent the BN2C3 structure, respectively. (b) The phonon transmission in graphene (red line) and BN2C3 (blue line). (c) VDOS for boron, nitrogen and carbon atoms in the BN2C3 structure, respectively. (d) The charge density of BN2C3 and graphene. The yellow and cyan region represent losing and gaining electrons, respectively. | |
To understand the underlying physical mechanism for the thermal conductivity difference between monolayer BC3N2 and graphene, their phonon spectral transmission coefficient Τ(ω) [57] including all the orders of anharmonicity are calculated by

|
(3) |
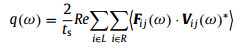
where kB and ΔT are the Boltzmann parameter and temperature difference between the two heat baths, respectively. q(ω) is the frequency-dependent heat current across the imaginary cross-section and is defined as
|
(4) |
where ts is the simulation time, and Fij is the inter-atomic force between atom i and atom j. "L" and "R" represent the left and right segment, respectively, which are located at the two sides of the imaginary cross-section. The details of NEMD set up can be found in Fig. S3 (Supporting information).
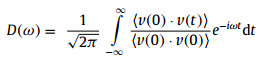
In Fig. 3b, it is clearly observed that both the phonon transmission coefficients for monolayer BC3N2 (blue line) and graphene (red line) share the similar frequency range from 0 to 50 THz. Moreover, the transmission coefficient of phonon in low frequency range smaller than 10 THz is much larger than that in other frequency range, indicating the low-frequency phonons dominate phonon transport of the two systems. Interestingly, compared with graphene, the phonon spectral transmission of monolayer BC3N2 were significantly suppressed, especially in these phonon frequency ranges of 0~2 THz, 10~15 THz and 22~50 THz. In other word, the suppressed phonons transport leads to the lower thermal conductivity of BC3N2. It is recalled that the monolayer BC3N2 can be regarded as the doped graphene with B and N atoms, where it can be speculated that the introduction of B and N atoms would add the phonon-impurity scattering originating from the mass and interaction difference [58], and degrade the capability of phonon thermal transport. To reveal the change of phonon spectral information from doped atoms, the VDOS of BC3N2 and graphene are calculated by performing the Fourier transform of the velocity autocorrelation function (VACF)
|
(5) |
where D(ω) is the phonon VDOS at ω THz, v is atomic velocity, and <v(0)·v(t)> is the velocity auto-correlation function. In Fig. 3c, it is well noted that the VDOS amplitude of C atoms is different from these of B and N atoms in the phonon frequency range of 0~15 Hz, which suggests a larger thermal resistance in monolayer BC3N2 due to the larger phonon mismatch of VODS among different atoms of BC3N2 shown in Fig. S2 (Supporting information).
Considering that the lattice vibration property is fundamentally determined by the electrons behavior, we further calculated the difference electronic density of BC3N2 and graphene as shown in Fig. 3d (more details in Supporting information). The dipole moment is an essential physical quantity describing the charge transfer between the bonded atoms. The larger dipole moment is, the stronger polarization of covalent bonding is. Our calculations in Table S1 (Supporting information) found that the dipole moment 2.01 of 2D BC3N2 sheet is much larger than that dipole moment 0.82 of graphene. Therefore, it is concluded that the polarization bond enhances the mismatch of phonon spectral density and anharmonicity of system, leading to a lower thermal conductivity of monolayer BC3N2.
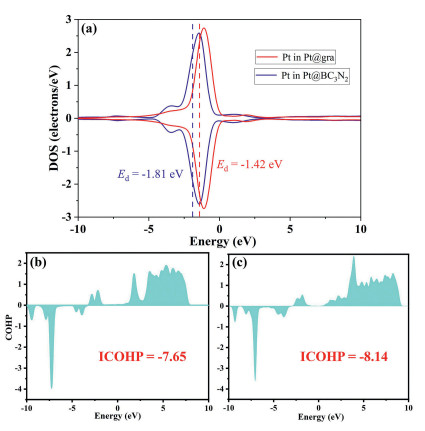
From the distribution of bader charge, the Pt atom on 2D BC3N2 is negatively charged with -0.37 e while it is only 0.01 e for graphene system, leading to a higher d-band centra (εd) (−0.42 eV) and larger adsorption energy of CO2 (Ead[CO2] = −1.16 eV) on Pt@gra (Fig. 2). Thus, the CO2 capture process is more beneficial on graphene system with higher thermal conductivity.
Besides capture ability, the activation of CO2 is also an essential process that we cannot ignore especially for the research on CO2 dissociation and hybridization. The ICOHP value between C and O atoms in CO2 in 2D BC3N2 system exhibits a more positive value (−7.65) compared to graphene system (−8.14) (Fig. 4), indicating that the antibonding orbitals of CO2 are significantly occupied compared to that in graphene system. Thus, the CO2 activation process is more beneficial on 2D BC3N2 system with lower heat conductivity. This can also be reflected from the bond lengths and angles (Tables S2 and S3 in Supporting information), which has experienced dramatic change compared to pristine CO2 especially on Pt@BC3N2.

|
Download:
|
| Fig. 4. (a) The DOS of Pt d-states in Pt@gra and Pt@BC3N2. The dotted lines denote the position of d-band centers with values labeled near the lines. The COHP between C and O atoms in CO2 adsorbed on (b) BC3N2 and (c) graphene. | |
Above all, The larger dipole moment of Pt@2DBC3N2 can promote the transfer of electrons to CO2. However, the binding ability of CO2 on Pt@2DBC3N2 is lower due to the lower energy level of electron distribution. Thus, the transfer of electrons can eventually lead to the occupation of antibonding states on 2D BC3N2 system. In addition, there exists some coupling effect between dipole moment, d-band center, and occupation of antibonding orbitals. Thus, d-band center can also be treated as a descriptor of activation process, which is beneficial at lower εd value.
In conclusion, the bridge between CO2 activation and thermal conductivity based on bond polarization is built based on the calculation of the dipole moment, electric structure, and adsorption energies, on Pt doped graphene and 2D BC3N2 substrates. Our calculated results have demonstrated that the lower (higher) thermal conductivity for 2D BC3N2 (graphene) corresponds to larger (lower) dipole moment, which is beneficial for CO2 activation (capture) process. Our study have not only revealed the dominant role of heat conductivity for CO2 capture and activation, but also paved the way for further catalyst design of various areas.
Declaration of competing interestThe authors declare that they have no known competing financial interests or personal relationships that could have appeared to influence the work reported in this paper.
AcknowledgmentsThis work was funded by the Natural Science Foundation of China (Nos. 21603109, 52006130), the Henan Joint Fund of the National Natural Science Foundation of China (No. U1404216), China Postdoctoral Science Foundation (Nos. 2020M670321, 2021T140359), the Special Fund of Tianshui Normal University, China (No. CXJ2020-08), the Scientific Research Program Funded by Shaanxi Provincial Education Department (No. 20JK0676), The Youth Innovation Team of Shaanxi Universities (No. 21JP017).
Supplementary materialsSupplementary material associated with this article can be found, in the online version, at doi:10.1016/j.cclet.2021.09.049.
| [1] |
R.A. Agarwal, A.K. Gupta, D. De, Cryst, Growth Des. 19 (2019) 2010-2018. DOI:10.1021/acs.cgd.8b01462 |
| [2] |
M. Kang, D.W. Kangand, C.S. Hong, Dalton. Trans. 48 (2019) 2263-2270. DOI:10.1039/C8DT04339F |
| [3] |
S. Liu, W.L. Li, J.P. Zhang, New. J. Chem. 44 (2020) 95-101. DOI:10.1039/C9NJ05172D |
| [4] |
M.D. Esrafili, Mol. Graph. Model. 90 (2019) 192-198. DOI:10.1016/j.jmgm.2019.05.008 |
| [5] |
G.S. Rao, T. Hussain, M.S. Islam, et al., Nanotechnology 27 (2016) 015502. DOI:10.1088/0957-4484/27/1/015502 |
| [6] |
S. Zhou, M. Wang, J. Wang, et al., J. Mate. Chem. A 8 (2020) 9970-9980. DOI:10.1039/D0TA03262J |
| [7] |
L.P. Guo, W.C. Li, B. Qiu, et al., J. Mate. Chem. A 7 (2019) 5402-5408. DOI:10.1039/C8TA12122B |
| [8] |
X. Liu, S. Wei, S. Zhou, et al., J. CO2 Util. 26 (2018) 588-594. DOI:10.1016/j.jcou.2018.06.017 |
| [9] |
C. Wang, J. Wang, X. Xiao, et al., Chin. Chem. Lett. 30 (2019) 1269-1272. DOI:10.1016/j.cclet.2019.01.007 |
| [10] |
S.P. Liu, W. Gao, Q. Jiang, et al., ChemSusChem 10 (2017) 387-393. DOI:10.1002/cssc.201601144 |
| [11] |
C.X. Zhao, Y.F. Bu, W. Gao, Q. Jiang, J. Phys. Chem. C 121 (2017) 19767-19773. DOI:10.1021/acs.jpcc.7b04375 |
| [12] |
C.L. Yao, J.C. Li, W. Gao, Q. Jiang, Phys. Chem. Chem. Phys. 19 (2017) 15067-15072. DOI:10.1039/C7CP01881A |
| [13] |
S.W. Gong, G.Q. Zhu, C.Z. He, et al., Appl. Catal. B: Environ. 297 (2021) 120413. DOI:10.1016/j.apcatb.2021.120413 |
| [14] |
B. Yang, L.T. Li, L.M. Guo, et al., Chin. Chem. Lett. 31 (2020) 2627-2633. DOI:10.1016/j.cclet.2020.05.031 |
| [15] |
C.C. Li, D.W. Lu, C. Wu, J. Ind. Eng. Chem. 98 (2021) 161-167. DOI:10.1016/j.jiec.2021.04.006 |
| [16] |
X. He, M. Wu, Z.M. Ao, et al., J. Hazard. Mater. 403 (2021) 124048. DOI:10.1016/j.jhazmat.2020.124048 |
| [17] |
C. Liu, Q. Li, C. Sun, et al., J. Am. Chem. Soc. 141 (2019) 2884-2888. DOI:10.1021/jacs.8b13165 |
| [18] |
F. Rao, G.Q. Zhu, Y. Huang, et al., ACS Catal. 11 (2021) 7735-7749. DOI:10.1021/acscatal.1c01251 |
| [19] |
F. Rao, G.Q. Zhu, Y. Huang, et al., Appl. Catal. B: Environ. 281 (2021) 119481. DOI:10.1016/j.apcatb.2020.119481 |
| [20] |
J.H. Han, S.C. Zhang, Z.F. Liu, et al., Sustain. Energ. Fuels 5 (2021) 509-517. DOI:10.1039/D0SE01515F |
| [21] |
L. Wang, G.F. Huang, Q.Z. Wang, et al., J Energ. Chem. 64 (2022) 85-92. DOI:10.1016/j.jechem.2021.04.053 |
| [22] |
S.Q. Zhou, K.Y. Chen, Q.Z. Wang, et al., Appl. Catal. B: Environ. 266 (2020) 118513. DOI:10.1016/j.apcatb.2019.118513 |
| [23] |
H. Lei, M.X. Wu, X.P. Dong, et al., Environ. Sci. Nano 8 (2021) 1398. DOI:10.1039/D0EN01028F |
| [24] |
M. Wu, Z.M. Ao, T.C. An, et al., J Hazard. Mater. 403 (2021) 124048. DOI:10.1016/j.jhazmat.2020.124048 |
| [25] |
J.H. Yu, C.Z. He, L.M. Yu, et al., Chin. Chem. Lett. 32 (2021) 3149-3154. DOI:10.1016/j.cclet.2021.02.046 |
| [26] |
Y. Liu, Q.G. Feng, Y.P. Lei, et al., Nano Energy 81 (2021) 105641. DOI:10.1016/j.nanoen.2020.105641 |
| [27] |
H.C. Peng, J. Ren, Y.P. Lei, et al., Nano Energy 88 (2021) 106307. DOI:10.1016/j.nanoen.2021.106307 |
| [28] |
C. Liu, Q. Li, C. Sun, et al., J. Am. Chem. Soc. 141 (2019) 2884-2888. DOI:10.1021/jacs.8b13165 |
| [29] |
C. Liu, Q. Li, C. Sun, et al., J. Mater. Chem. A 7 (2019) 4771-4776. DOI:10.1039/C8TA08219G |
| [30] |
Y. Li, R. Xu, J. Yang, et al., Nanomaterials 9 (2019) 266. DOI:10.3390/nano9020266 |
| [31] |
X.C. Ma, L.Q. Li, H.L. Li, et al., Appl. Surf. Sci. 481 (2019) 1139-1147. DOI:10.1016/j.apsusc.2019.03.162 |
| [32] |
J.Y. Li, M.L. Hou, Y.S. Yin, et al., Appl. Surf. Sci. 399 (2017) 420-425. DOI:10.1016/j.apsusc.2016.11.157 |
| [33] |
C.Z. He, R. Wang, S. Li, et al., Appl. Surf. Sci. 509 (2020) 145392. DOI:10.1016/j.apsusc.2020.145392 |
| [34] |
H.Y. Yang, C.Z. He, Y. Song, et al., Chin. Chem. Lett. 32 (2021) 3202-3206. DOI:10.1016/j.cclet.2021.03.038 |
| [35] |
K. Feng, J.M. Tian, B.H. Yan, et al., Appl. Catal. B: Environ. 292 (2021) 120191. DOI:10.1016/j.apcatb.2021.120191 |
| [36] |
L. Fu, R. Wang, C.Z. He, et al., Chem. Eng. J. 414 (2021) 128857. DOI:10.1016/j.cej.2021.128857 |
| [37] |
L. Fang, Z.X. Cao, J. Phys. Chem. C 125 (2021) 5048-5055. |
| [38] |
A. Zhang, Y.X. Liang, J. Zeng, et al., Nano Lett. 19 (2019) 6547-6553. DOI:10.1021/acs.nanolett.9b02782 |
| [39] |
X.J. Wang, S. Ye, J. Jiang, et al., J. Am. Chem. Soc. 142 (2020) 7737-7743. DOI:10.1021/jacs.0c01825 |
| [40] |
B. Mortazavi, Carbon 118 (2017) 25-34. DOI:10.1016/j.carbon.2017.03.029 |
| [41] |
M. An, L. Li, S. Hu, et al., Carbon 162 (2020) 202-208. DOI:10.1016/j.carbon.2020.02.055 |
| [42] |
H. Wang, Q. Li, H. Pan, et al., J. Appl. Phys. 126 (2019) 234302. DOI:10.1063/1.5122678 |
| [43] |
Y. Hong, J. Zhang, X. Zeng, Nanoscale 10 (2018) 4301. DOI:10.1039/C7NR08458G |
| [44] |
B. Yang, D. Han, X. Wang, et al., Nanotechnology 31 (2020) 185404. DOI:10.1088/1361-6528/ab6d23 |
| [45] |
B. Peng, B. Mortazavi, H. Zhang, et al., Phys. Rev. Appl. 10 (2018) 034046. DOI:10.1103/PhysRevApplied.10.034046 |
| [46] |
Z. Ding, M. An, S. Mo, et al., J. Mater. Chem. A 7 (2019) 2114-2121. DOI:10.1039/C8TA10500F |
| [47] |
S. Plimpton, J. Comp. Phys. 117 (1995) 1-19. DOI:10.1006/jcph.1995.1039 |
| [48] |
M. An, Q. Song, X. Yu, Nano Lett. 17 (2017) 5805-5810. DOI:10.1021/acs.nanolett.7b02926 |
| [49] |
G. Kresse, D. Joubert, Phys. Rev. B 59 (1999) 1758. |
| [50] |
G. Kresse, J. Furthmüller, Phys. Rev. B 54 (1996) 11169. DOI:10.1103/PhysRevB.54.11169 |
| [51] |
P.E. Blochl, Phys. Rev. B 50 (1994) 17953-17979. DOI:10.1103/PhysRevB.50.17953 |
| [52] |
L.M. Azofra, D.R. MacFarlane, C. Sun, et al., Phys. Chem. Chem. Phys. 18 (2016) 18507-18514. DOI:10.1039/C6CP02453J |
| [53] |
S. Hu, M. An, N. Yang, et al., Nanotechnology 27 (2016) 265702. DOI:10.1088/0957-4484/27/26/265702 |
| [54] |
S. Hu, M. An, N. Yang, et al., Small 13 (2017) 1602726. DOI:10.1002/smll.201602726 |
| [55] |
D. Chen, H. Chen, S. Hu, et al., J. Alloy. Compd. 831 (2020) 154875. DOI:10.1016/j.jallcom.2020.154875 |
| [56] |
M. An, H. Meng, T. Luo, et al., Chalcogenides 13 (2020) 339-370. |
| [57] |
M. An, D. Chen, W. Ma, et al., Int. J. Mass Tran. 178 (2021) 121630. DOI:10.1016/j.ijheatmasstransfer.2021.121630 |
| [58] |
Q. Song, M. An, X. Chen, et al., Nanoscale 8 (2016) 14943-14949. DOI:10.1039/C6NR01992G |