 2022, Vol. 33


b Department of Pharmaceutical Analysis, School of Pharmacy, China Pharmaceutical University, Nanjing 210009, China;
c School of Pharmacy, Department of Clinical Pharmacology, Sir Run Hospital, Nanjing Medical University, Nanjing 211166, China
Multiple myeloma (MM) is the second most common malignant disease of blood system in the world, second only to non-Hodgkin's lymphom. With the increasing number of elderly people around the world, the number of patients with MM has also increased year by year, so the treatment of this illness is of great significance [1-3]. Pomalidomide is a third-generation immuno-modulatory drug (IMiD) modified and synthesized on the basis of the chemical structure of the first generation thalidomide, which was developed by Celgene Corporation of the United States. Compared with the first- and second-generation IMiD, pomalidomide shows relatively stronger pharmacological effects, less toxic and better patient tolerance (maximum tolerance is 4 mg/d) [4-6]. In 2013, the US Food and Drug Administration (FDA) approved the use of pomalidomide for clinical treatment of patients with MM, whose disease is still progressing after two or more drug treatments [7-10]. At present, pomalidomide is still in the clinical research stage, and the treatment, mechanism of action, and side effects of other diseases need further research [11-15].
Many reported studies of pomalidomide aimed at the effectiveness and activity in various diseases include pharmacokinetics study, efficacious dosing, maximum tolerated dose, limiting toxicity dose, combination with other drugs [16-19]. There is much variation in dosage, method, schedules of administration in clinical trials of pomalidomide. So far, a few researches have reported quantitative assay of pomalidomide including high performance liquid chromatography (HPLC) with ultraviolet absorbance or fluorescence method detection, LC-MS or UPLC-MS/MS assays in rat plasma. These studies however do not provide enough validated details such as sensitivity, stability or simplicity for human clinical trials [20-22]. Therefore, it is necessary to establish a sensitive, validated and high-throughput determination method of pomalidomide in human for pharmacokinetic studies and therapeutic drug monitoring.
In this work, a method for determination of pomalidomide in human plasma using LC-MS/MS was established to evaluate the pharmacokinetic characteristics of pomalidomide capsule in healthy humans. Afatinib was used as an internal standard (IS). The biological sample was pretreated by liquid-liquid extraction, and then chromatographed by gradient elution on a Hedera ODS-2 C18 column (150 mm × 2.1 mm, 5 µm) maintained at 40 ℃ temperature. The organic phase was methanol, the aqueous phase was the 10 mmol/L aqueous solution of ammonium acetate containing 0.1% formic acid, and the flow rate was 0.4 mL/min. The multiplex reaction monitoring mode (MRM) with positive ionization of electrospray ionization (ESI) was used. The ion pairs for the quantitative analysis of pomalidomide and IS were m/z 274.2 → 163.1 (Fig. 1A) and m/z 486.1 → 371.1 (Fig. 1B), respectively. The lower limit of quantification (LLOQ) was 1.006 ng/mL, which met the detection requirements of biological samples. Moreover, pomalidomide has a good linearity in the range of 1.006 ng/mL to 100.6 ng/mL. The established method has been verified and successfully applied to the human pharmacokinetic study of pomalidomide capsules.

|
Download:
|
| Fig. 1. Product ion mass spectra of pomalidomide (A) and afatinib (B) in positive mode and their proposed fragmentation patterns. | |
Common pretreatment methods for biological samples include protein precipitation, solid phase extraction, and liquid-liquid extraction. The protein precipitation method is the most convenient approach, which can significantly reduce the sample pretreatment time and improve the analysis efficiency. The solid phase extraction method has fewer endogenous interfering substances, but the operation is complex and the commercial solid phase extraction column is expensive. The liquid-liquid extraction method can separate the lipophilic drug from the strong polarity endogenous interference based on the principle of the dissolution in the similar polarity, and its effect on enrichment and concentration can improve the detection sensitivity. At the beginning of the method development, protein precipitation method was attempted to treat the plasma samples, but the LLOQ of the analytes could not meet the quantitative requirements. Then, we investigated the ethyl acetate, methyl tert-butyl ether and diethyl ether-cyclohexane (4:1, v/v) as the extraction solvents, respectively, and found that if ethyl acetate as the extraction solvent, the background signal of the matrix sample was lower, extraction recovery rate was high, the reproducibility was good, and there was no interference with the peak position of the analyte and IS, which could meet the requirements of biological sample determination. Therefore, the ethyl acetate was selected as the plasma sample extraction solvent. Furthermore, a methanol-water (70:30, v/v) mixed solution was used as the redissolve solution when trying to analyze a batch of samples before the method validation. The results showed that signal response, peak shape and reproducibility of the analyte and IS were good. Thus, the redissolve solution was finally determined to be the methanol-water (70:30, v/v) mixed solution.
Since pomalidomide is of medium polarity, its chromatographic retention is weaker on the C18 column. Therefore, it is preferred to use a longer length column to increase the retention of the compound. After preliminary screening of several models of C18 columns, we found that pomalidomide had a better retention on a Hedera ODS-2 column (150 mm × 2.1 mm, 5 µm; Hanbon Science and Technology, Inc.). Methanol and acetonitrile are often used as the organic mobile phase for the reverse phase HPLC analysis. When acetonitrile was used as mobile phase, the chromatographic peak of the analyte was severely trailing. On the contrast, methanol as mobile phase resulted in symmetrical peak shape and improved response of analyte. In addition, acid and buffer salt solution were added into the aqueous phase to maintain a certain pH of the system for improving the resolution and retention time. The different aqueous phases (5 mmol/L, 10 mmol/L and 15 mmol/L ammonium acetate in aqueous solution) were investigated for the retention, peak shape and signals response of the analyte. It was found that the peak shape of pomalidomide was poor and the response was low after addition of 5 mmol/L or 15 mmol/L ammonium acetate aqueous solution. But the response of pomalidomide was higher after the addition of 10 mmol/L ammonium acetate. Therefore, it was considered to add formic acid to 10 mmol/L ammonium acetate aqueous solution to promote ionization, optimize response and peak shape. We compared the peak shape and response of 10 mmol/L ammonium acetate aqueous solution containing 0.05%, 0.1% and 0.2% formic acid, respectively. It was found that addition of formic acid significantly improved the peak shape and response of pomalidomide. The highest response and the best peak shape of the two analytes were observed with 0.1% formic acid. Therefore, the composition of the aqueous phase was finally determined to be a 10 mmol/L ammonium acetate aqueous solution containing 0.1% formic acid.
The initial organic phase ratio was composed of methanol and water (70:30, v/v) for 2.5 min elution, and pomalidomide peaked out within 2.5 min. After 2.5 min, the valve was switched into the liquid waste system. The organic phase ratio was increased to 100% within 0.2 min for column flushing to avoid matrix effects produced by the residue of endogenous substances that have strong retention. After 2.0 min of flushing, the organic phase ratio was returned to 70% within 0.2 min to balance the column. The balance time was 4 min and the total elution was 9 min. When optimizing the flow rate, 0.3 mL/min was first used. The retention time of pomalidomide was about 1.63 min. When the flow rate was 0.4 mL/min, the retention time of pomalidomide decreased to about 1.41 min and the response of analytes showed the highest. Increasing the flow rate to 0.5 mL/min, the retention time of pomalidomide further decreased to about 1.19 min and the response of analytes was lower. Thus, the flow rate of 0.4 mL/min was finally chosen.
Initially, the Agilent 6410B triple quadrupole LC-MS/MS mass spectrometer was initially selected for detection. The LLOQ of pomalidomide was 3.00 ng/mL. In order to meet the requirements of biological sample detection, the AB SCIEX API 4000 mass spectrometer with high sensitivity was selected for detection, and the LLOQ was reduced to 1.006 ng/mL. The ion sources used for LC-MS commonly include two types, atmospheric pressure chemical ionization (APCI) and electrospray ionization (ESI). Between them, the ESI source is mainly used for the detection of compounds with medium and strong polarity, while the APCI source is mainly used for the detection of compounds with small polarity. This is mainly because the small polar compounds are difficult to protonate and are difficult to be detected with the ESI source. Both pomalidomide and afatinib are compounds with medium or strong polarity, so the ESI source was chosen for ionization. A suitable concentration of pomalidomide and afatinib solution was injected by an injection pump into the ionization chamber at a rate of 5.00 µL/min. In the ESI positive ion full scan mode, pomalidomide mainly generated [M + H]+ excimer ion peaks m/z 274.2. Selectively scanning the product ions, the main ion fragments generated was at m/z 163.1. In the ESI positive ion full scan mode, afatinib mainly generated [M + H]+ excimer ion peaks at m/z 486.1. Selectively scanning the product ions, the main ion fragment generated was at m/z 371.1.
Endogenous interference was examined with single blank plasma from six different sources. As shown in the chromatogram, the blank sample did not show significant interference peaks near the retention time of pomalidomide and IS (Figs. S2A and D in Supporting information). The IS did not have significant interference peaks on pomalidomide (Figs. S2B and E in Supporting information), and there was no significant interference peak of pomalidomide on IS (Figs. S2C and F in Supporting information). The LLOQ of current assay was 1.006 ng/mL which was quantified with the acceptable accuracy and precision. The lowest concentration with signal-to-noise ratio (S/N) was higher than 5.
The calibration standards were run in duplicate for each validation set ranging from 1.006 ng/mL to 100.6 ng/mL. The standard curve of pomalidomide was y = 0.117x + 0.000241 (R2 = 0.9996). These results demonstrated that the calibration standards were linear, accurate, precise and below the required 15.0%. The results of intra-batch, inter-batch accuracy and precision are listed in Table 1. The investigated concentrations of pomalidomide were 1.006 (LLOQ), 3.018 (LQC), 15.09 (MQC), and 80.48 (HQC) ng/mL. The results showed that the coefficient of variation (CV, %) of intra- and inter-batch precision of the quality control samples at all the high, medium and low levels were less than 15.0%, respectively. The relative error (RE, %) of accuracy did not exceed ± 15.0%. The CV (%) of the precision of the LLOQ quality control samples was less than 20.0%, and RE (%) was not more than ±20.0%, which are in line with the requirements of biological sample analysis.
|
|
Table 1 The precision and accuracy data of the established method. |

The matrix effect results are shown in Table S1 (Supporting information). At all the low, medium and high levels, the CV (%) of the matrix factor of pomalidomide normalized by IS were not more than 15.0%, indicating that the matrix effect did not interfere with the determination of pomalidomide. The extraction recovery of IS and pomalidomide were evaluated separately. The results of the extraction recovery are shown in Table S2 (Supporting information). The precision of the recovery of both the pomalidomide and IS did not exceed 15.0%. The experimental results showed that in the blank sample, the maximum peak area response value of pomalidomide was not more than 20.0% of the minimum peak area response of LLOQ at the same analysis batch. The maximum peak area response value of IS was not more than 5.0% of the minimum peak area response of the LLOQ at the same analysis batch as well. The above results indicated that the method has no residue.
The CV (%) of the stability of the stock solution did not exceed 15.0%, indicated that the stock solution of pomalidomide and IS was stable under the placement conditions (at room temperature for 8 h and at −80 ℃ for 65 days). The CV (%) of the working solution did not exceed 15.0%, indicating that the working solution of IS was stable at room temperature for 8 h and stable placed at −80 ℃ for 65 days. The results of the plasma samples stability test are shown in (Table S3 in supporting information). The results showed that the plasma samples containing pomalidomide were stable at room temperature for 8 h. The supernatant of plasma sample after treatment was stable in the auto-sampler for 24 h. The stability of the five freeze-thaw cycles was good at −80 ℃, and the stability was good after freezing at −80 ℃ for 65 days.
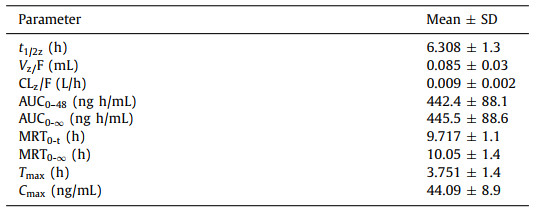
The validated LC-MS/MS method was employed to high-throughput determine pomalidomide in human plasma obtained after oral administration of pomalidomide (4 mg) capsules. The average plasma drug concentration versus time curve is displayed in Fig. 2 and the pharmacokinetic parameters of pomalidomide are listed in Table 2. In the published reports [23, 24], the plasma protein binding rate of pomalidomide was between 10% and 50%, and it was absorbed quickly after oral administration. In the body circulation, it mainly exists with the maternal form. In our study, the maximum blood drug concentration (Cmax) of pomalidomide was about 44.09 ng/mL with 4 h. The half-life (t1/2) of pomalidomide in healthy people's plasma was about 6.3 h and the area under the drug concentration-time curve (AUC0–48) was about 442.4 ng h/mL. Another study showed that the parent compound of pomalidomide accounted for more than 70% in the body circulation. Before excretion, 43% drugs were hydroxylated and glycolipidation by the mediation of cytochrome P450, and 25% drugs were hydrolyzed by glutarimide. The bioavailability of its metabolism and hydrolysate was only 1/26 of the parent drug [25, 26]. These results demonstrated that oral pomalidomide had a good absorption, mainly in the form of parent compound in the main process of body circulation, and its metabolites could be discharged in large quantities through urine.

|
Download:
|
| Fig. 2. Mean plasma concentration versus time profiles of pomalidomide in human after oral administration of one pomalidomide capsule (4 mg, Mean ± SD, n = 12). | |
|
|
Table 2 Pharmacokinetic parameters of pomalidomide in human plasma after oral administration of pomalidomide capsule (4 mg). |
In conclusion, we have established a sensitive and high-throughput quantitative method for the determination of pomalidomide in human plasma. The quantitative analysis method was optimized from various influencing factors such as pretreatment methods for biological samples, several models of C18 columns, mobile phase, phase ratio, flow rate, ion sources. The method shows good selectivity and the endogenous substances in the plasma do not interfere target determination. The linear range of pomalidomide ranges from 1.006 ng/mL to 100.6 ng/mL. Accuracy, precision, recovery and stability of pomalidomide and internal standard are all within the acceptance criteria. Matrix and residue effect do not affect the accurate quantification of the targets in plasma, which meets the requirements of biological sample analysis in clinical study. The method has been successfully applied in the clinical pharmacokinetic research of pomalidomide capsule, providing a solid platform for the guidance of therapeutic drug monitoring and new drug development.
Declaration of competing interestThe authors declare that they have no known competing financial interests or personal relationships that could have appeared to influence the work reported in this paper.
AcknowledgmentThe authors gratefully acknowledged the financial support from National Natural Science Foundation of China (No. 81603072).
Supplementary materialsSupplementary material associated with this article can be found, in the online version, at doi:10.1016/j.cclet.2021.07.009.
| [1] |
H. Chen, F. Chen, S. Pei, et al., Bioorg. Chem. 87 (2019) 191-199. DOI:10.1016/j.bioorg.2019.03.035 |
| [2] |
M.A. Dimopoulos, D. Dytfeld, S. Grosicki, et al., New Engl. J. Med. 379 (2018) 1811-1822. DOI:10.1056/nejmoa1805762 |
| [3] |
C. Durer, S. Durer, S. Lee, et al., Blood Rev. 39 (2020) 100616. DOI:10.1016/j.blre.2019.100616 |
| [4] |
E. Eleutherakis-Papaiakovou, M. Gavriatopoulou, I. Ntanasis-Stathopoulos, et al., Expert Rev. Anticancer Ther. 19 (2019) 921-928. DOI:10.1080/14737140.2019.1685879 |
| [5] |
O. Fuchs, Cardiovasc Hematol Disord. Drug Targets 19 (2019) 51-78. DOI:10.2174/1871529x18666180522073855 |
| [6] |
R. Gopalakrishnan, H. Matta, B. Tolani, et al., Oncogene 35 (2016) 1797-1810. DOI:10.1038/onc.2015.245 |
| [7] |
M. Hagihara, S. Ide, S. Ohara, et al., Int. J. Clin. Oncol. 61 (2020) 20-26. |
| [8] |
K.M. Kortum, Y.X. Zhu, C.X. Shi, et al., Blood Rev. 29 (2015) 329-334. DOI:10.1016/j.blre.2015.03.003 |
| [9] |
M.E. Matyskiela, W. Zhang, H.W. Man, et al., J. Med. Chem. 61 (2018) 535-542. DOI:10.1021/acs.jmedchem.6b01921 |
| [10] |
S. Oka, K. Ono, M. Nohgawa, J. Clin. Pharm. Ther. 45 (2020) 221-225. DOI:10.1111/jcpt.13054 |
| [11] |
C. Steinebach, S. Lindner, N.D. Udeshi, et al., ACS Chem. Biol. 13 (2018) 2771-2782. DOI:10.1021/acschembio.8b00693 |
| [12] |
S. Su, Z. Yang, H. Gao, et al., J. Med. Chem. 62 (2019) 7575-7582. DOI:10.1021/acs.jmedchem.9b00871 |
| [13] |
L. Sundaresan, P. Kumar, J. Manivannan, et al., Chem. Res. Toxicol. 32 (2019) 589-602. DOI:10.1021/acs.chemrestox.8b00286 |
| [14] |
H.W. Tun, P.B. Johnston, L.M. DeAngelis, et al., Blood 132 (2018) 2240-2248. DOI:10.1182/blood-2018-02-835496 |
| [15] |
Z. Wang, N. He, Z. Guo, et al., J. Med. Chem. 62 (2019) 8152-8163. DOI:10.1021/acs.jmedchem.9b00919 |
| [16] |
M. Dimopoulos, K. Weisel, N. van de Donk, et al., J. Clin. Oncol. 36 (2018) 2035-2043. DOI:10.1200/jco.2017.76.1742 |
| [17] |
M. Iqbal, E. Ezzeldin, K.A. Al-Rashood, et al., J. Chromatogr. B 983-984 (2015) 76-82. DOI:10.1016/j.jchromb.2014.12.036 |
| [18] |
Y. Jiang, J. Wang, D.M. Rozewski, et al., J. Pharm. Biomed. Anal. 88 (2014) 262-268. DOI:10.1016/j.jpba.2013.08.036 |
| [19] |
P. Lu, L. Wang, M. Song, et al., J. Pharm. Biomed. Anal. 114 (2015) 159-167. DOI:10.1016/j.jpba.2015.05.018 |
| [20] |
Z.I. Szabo, L. Szocs, P. Horvath, et al., J. Sep. Sci. 39 (2016) 2941-2949. DOI:10.1002/jssc.201600354 |
| [21] |
Y. Li, L. Liu, X. Wang, et al., J. Clin. Pharmacol. 58 (2018) 1295-1304. DOI:10.1002/jcph.1145 |
| [22] |
Y. Li, X. Wang, L. Liu, et al., Chin. Med. 10 (2018) 53-62. DOI:10.2147/CPAA.S167017 |
| [23] |
Y. Li, X. Wang, L. Liu, et al., Clin. Pharmacol. Drug Dev. 8 (2019) 346-354. DOI:10.1002/cpdd.470 |
| [24] |
Y. Li, Y. Xu, L. Liu, et al., J. Clin. Pharmacol. 55 (2015) 563-572. DOI:10.1002/jcph.455 |
| [25] |
K. Matsue, H. Iwasaki, T. Chou, et al., Cancer Sci. 106 (2015) 1561-1567. DOI:10.1111/cas.12772 |
| [26] |
M.N. Polizzotto, T.S. Uldrick, K.M. Wyvill, et al., J. Clin. Oncol. 34 (2016) 4125-4131. DOI:10.1200/JCO.2016.69.3812 |