 2022, Vol. 33


Fluorescent nanomaterials are of great interest in the field of display technology, detection and biomedical diagnosis/treatment [1-6]. An important milestone in the development of fluorescent nanomaterials was the discovery of fluorescent semiconductor quantum dots (QDs), which have many recognized advantages, such as high quantum yield (QY), good photostability, and controllable preparation processes. However, these highly fluorescent QDs have also suffered from negative attention, as most of them contain heavy metal ions, and the issue of toxicity is always a concern [7, 8]. Increased efforts have been made to develop less toxic, better biocompatible fluorescent nanomaterials as a potential alternative to semiconductor QDs, promoting their application especially in the field of biomedicine.
Carbon nanodots (CNDs), as a new class of fluorescent materials, have attracted much attention for their fantastic fluorescent properties and high stability [9-11]. The heavy metal-free of CNDs is the obvious advantage over conventional QDs, the major element of CNDs is elemental C, while the latter mostly have lead and cadmium [12, 13]. In the past few years, there has been considerable progress in synthesis and application of CNDs [14, 15]. Until now, the emission region of CNDs extends from a single blue color to the deep ultraviolet and near-infrared regions [9, 16, 17]. Light-emitting diodes, optical encryption and bio-imaging based on emissive CNDs have been realized [18-22]. The fact why CNDs have so much application potential is partially due to variety of reaction precursors, that is, different precursors can be used for preparation CNDs with distinct properties. Precursors of CNDs can be small molecule compounds or some carbon-based materials such as carbon nanotubes and graphene, in addition to which biomass is also a very important source of precursors [23]. On the one hand, it is possible way to convert waste biomass into a useful material. On the other hand, biomass has unique advantages over man-made carbon sources, such as cheapness, abundance of raw materials, and better environmental friendliness [24, 25]. There are already many examples of CNDs prepared using biomass as precursor, and applications based on these CNDs have also been demonstrated [26-28]. Without exception, all of them involved typical processes of high-temperature carbonization. This process may involve a long time and high temperature, which is difficult to achieve large-scale batch production. Ultrasonics-assisted synthesis method is one of effective methods for preparing nanomaterials, which has been reported CNDs for synthesis of nanomaterials [29-33]. Ultrasound produces cavitation in solution, where the high temperature and pressure environment created by this process can provide energy required for formation of nanodots [34]. However, only single color biomass based CNDs are obtained by the ultrasonic method, and there are few reports available regarding the preparation of multicolor CNDs from biomass through ultrasonic-assisted method at room temperature.
In this work, biomass based fluorescent CNDs have been demonstrated through ultrasonic-assisted method at room temperature. The CNDs can emit blue, green and red emission by tuning biomass precursors. The photoluminescence (PL) QY of the as-prepared CNDs with blue, green and red fluorescence is 11%, 12% and 28%, respectively. In addition, bacteria imaging by using the CNDs has been investigated, in which blue and green CNDs emissive can label all bacteria, while red emissive CNDs enable the identification of gram-positive and gram-negative bacteria due to competition between electrostatic repulsion and hydrophobic interaction.
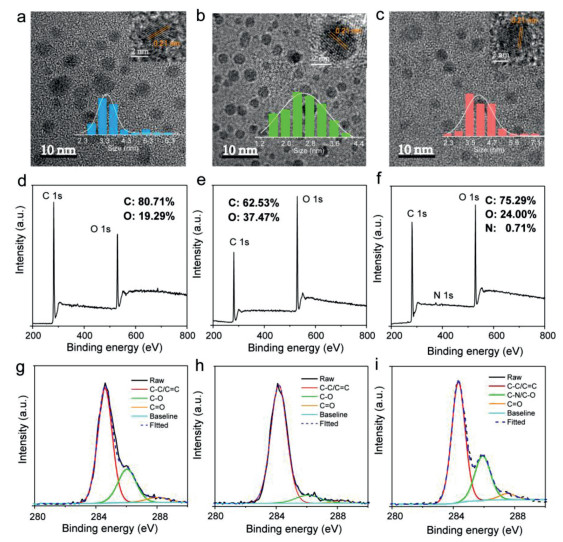
The multicolor biomass based CNDs are obtained from different precursors with the assistance of ultrasonic and bacteria imaging by using the CNDs as imaging agents has been demonstrated, as illustrated in Fig. 1. In general, the three precursors were each weighed to 4 g. Among these, honeysuckle was added to a 500 mL DMSO solution and turmeric and perilla leaves were separately added to 500 mL of dichloromethane. Blue, green and red emissive CNDs were obtained after ultrasonic treatment for 10 min. The as-prepared CNDs are further purified by silica gel chromatography to remove any excess impurities. For convenience, the CNDs with blue, green and red fluorescence are named as b-CNDs, g-CNDs and r-CNDs, respectively. The morphologies of the CNDs were characterized by a transmission electron microscope (TEM). From Figs. 2a-c, all of the CNDs have uniform size and exhibit sphere-like shapes, with average diameters of 3.7 nm, 2.6 nm and 4.2 nm (bottom inset), respectively. The high-resolution TEM (HR-TEM) images (Top inset) indicate the high crystallinity of the CNDs, with a lattice spacing of 0.21 nm [9]. These results indicate that biomass can form CNDs in a short time under ultrasonic action, without the need for additional heating procedures.

|
Download:
|
| Fig. 1. Schematic illustration of preparation of multicolor biomass based CNDs and bacteria imaging using the CNDs as imaging agent. | |

|
Download:
|
| Fig. 2. TEM images of (a) b-CNDs, (b) g-CNDs, and (c) r-CNDs, and the insets are size distribution of the corresponding CNDs. XPS patterns of (d) b-CNDs, (e) g-CNDs and (f) r-CNDs. High-resolution XPS spectra of the C 1s for (g) b-CNDs, (h) g-CNDs, and (i) r-CNDs. | |
To investigate surface functional groups onto these CNDs, Fourier transform infrared (FTIR) spectra were recorded, as shown in Figs. S1-S3 (Supporting information). The absorption bands at around 3432 cm−1 can be assigned to the stretching vibrations of -OH. The peaks at 2920 cm−1 and 2850 cm−1 are attributed to symmetric stretching of -CH3 and -CH2, which indicates that the selected CNDs contain a series of hydrocarbon groups [35]. The peak at 1640 cm−1 corresponds to C=C bending vibrations [30], the signal can be observed in the spectra of the CNDs. In addition, C=O signals were observed in the spectra of the g- and r-CNDs, indicating some carboxyl groups on the surface CND.
X-ray photoelectron spectroscopy (XPS) was used to further investigate the surfaces of the CNDs. Figs. 2d-f show the XPS spectra of the three CNDs. Only C 1s (285 eV) and O 1s (531 eV) signals can be observed from that of b- and g-CNDs, indicating b- and g-CNDs do not contain element N. This is most likely from the fact that the active ingredients of biomass precursors (honeysuckle and turmeric) are mostly carbohydrates, which the major elements are C and O elements. C, O and N elements are present in the r-CNDs from full XPS spectrum of r-CNDs. The origin of element N may be derived from chlorophyll of precursor perilla, which was doped into the r-CNDs during the ultrasonic process. The high-resolution XPS C 1s spectra are shown in Figs. 2g-i. The C 1s envelope of the b- and g-CNDs can be deconvoluted into three Gaussian peaks corresponding to sp2 C (C-C/C=C), sp3 C (C-O), and C=O at 288.2 eV, respectively [36]. The C 1s spectrum of the r-CNDs can be divided into sp2/sp3 carbons (C-C/C=C, 284.5 eV), C-N/C-O at 285.7 eV, and C=O at 288.2 eV. Moreover, 13C NMR spectra were recorded, as shown in Figs. S4 and S5 (Supporting information). Unfortunately, the NMR spectrum of the b-CNDs was not collected even though we tried for many times. For g-CNDs and r-CNDs, signals in the range of 20-50 ppm correspond to sp3 carbon atoms. In addition, resonance signals in the 120-145 ppm range are attributed to sp2 carbon atoms, indicating the formation of sp2 structural domains. Moreover, signals greater than 200 ppm was also observed in the 13C NMR spectrum of the g-CNDs, corresponding to the carbonyl group [16]. The above results indicate the sp2 and sp3 carbon atoms within the CNDs synthesized by ultrasonic assisted method.
The optical properties of the three CNDs are investigated, as presented in Fig. 3. The excitation-emission contour plots of the three CNDs show that the emission centers of three CNDs are virtually unshifted over a wide excitation range, indicating that the excitation-independent PL feature of the as-prepared CNDs in this work. As shown in Fig. 3a, the as-prepared b-CNDs solutions show the characteristic fluorescence property with emission peaks centered at 410 nm. The UV-vis absorption spectra of all three kinds of CNDs have a strong absorption band before 300 nm, which originates from the π-π* transition of C=C [18]. The UV-vis spectra of the b-CNDs show a strong absorption peak at 330 nm (Fig. 3b), which is due to the n-π* transition of C=O. However, significant aggregation in water can lead to fluorescence quenching of the CNDs, limiting their application in bioimaging. Surface modification is an effective means of avoiding aggregation between CNDs [37]. In order to achieve water-soluble CNDs, the obtained CNDs were modified by amphiphilic polymers, and the modified CNDs show bright emission in aqueous solution. The corresponding spectra of the CNDs after modification are shown in Fig. 3c, and the images of the CNDs in different solution were taken (Fig. 3d). Fig. 3e is excitation-independent PL feature of the as-prepared g-CNDs with emission peaks centered at 520 nm. In the case of the g-CNDs, there is a strong absorption band at 430 nm (Fig. 3f), which is very close to the excitation center, suggesting that the fluorescence of the g-CNDs derives from the n-π* transition under excitation of 430 nm. The modified g-CNDs are also effective in avoiding aggregation quenching, and the corresponding PL spectra and images in water, ethanol and DMSO are shown in Figs. 3g and h. For the r-CNDs, emission peaks of r-CNDs centered at 670 nm (Fig. 3i), and the corresponding absorption spectra cover from UV to red region, as shown in Fig. 3j. Specifically, two absorption peaks centered at 420 nm and 670 nm can be observed, which is due to the enlarged conjugate region [9]. Similar to the above results, the r-CNDs maintained well PL properties in water and other solutions after modification (Figs. 3k and l), which facilitates their bioimaging applications. In addition, photostability of the three CNDs were measured (Fig. S6 in Supporting information), and the fluorescence intensity of the CNDs can keep consistent under continuous UV irradiation for 6 h, indicating their good photostability.

|
Download:
|
| Fig. 3. (a) Excitation-emission contour plots of the b-CNDs. (b) UV-vis absorption spectra of the b-CNDs. The insets are the images of CNDs under sunlight and 365 nm excitation. (c) The PL spectra of modified b-CNDs are dispersed in water, ethanol and DMSO, and (d) the corresponding images under sunlight and 365 nm excitation. (e) Excitation-emission contour plots of the g-CNDs. (f) UV-vis absorption spectra of the g-CNDs. (g) PL spectra of g-CNDs dispersed in different solvents. (h) Image of g-CNDs dispersed in different solvents. (i) Excitation-emission contour plots of the r-CNDs. (j) UV-vis absorption spectra of the r-CNDs. (k) PL spectra of r-CNDs dispersed in different solvents. (l) Image of r-CNDs dispersed in different solvents. | |
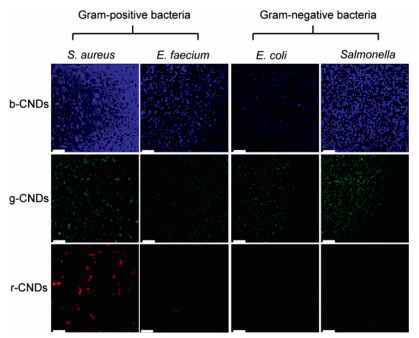
In view of excellent optical property, their bacterial imaging ability was assessed. In addition, CNDs prepared using biomass as precursors have better biocompatibility compared with synthetic chemicals, which has been confirmed in our previous work [38]. In previous work, CNDs have been demonstrated in imaging and labeling cells of mammalian systems [9, 14]. The labeling and imaging of mammalian cell strongly suggest the feasibility of extending CNDs to label bacteria. Four bacteria were selected as representative models, including two kinds of gram-positive bacteria (Staphylococcus aureus, Enterococcus faecium) and two kinds of gram-negative bacteria (Escherichia coli, Salmonella). The bacterial toxicity of the three CNDs in dark conditions was tested for Staphylococcus aureus and Escherichia coli (Fig. S7 in Supporting information), and the results showed that none of the three CNDs were dark toxicity to bacteria. The three multicolor CNDs were incubated with the mentioned bacteria for half an hour, and a confocal laser scanning microscope was used for imaging observation. In Fig. 4, strong signals can be detected from the b-CNDs stained bacteria in blue region under excitation of 405 nm, and the fluorescence signals can cover all parts of the bacteria. The similar results also obtained from g-CNDs, indicating good capabilities of the CNDs as bio-imaging agents. While there is a clear difference in the group of bacteria incubated with r-CNDs. Bright red signals can be easy detected in gram-positive bacteria, whereas for gram-negative bacteria that have been incubated, barely red signals can be detected under the same excitation conditions. Red fluorescence signal was detected on the surface of the gram-negative bacteria by using HyD detector and increasing excitation intensity (Fig. S8 in Supporting information). This indicates that r-CNDs are still present on the surface of the gram-negative bacteria, but in small numbers compared to the other gram-positive bacteria. This difference in imaging between bacteria may be attributed to the fact that the r-CNDs are more favorable for adhering to gram-positive bacteria and away from gram-negative bacteria.

|
Download:
|
| Fig. 4. The confocal laser scanning microscope images of live S. aureus, E. faecium (gram-positive bacteria) and E. coli, Salmonella (gram-negative bacteria) treated by CNDs with a concentration of 200 µg/mL for 30 min. Scale bar: 25 µm. | |
In order to understand the adhesion ability of three kinds of CNDs to different types of bacteria, the zeta potential of bacteria and CNDs in water were tested, as shown in Fig. S9 (Supporting information). Bacteria have a strong negative charge, while the b- and g-CNDs have a low charge. Therefore, there is no obvious repulsion between the b-, g-CNDs and all bacteria. Thus, b- and g-CNDs can adhere to the surface of the bacteria without resistance. For r-CNDs, the surface has strong negative charge, and electrostatic repulsion will hinder the contact between CNDs and bacteria. However, it is noted from the above results that the red fluorescence signal is readily detected in the gram-positive group, so it is likely that another force counteracts the electrostatic repulsion between the r-CNDs and the gram-positive bacteria. The hydrophobic chains on the surface of the r-CNDs endow them with affinity ability with gram-positive bacteria by hydrophobic action [20, 39]. It has also been confirmed in previous reports that weak hydrophobic ability of materials is beneficial to the affinity with gram-positive bacteria, which is dominated by the difference in membrane structure between gram-positive and gram-negative bacteria [40]. Subsequently, hydrophobic properties of r-CNDs was tested by a shake flask method [41], the hydrophobic coefficient of r-CNDs is less than 3, indicating r-CNDs is typical weak hydrophobic nanomaterials. Therefore, hydrophobic interaction between gram-positive and r-CNDs plays a key role for staining gram-positive bacteria. In addition to animal cells, fungi are also an important part of eukaryotic cells. In order to investigate whether the CNDs can be used for fungal cell imaging, Fusarium graminearum and Saccharomyces were selected as representative models. Both fungal cells were incubated with the multicolor CNDs for half an hour, and a laser confocal microscope was used for imaging observation. In Fig. S10 (Supporting information), strong signals can be detected from the b-CNDs stained fungal cells in blue region under excitation of 405 nm, and the fluorescence signals can cover all parts of the fungal. The similar results also obtained from g-CNDs and r-CNDs stained cells in green and red region, indicating good capabilities of the CNDs as fungal cell agents.
In conclusion, biomass based CNDs with blue, green and red fluorescence have been demonstrated by ultrasonic-assisted method. The entire synthesis process does not involve any synthetic high-purity chemical reagents, high temperature and pressure, leading to a significant decrease in the cost of synthesis. Optical characterizations indicate that the as-prepared CNDs have good photostability and optical properties. Additionally, bacterial imaging by using the as-prepared CNDs demonstrates the potential as imaging agents for staining bacteria.
Declaration of competing interestThe authors declare no conflict of interest.
AcknowledgmentsThis work was supported by the National Natural Science Foundation of China (Nos. 11904326, 62075198), China Postdoctoral Science Foundation (Nos. 2019TQ0287, 2019M662510).
Supplementary materialsSupplementary material associated with this article can be found, in the online version, at doi:10.1016/j.cclet.2021.08.084.
| [1] |
J.R. Manders, L. Qian, A. Titov, et al., J. Soc. Inf. Disp. 23 (2015) 523-528. DOI:10.1002/jsid.393 |
| [2] |
L.S. Wang, J. Lin, Y.S. Hu, et al., ACS Appl. Mater. Interfaces 9 (2017) 38755-38760. DOI:10.1021/acsami.7b10785 |
| [3] |
X. Wang, B. Wang, H.S. Wang, et al., Angew. Chem. Int. Ed. 60 (2021) 12585-12590. DOI:10.1002/anie.202103086 |
| [4] |
H.Y. Zhu, S.N. Ding, Biosens. Bioelectron. 134 (2019) 109-116. DOI:10.1016/j.bios.2019.04.005 |
| [5] |
X.H. Lian, M.Y. Wei, Q. Ma, Fron. Bioeng. Biotechnol. 7 (2019) 386. DOI:10.3389/fbioe.2019.00386 |
| [6] |
K.K. Liu, Q. Liu, D.W. Yang, et al., Light: Sci. Appl. 9 (2020) 44. DOI:10.1038/s41377-020-0283-2 |
| [7] |
A.H. Ip, S.M. Thon, S. Hoogland, et al., Nat. Nanotechnol. 7 (2012) 577-582. DOI:10.1038/nnano.2012.127 |
| [8] |
J. Briscoe, A. Marinovic, M. Sevilla, et al., Angew. Chem. Int. Ed. 54 (2015) 4463-4468. DOI:10.1002/anie.201409290 |
| [9] |
L. Jiang, H.Z. Ding, M.S. Xu, et al., Small 16 (2020) 2000680. DOI:10.1002/smll.202000680 |
| [10] |
J.J. Liu, D.W. Li, K. Zhang, et al., Small 14 (2018) 1703919. DOI:10.1002/smll.201703919 |
| [11] |
L. Ai, Y.S. Yang, B.Y. Wang, et al., Sci. Bull. 66 (2021) 839-856. DOI:10.1016/j.scib.2020.12.015 |
| [12] |
I.R. Benmessaoud, A.L. Mahul-Mellier, E. Horvath, et al., Toxicol. Res. 5 (2016) 407-419. DOI:10.1039/C5TX00303B |
| [13] |
A.M. Derfus, W. Chan, S.N. Bhatia, Nano Lett. 4 (2004) 11-18. DOI:10.1021/nl0347334 |
| [14] |
J.J. Liu, R. Li, B. Yang, ACS Cent. Sci. 6 (2020) 2179-2195. DOI:10.1021/acscentsci.0c01306 |
| [15] |
H. Wang, J. Wei, C.H. Zhang, et al., Chin. Chem. Lett. 31 (2020) 759-763. DOI:10.1016/j.cclet.2019.09.021 |
| [16] |
S.Y. Song, K.K. Liu, J.Y. Wei, et al., Nano Lett. 19 (2019) 5553-5561. DOI:10.1021/acs.nanolett.9b02093 |
| [17] |
S.Y. Lu, L.Z. Sui, J.J. Liu, et al., Adv. Mater. 29 (2017) 1603443. DOI:10.1002/adma.201603443 |
| [18] |
T.L. Feng, Q.S. Zeng, S.Y. Lu, et al., ACS Photonics 5 (2017) 502-510. |
| [19] |
Y.C. Liang, K.K. Liu, X.Y. Wu, et al., Adv. Sci. 8 (2021) 2003433. DOI:10.1002/advs.202003433 |
| [20] |
J.J. Yang, G. Gao, X.D. Zhang, et al., Carbon 146 (2019) 827-839. DOI:10.1016/j.carbon.2019.02.040 |
| [21] |
Y.C. Liang, S.S. Gou, K.K. Liu, et al., Nano Today 34 (2020) 100900. DOI:10.1016/j.nantod.2020.100900 |
| [22] |
B.Y. Wang, J. Li, Z.Y. Tang, B. Yang, S.Y. Lu, Sci. Bull. 64 (2019) 1285-1292. DOI:10.1016/j.scib.2019.07.021 |
| [23] |
X.Y. Zhang, M.Y. Jiang, N. Niu, et al., ChemSusChem 11 (2018) 11-24. DOI:10.1002/cssc.201701847 |
| [24] |
W.X. Meng, X. Bai, B.Y. Wang, et al., Energy Environ. Mater. 2 (2019) 172-192. DOI:10.1002/eem2.12038 |
| [25] |
W.D. Li, Y. Liu, B.Y. Wang, et al., Chin. Chem. Lett. 30 (2019) 2323-2327. DOI:10.1016/j.cclet.2019.06.040 |
| [26] |
N. Wang, Y.T. Wang, T.T. Guo, et al., Biosens. Bioelectron. 85 (2016) 68-75. DOI:10.1016/j.bios.2016.04.089 |
| [27] |
Y.J. Feng, D. Zhong, H. Miao, X.M. Yang, Talanta 140 (2015) 128-133. DOI:10.1016/j.talanta.2015.03.038 |
| [28] |
S.J. Zhao, M.H. Lan, X.Y. Zhu, et al., ACS Appl. Mater. Interfaces 7 (2015) 17054-17060. DOI:10.1021/acsami.5b03228 |
| [29] |
Z. Ma, H. Ming, H. Huang, Y. Liu, Z. Kang, New J. Chem. 36 (2012) 861-864. DOI:10.1039/c2nj20942j |
| [30] |
H.Y. Huang, Y. Cui, M.Y. Liu, et al., J. Colloid Interface Sci. 532 (2018) 767-773. DOI:10.1016/j.jcis.2018.07.099 |
| [31] |
Y.T. Zhang, K.K. Li, S.Z. Ren, et al., ACS Sustainable Chem. Eng. 7 (2019) 9793-9799. DOI:10.1021/acssuschemeng.8b06792 |
| [32] |
H. Dang, L.K. Huang, Y. Zhang, C.F. Wang, S. Chen, Ind. Eng. Chem. Res. 55 (2016) 5335-5341. DOI:10.1021/acs.iecr.6b00894 |
| [33] |
A. Gedanken, Ultrason. Sonochem. 11 (2004) 47-55. DOI:10.1016/j.ultsonch.2004.01.037 |
| [34] |
P. Das, S.K. Bhattacharyya, P. Banerji, N.C. Das, Nano-Struct. Nano-Objects 25 (2021) 100641. DOI:10.1016/j.nanoso.2020.100641 |
| [35] |
J.J. Liu, Y.J. Geng, D.W. Li, et al., Adv. Mater. 32 (2020) 1906641. DOI:10.1002/adma.201906641 |
| [36] |
S.T. Cui, Y.F. Wu, Y. Liu, Chin. Chem. Lett. 31 (2020) 487-493. DOI:10.1016/j.cclet.2019.04.014 |
| [37] |
C.L. Shen, Q. Lou, J.H. Zang, et al., Adv. Sci. 7 (2020) 1903525. DOI:10.1002/advs.201903525 |
| [38] |
W.B. Zhao, K.K. Liu, S.Y. Song, R. Zhou, C.X. Shan, Nanoscale Res. Lett. 14 (2019) 130. DOI:10.1186/s11671-019-2950-x |
| [39] |
J.J. Yang, X.D. Zhang, Y.H. Ma, et al., ACS Appl. Mater. Interfaces 8 (2016) 32170-32181. DOI:10.1021/acsami.6b10398 |
| [40] |
C. Zhou, W. Xu, P. Zhang, et al., Adv. Funct. Mater. 29 (2019) 1805986. DOI:10.1002/adfm.201805986 |
| [41] |
S.Q. Liu, R.J. Ono, H. Wu, et al., Biomaterials 127 (2017) 36-48. DOI:10.1016/j.biomaterials.2017.02.027 |